Original Article

Affiliation:
1Allergy Office, Poliambulatori Vitaclinic, 46046 Medole, Italy
Email: antico47@gmail.com
ORCID: https://orcid.org/0000-0001-7832-517X
Affiliation:
2ARPAE Emilia-Romagna, Environmental Systems Service, 43125 Parma, Italy
ORCID: https://orcid.org/0009-0007-4678-3142
Affiliation:
3Independent Researcher, 18012 Bordighera, Italy
ORCID: https://orcid.org/0009-0000-9116-6353
Explor Asthma Allergy. 2024;2:511–528 DOI: https://doi.org/10.37349/eaa.2024.00062
Received: March 22, 2024 Accepted: May 24, 2024 Published: September 29, 2024
Academic Editor: Karl-Christian Bergmann, Charité–Universitätsmedizin Berlin, Germany
Aim: Epidemiological surveys show substantial modification over time of pollens sensitization profiles, with relevant difference across geo-climatic zone. Climate changes can affect the onset, duration and production of the pollen season. Aim of the present study has been to assess the evolution over 33 years of the patients’ sensitization profile, together with pollen count and climate in a resident population of the Po Valley.
Methods: Retrospective study of primary sensitizations to 6 major pollens (grass, pellitory, birch, olive, ragweed mugwort) from 1986 to 2019 on patients aged 12 years or older with respiratory allergic diseases living in Mantua suburbs. Pollen counts and season durations were recorded by the monitoring station of Parma. Meteorologic data have been downloaded from the historical archive of Mantua monitoring station.
Results: A population of 3,489 patients who tested positive to pollens have been considered (34% to one pollen only; 66% poly-sensitized, 68% out of them to two or more pollens). Average annual temperature has risen of 1.4°C. An overall trend for extension of seasons duration and increase of pollen load has been observed. Sensitization rate to grass remained stable over time when pellitory showed a sudden decline. Sensitization rates to birch, olive and ragweed displayed a sharp increase.
Conclusions: The present study proves that significant change on phenological phases of main allergenic plants, pollen load and sensitization profile of patients have occurred over the last decades. Global warming seems to be one of the main causes for these changes. More epidemiological studies differentiated by regional geo-climatic zone and a multidisciplinary approach to research on topic are needed.
Hay fever, with or without asthma, triggered by airborne pollen is by far the most common form of seasonal respiratory allergies. Epidemiological surveys show wide variation in the reported prevalence and in its evolution over time in different regions of the world. Yet, in Italy and in most countries of Europe, a substantial increase in allergic rhinitis in recent decades has been observed [1–3]. Global warming, together with elevated atmospheric levels of CO2, affects the onset, duration, and intensity of the pollen season and, consequently, the total pollen load. Greater and longer pollen exposure may result in a higher prevalence of seasonal respiratory allergies and severity of symptoms [4–6]. Substantial variations in species’ ranges and/or distributions seem to be another important long-term consequence of climate change, which in turn can entail substantial modification of pollen sensitization profiles [7–9].
Sensitization profiles of patients suffering from seasonal allergic rhinitis change across geoclimatic areas, mainly depending on the variability of pollen exposure. International surveys provide a broader view, by macro-areas, of the changes over time of pollen exposure and of the sensitization profiles to common aeroallergens, which may not be representative of specific habitats [10–13]. Therefore, epidemiological surveys focusing on well-characterized regional geoclimatic areas are important to complete and compare the results of large international studies.
The Italian country can be divided into two macro-climatic areas, Mediterranean and Continental, and into six climatic zones (Figure 1). To the best of our knowledge, the progressive long-term changes in pollen sensitization have been studied only in patients living in the Ligurian zone, characterized by a Mediterranean climate with mild and rainy winters, warm and ventilated summers [14–16]. The present study refers to the stationary population of the Po Valley, a zone characterized by a continental climate, with cold and moist winters, frequent dense fogs, warm and muggy summers. The evolution of pollen sensitization profiles of patients suffering from respiratory allergy diseases and living in Mantua suburbs has been studied throughout 33 years, together with meteorological data and the pollen counts of the nearest pollen-monitoring station.
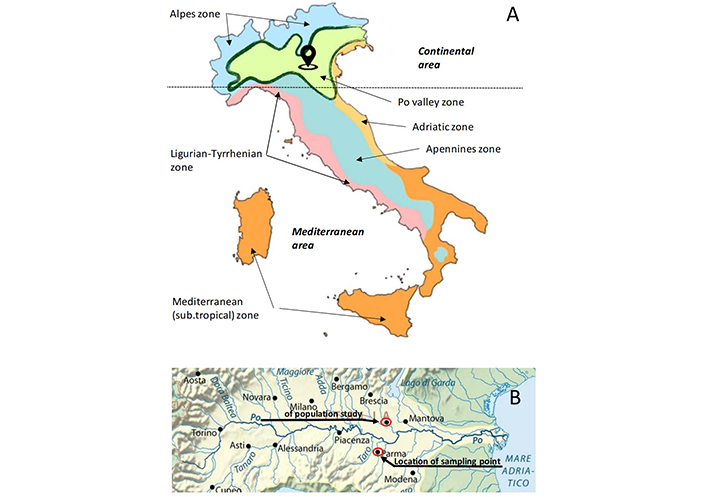
Climatic and geographic maps. (A) Climatic area and climatic zones of Italy; (B) geographic map of Po Valley with location of pollen sampler and residential area of population study
Note. Figure 1A adapted with permission from “The climate in Italy” by Gruppo Mineralogico Paleontologico Euganeo (G.M.P.E.); c2005–2024 (https://www.gmpe.it/meteorologia/clima-italia). © G.M.P.E. Figure 1B adapted from “Drainage basin of Po River” by Wikimedia Commons; c2023 (https://commons.wikimedia.org/w/index.php?title=File:Po_bacino_idrografico.png&oldid=761424632). CC BY.
Retrospective study on the trend over time of pollen-sensitization profiles of patients with respiratory allergic diseases living in Mantua suburbs.
The study is based on data file and is exempt from ethical committee approval.
Data of patients aged 12 years or older referred to outpatient allergy clinic of Asola Hospital (from 1986 to 2013) and Volta Mantovana Hospital (from 2014 to 2019) for allergy respiratory symptoms who tested positive have been recorded in a common spreadsheet. The suspension of activities due to Covid-19 pandemic and the subsequent rearrangement of outpatient clinics functions didn’t allow us to collect further epidemiological data.
Patients were skin tested with a panel of standardized commercial extracts (Lofarma, Milan, Italy) always including (but not limited to) house dust mites, cat, dog, Alternaria, Aspergillus, grass (Graminaceae), pellitory (Parietaria), olive (Olea), birch (Betula), hazelnut (Corylus), mugwort (Artemisia) and ragweed (Ambrosia). Skin prick-tests were performed according to guidelines and recommendations of Italian Society of Allergy and Clinical Immunology and of European Academy of Allergy and Clinical Immunology [17–19]. Patients not resident and extra-EU resident who were not born in the province of Mantua were not included.
Only primary sensitizations data are reported in the present study. Skin-test positive results were matched with the results of specific IgE assay (over the years: RAST; FAST; CAP RAST FEIA Pharmacia; ImmunoCAP/Uni-CAP system Phadia, Upsala, Sweden). In case of patient skin-tested positive to more one pollen allergen primary clinical sensitizations have been defined according to above mentioned guidelines [18, 19].
Starting from 1998, when appropriate, commercially available recombinant allergens of grass (Phl p 1, Phl p 2, Phl p 5, Phl p 12), pellitory (Par j 2), mugwort (Art v 1, Art v 3), ragweed (Amb a 1), birch (Bet v 1, Bet v 2, Bet v 4) and olive (Ole e 1) were also tested. Therefore, along with clinical criteria, primary allergen sensitizations were established according to new findings and diagnostic guidelines on component resolved diagnostics [20–22].
Before 1997, as ragweed was deemed absent in our area, only cases of ragweed mono-sensitization have been reported. As Art v 6 was not included in the panel of recombinant allergen, a possible slight overestimation (< 15%) of ragweed sensitization rate might be considered [23].
Meteorologic data considered for the present study include monthly minimum, maximum and average values for temperature, rainfall, relative humidity, rainy and foggy days. All data have been downloaded from historical archive of ilMeteo Srl (available at: https://www.ilmeteo.it/portale/archivio-meteo/Mantova)
There are not in the district of Mantua available pollen-monitoring stations. Pollen samplers’ network of Lombardy Region monitors the districts of Milan metropolitan city, Pavia and Sondrio (mountainous areas), all locations away from the towns in which our study has been carried out. In the present study we report data of pollen counts of the 6 major allergenic species (grass, pellitory, birch, olive, mugwort and ragweed) recorded by monitoring stations of Parma (ARPAE, POLLnet of SNPA: National System for Environmental Protection, Emilia-Romagna Region Agency; from 1990 to 2019).
Parma air distance from our suburbs is about 50 km. Pollen measurements are point measurements which in general are deemed valid for an area of about 30 km, but higher range are admissible for flat lands with homogeneous geo-climatic conditions [24].
A Hirst-type sampler, based on the impact principle (VPPS 2000, Lanzoni, Bologna, Italy) was used. The sampler was permanently exposed to wind by means of a rotating air vane and placed at a height of 20 m from ground level in the city of Parma. The suction flow rate was 10 L of air per minute, similar to the volume of air inhaled in normal breathing. The sampler has an entrance orifice measuring 14 × 2 mm, a tape coated with silicone rotate inside the sampler at a speed of 2 mm/h providing daily samples every 48 mm. Pollen grains were stained with basic fuchsine and read under an optical microscope at 400× magnification.
The beginning of the pollen season was defined as the first of 3 consecutive days with a count of 10 or more grains/m3. Similarly, the end of the season was the first of 3 consecutive days with fewer than 10 grains/m3. For pollens showing stable phase of low concentration (< 10 grains/m3) start of season was considered the first of 5 consecutive days of pollen collected, and the end the first of 5 consecutive days with no pollen collected [25].
Cumulative data on patients and sensitization are expressed as mean of annual means. General trends of environmental temperature, pollen sensitizations and pollen count during the years considered have been showed on charts, highlighted by lines of correlation. To reduce the effect of yearly variability and better highlight the differences occurred over the time period examined in the present study, data of the initial five years have been compared with those of the final five years. A two-sample T-test has been applied to determine significance of difference (P ≤ 0.05).
Over the period considered 3,489 patients (aged 12–65 years; 58% women; mean age 30 ± 15; from 72 to 146 patients per year, 106 on average) who tested positive to pollens were entered in an electronic file.
Thirty four percent of them resulted mono-sensitized to only one pollen. Sixty six percent showed poly-sensitization: namely more than one pollen or co-sensitization to other allergens. Out of them 68% to two or more pollens; 49% to dust mites, and 21% of the case to others allergens (molds or animal dander).
The percentage of patients not sensitized to pollens but only to house dust mite and/or molds and dander was around 40% (mean 39 ± 4) and stable throughout the years.
Graminaceae (Figure 2) remain the leading cause of pollen allergy, as about sixty to eighty percent of patients were sensitized to grasses pollen. The rate of sensitization shows to be substantially stable over time with a slight, not significant upward trend (Figure 2A).
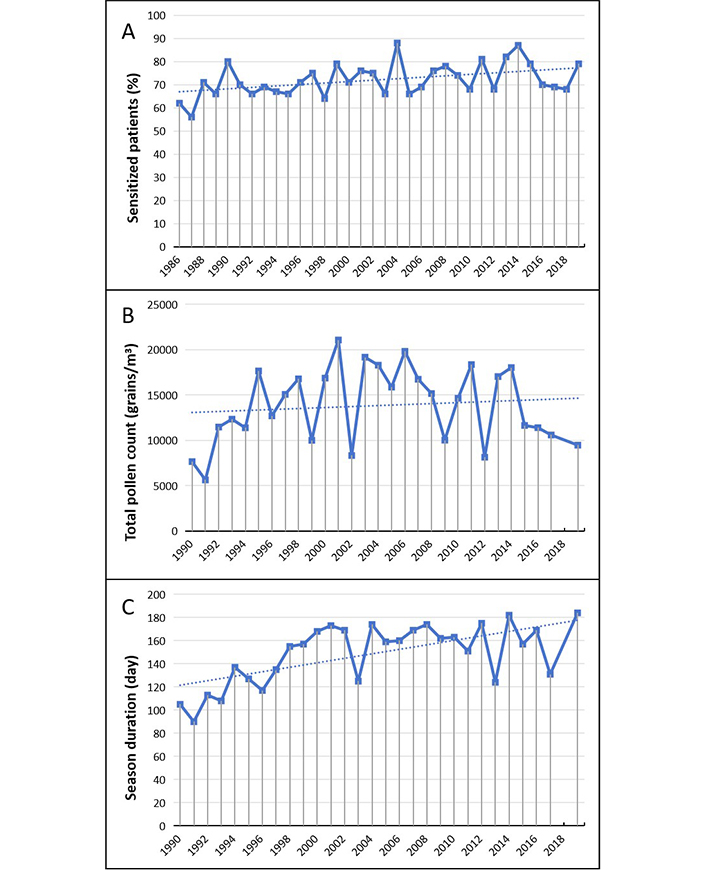
Graminaceae. (A) Percentage of sensitized patients; (B) total pollen count; (C) duration of the pollen season. The data for B and C in 2018 is not available and can be considered as missing values. The dotted line represents the data trend
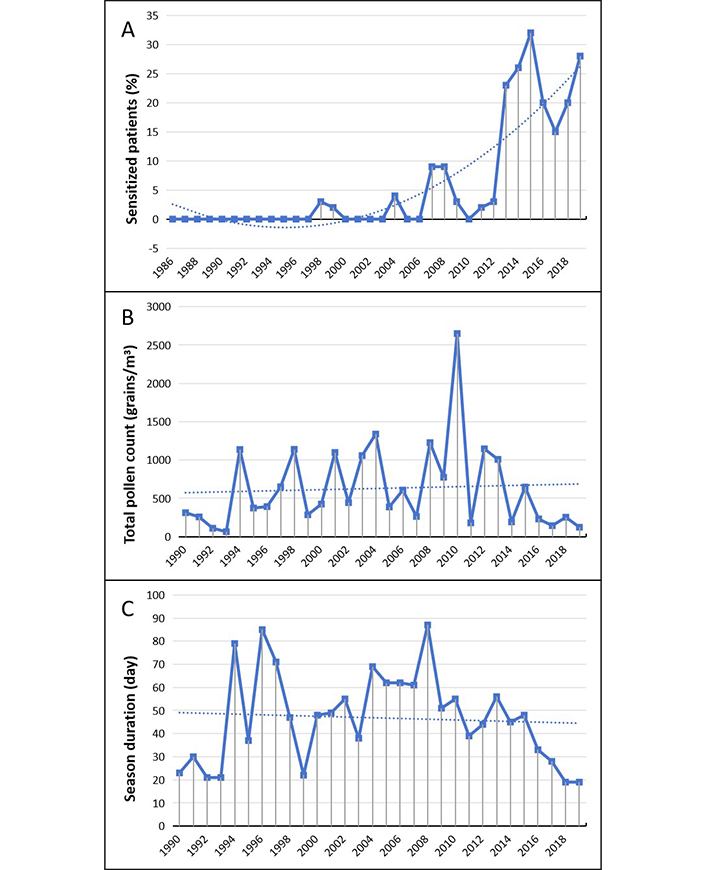
The rate of sensitization to Parietaria pollen (Figure 3) shows over the time a remarkable decline, with a shift from a pick of 60% during the decade 1986–1996 to rates of sensitization of around 20% over the decade 2010–2019 (Figure 3A).
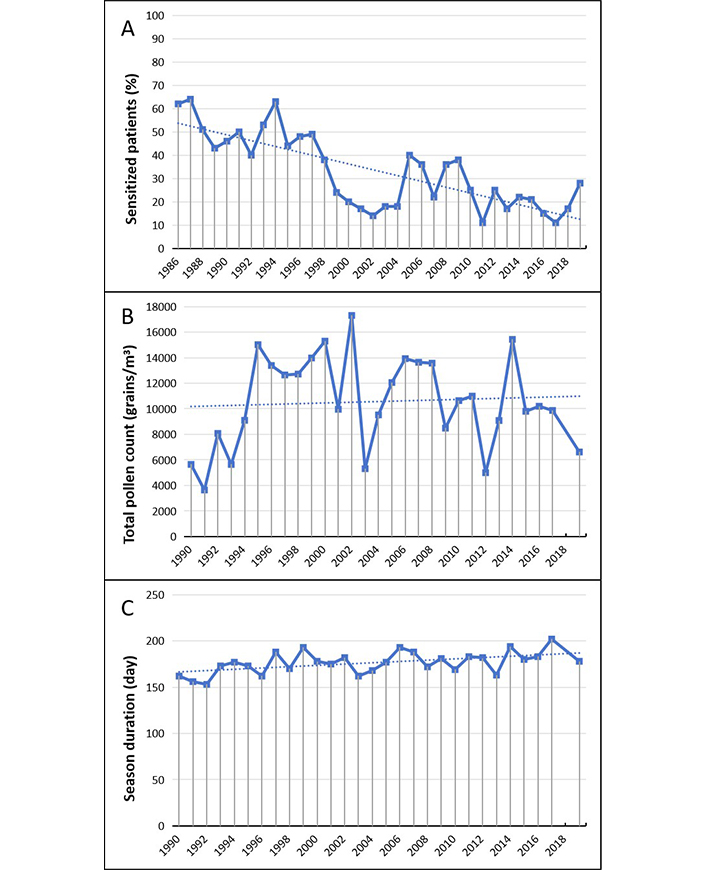
Parietaria. (A) Percentage of sensitized patients; (B) total pollen count; (C) duration of the pollen season. The data for B and C in 2018 is not available and can be considered as missing values. The dotted line represents the data trend
Sensitization to Betulaceae (Figure 4), sporadic until the beginning of the 90s, has increased progressively and regularly up to 30% and beyond in the last five years (Figure 4A).
Betulaceae. (A) Percentage of sensitized patients; (B) total pollen count; (C) duration of the pollen season. The dotted line represents the data trend
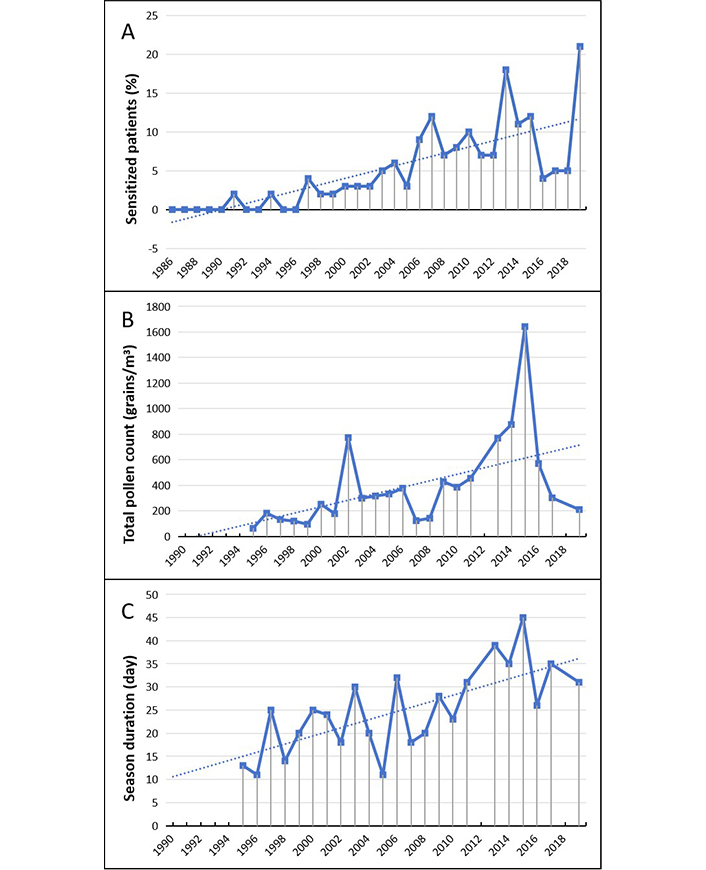
Similarly, sensitization to Olea pollen (Figure 5), virtually absent in the area until the first years of the new millennium, has rapidly increased to about 25–30% of cases in the last years (Figure 5A).
Olea. (A) Percentage of sensitized patients; (B) total pollen count; (C) duration of the pollen season. The dotted line represents the data trend
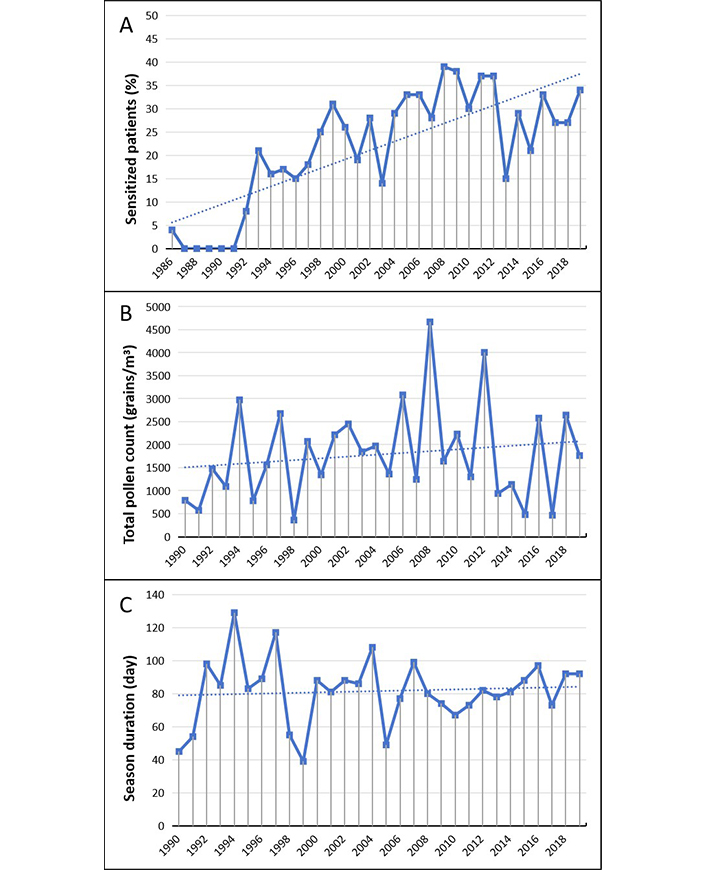
Ragweed allergy (Figure 6), never detected before in our population, started to occur by some sporadic cases at the beginning of the 90s and then gradually has increased until a rate of 10–15% in more recent years (Figure 6A).
Ambrosia. (A) Percentage of sensitized patients; (B) total pollen count; (C) duration of the pollen season. The data for B and C in 1990–1995, 2012 and 2018 are not available and can be considered as missing values. The dotted line represents the data trend
Sensitization to Artemisia pollen (Figure 7) shows evident annual variations (Figure 7A). However, there are not significant differences on sensitization rates comparing the beginning and final periods of five years (P = 0.437).
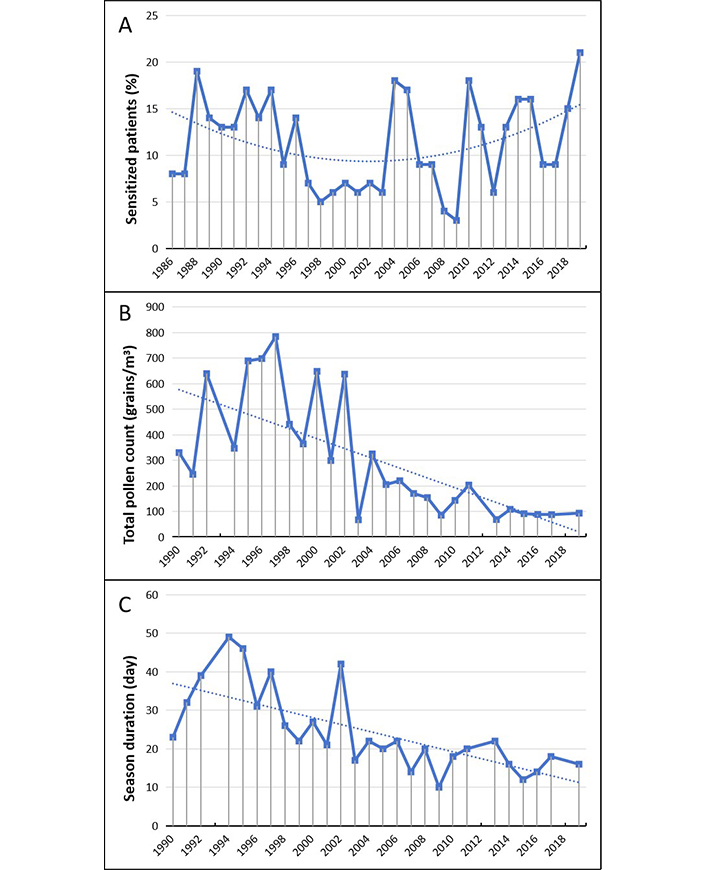
Artemisia. (A) Percentage of sensitized patients; (B) total pollen count; (C) duration of the pollen season. The data for B and C in 1993, 2012 and 2018 are not available and can be considered as missing values. The dotted line represents the data trend
Annual average temperatures show a slow but progressive increase (Figure 8). By comparing data of 1986–1990 years with 2015–2019 years average temperature has gone up of 1.39°C (P = 0.0002).
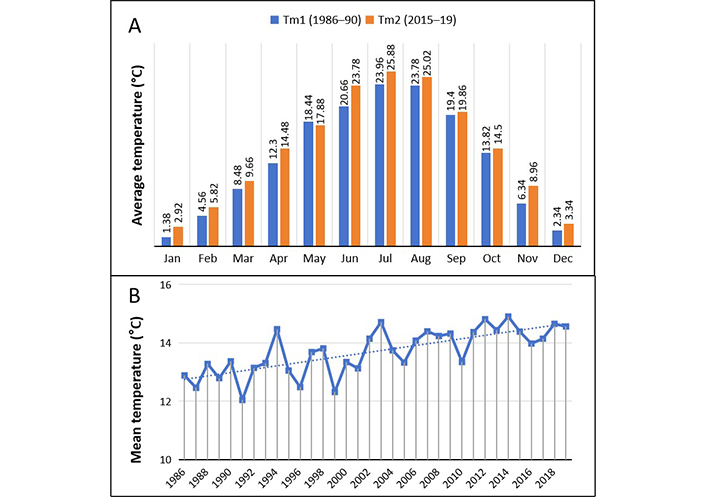
Comparative analysis of temperature trends. (A) Month by month comparison of average temperature of years 1986–90 (Tm1, °C) with that of years 2015–19 (Tm2, °C); (B) annual trend of mean temperature (°C) for the analyzed period is shown (See text). The dotted line represents the data trend
Noteworthy, the number of foggy days progressively decreased from an average of 86 days/year during 1986–1990 to 51 for 2015–2019 (P = 0.006). Unfortunately, because a lot of missing data it was not possible to calculate the rain volume variations.
The spreading of grass pollens shows a trend to a yearly slow progressive increase during the period considered (Figure 2B). However, by comparing pollen total counts of the first five with the last five years the difference proves not to be significant (9,694 vs 10,513 grains/m³; P = 0.178). The duration of grass pollen season shows a progressive significant lengthening with an average increase of 54 days in the last five years (Figure 2C).
Pollination rate of Parietaria (pellitory) shows an increase over time, but variation of the averages of total counts don’t reach levels of significance (Figure 3B). However also in this case we can see a significant increase in the duration of the pollination season which results on average longer of 23 days (Figure 3C).
Pollination of Betulaceae (which include Betula and Alnus genders) shows a great seasonal variability, but without substantial difference on pollen load if the beginning and final periods of five years is considered (Figure 4B). Likewise, there are no significant differences in the length of the pollination season (Figure 4C).
Even in the case of olive, a similar considerable variability on seasonal average of total counts can be observed, with some noteworthy peaks (Figure 5B). However, there are no significant differences over the considered years neither for the pollen load nor on duration of pollination season (Figure 5C).
Ambrosia pollens have been counted separately from other Compositae starting from 1995. In that year they were captured by the sampler at very low load and average concentration (< 3 grains/m³). Thereafter the total counts showed a fast and almost constant increase (Figure 6B). It can therefore be presumed that ragweed pollens were virtually absent in the previous years. The average duration of the pollen season results of about 35 days, almost double of the mean of the first five years (Figure 6C).
The total counts of Artemisia pollens have been a progressive and almost continuous decrease starting from the early 2000s (Figure 7B). This fall has been accompanied by a simultaneous and analogous significant shortening of the pollination seasons (Figure 7C).
A spreadsheet with a synoptical exposition of changes of phenological data and of patients’ sensitization profile has been provided (Table 1).
Synoptical exposition of the changes on phenological data of main allergenic plants and patients’ sensitization profile, averages of annual values: initial five years compared to the final five years
| Pollens | Season duration, days (P) | Total count, grain/m3 (P) | Sensitizations percentage (P) |
|---|---|---|---|
| Graminaceae | 110 vs 165 (P = 0.002) | 9,694 vs 10,513 (P = 0.178) | 67 vs 73 (P = 0.102) |
| Parietaria | 164 vs 187 (P = 0.007) | 6,418 vs 10,382 (P = 0.062) | 53 vs 18 (P = 0.001) |
| Betulaceae | 82 vs 86 (P = 0.394) | 1,381 vs 1,586 (P = 0.386) | 15 vs 28 (P < 0.001) |
| Olea | 29 vs 35 (P = 0.363) | 375 vs 279 (P = 0.352) | 2 vs 23 (P < 0.001) |
| Ambrosia | 18 vs 35 (P = 0.018) | 165 vs 720 (P = 0.032) | 2 vs 8 (P = 0.013) |
| Artemisia | 38 vs 18 (P = 0.014) | 459 vs 90 (P = 0.008) | 13 vs 21 (P = 0.437) |
The global warming and the current increase in atmospheric carbon dioxide concentration entail a wide range and far-reaching effects on the environment and can lead over time to remarkable variation in natural ecosystems [26].
A consistent number of studies proves that the progressive increase of temperature can modify the phenological phases of allergenic plants with an earlier onset and a longer duration of the pollen season and an increase in the production and release of pollens. An obvious repercussion of these changes is the lengthening of the period in which patients can suffer from allergy symptoms.
Moreover, there are compelling evidences that rising air temperatures in combination with the increased CO2 concentration can induce in some plant species an augmented production of pollens’ allergy proteins and an increase of their sensitizing power [25, 27–31].
According to the above findings, results of this study show that temperature has gone up over the time, the pollen load has increased, the duration of pollen season has extended and the distribution of pollen allergy has changed. The distance between the pollen sampling station and area of population study should not be considering a study weakness. Aerobiological studies prove that data of pollen samplers are valid across a wide range of plain areas with homogeneous geoclimatic conditions (Figure 1) [24].
Graminaceae remain the main cause of pollen allergy, in accordance with the large European epidemiological studies [11, 32]. Unforeseen instead the evolution of sensitizations to the other pollen considered.
Parietaria is a very important cause of sensitization in the Mediterranean area, where it is responsible for up 25–30% of all allergy respiratory diseases [33]. In some geographical areas it can account for more than 50% of cases and represents the prevalent sensitization in the allergic population of Southern Italy [34, 35]. From the second half of 1980s and during the first half of 1990s a sensitization rates to pellitory of 50–60% on average has been observed in our population, statistically not dissimilar to those of grasses [36]. These findings were similar to those of Ligurian and Mediterranean zones and deemed exceptional when compared to common clinical experience of the allergy clinics of other areas of the North Italy [4, 37]. In the following years a rapid and progressive fall of sensitization rate until 20% on average was observed. This evolution seems to be inexplicable, as pollination rate has remained stable over the time and pollination season has lengthened of about one month. However, deserves specific attention the fact that a similar trend has been reported in Sicily, even if the study is lacking in related seasonal pollen counts [35].
Previously irrelevant, birch pollen becomes an important cause of sensitization starting from the beginning 90s, then showing a regular progressive upward trend. These epidemiological observations show to be in line with other remarks in the North of Italy [4, 15, 38, 39].
Birch grows preferentially in northern temperate regions and Betula pollen is the most dominant tree pollen in Northern and Central Europe and is a major cause of allergic rhino-conjunctivitis and pollen food syndrome [40]. In Italy birch trees are mainly spread on alpine and sub-alpine zones of Piedmont and Lombardy and along le ridge of Northern and Central Apennines.
To explain the significant and unexpected increase in allergic sensitization to this allergen on the plain, some authors have called into question the use of birch as ornamental trees in gardens and urban parks [10]. Pollens collected from trees living in gardens with higher daily mean temperature show an increased content of the major allergens and higher allergenicity [41, 42].
However, an analysis of European pollen data on a continental-scale seems to prove that increased temperatures do not appear to be a major influencing factor of pollen-load global increase. In particular, as far as birch concerns, significant negative correlation between pollen production and temperature trend to increase has been shown [43]. As alternative hypothesis, the role of cross-reactivity to birch-related species within the Fagales order should be considered [44].
The spreading of olive (Olea europaea) cultivation and the evolution over time of olive pollen sensitization are an unequivocable example of the effects of the climate change. An important long-term consequence of global warming is the variations in species ranges and distribution with significant variations across geographic regions. In general, as temperatures increase, tropical and subtropical areas broaden, and many species are expected to migrate poleward and uphill [26, 27]. This seems to be the case of the spread of olive tree cultivation.
Olive pollen has always been and is still considered one of the most important causes of respiratory allergic manifestations in Southern Italy [10]. It was virtually absent in the plains of Northern Italy as the olive plantation were restricted to some lake areas. Because of climate warming olive cultivations have greatly increased and already in the early 90s they were broadened up to subalpine areas [45]. Furthermore, olive trees are widely used as ornamental plants also in gardens and urban park of the Po plain cities.
Significant concentrations of olive pollens were collected starting from the first 90s. However, a significant number of cases of olive pollen sensitization, constant over time and in continuous progressive increase, has been observed starting from the beginning of the second decade of the 2000s. Also, an epidemiological study carried out in Parma from 1992 to 2003 was found a progressive increase of olive pollen concentration but without corresponding spread of sensitization cases [46]. A possible explanation might be a long duration of the time needed between beginning of exposure and the onset of sensitization’s cases.
Previously deemed a major health problem limited to USA ragweed pollen allergy has become common across Europe. The reasons for this increased spreading are not entirely understood. Ragweed is a highly invasive plant and spreads quickly, colonizing in particular wastelands and ruderal areas around urban centers. The leaving and neglect agricultural areas seem to be a major cause of ragweed propagation [47, 48]. Global warming might be another very important cause of ragweed spreading [49].
Ambrosia allergy was virtually unknown in Italy until around the end of the 80s, when the presence of pollens began to be found in a number of counters of the Northen Italy and the first cases of sensitization reported [50].
The allergenic potential of Ambrosia pollen proves to be very high. It has been proved that just 1–3 pollen grains/m3 of air can cause allergic symptoms in sensitized patients [51]. And more than 10 pollen/m3 should be considered as a high pollen load [52]. To support these figures some experimental studies demonstrate that the global warming and elated CO2 concentration strongly enhance sensitization and allergenic potential of ragweed pollens [30, 31, 53].
In Lombardy, the most widespread colonization is located on the West-Northern Zones where the epidemic of Ambrosia allergy started. In about 20 years (1989–2008) the patients’ sensitization from 13% reached about 45% of cases by the end of the study period [45]. The considerable and worrying increase of allergy cases during the 1990s persuaded the Regional Authorities to promulgate plans of systematic environmental cleanup [54, 55].
In the study population an epidemiologically significant rate of sensitization to Ambrosia pollen was seen starting from the second half of 1990s, and then proved in progressive and quite constant increase. However, it cannot be stablished whether this scenario might be the consequence of a progressive ragweed invasion of our territory or a consequence of the pollens air transport from the areas of intense ragweed colonization [10].
The plants of genus Artemisia are native to temperate Europe and are widespread in Italy (from plain to an altitude of 600/1000 m). For decades Artemisia vulgaris has been a species of allergology interest as the pollen of mugwort was one of the main causes of allergic reactions in late summer and autumn.
Artemisia sensitization was usually found in polysensitized patients and in Italy population as in some other European reposts accounted for about 10–15% of pollinosis cases [56]. The ragweed colonization, the onset and the fast increase of sensitization cases to Ambrosia pollen posed some relevant clinic problems. Ragweed and mugwort have overlapping flowering season and share many antigenic structures which are responsible for cross-reactivity among pollen-sensitized patients. As a consequence, the differential diagnosis between ragweed and mugwort pollen allergy can be done mainly by component-based sensitization profile [22, 55–59].
A survey (2014) aimed to study geographic and temporal variations in pollen exposure across Europe reported a trend (although not significant) toward a decreased exposure to Artemisia pollen and increased exposure to Ambrosia [12]. This different behavior can be seen also in our series. It might be a direct effect of ragweed widespread, since it has been observed that ragweed plants compete with mugwort for the colonization of wastelands supplanting the native species [60]. However, in our series the rate of sensitization to mugwort pollen appears to be overall stable over time. A result that doesn’t fit well with those of pollen counts, and is difficult to explain.
The present study adds evidence that the climate change and in particular the global warming (in our zone we documented an increase of about 1.4°C over the last three decades) significantly impact over the time on pollens production, in the timing and length of the pollen season, on the distribution of the allergenic plants and in their sensitizing power. Consequently, the sensitization profile of patients has changed and continues to change.
The results of our observations are only partially congruent with the results of others analogous studies on topic, in Italy as in Europe. This confirms that climate change impacts differently different climatic zone, also in the same region.
The similitudes and the differences above highlighted and discussed stress the importance of long-term data series on phenology and distribution of leading pollens and related patients’ sensitizations profiles.
More researches are needed to better understand the interactions between climate change and allergic disease. A multidisciplinary approach seems to be strictly necessary, taken into account of the complexity of the consequences that the global climate change causes on ecology of biological systems. A conceptual map of needed research activities has been proposed by others Authors [27].
In our opinion the present study represents not only a useful contribution to data gathering of what happens in a wide climatic zone of our country, but also it can provide an insight on similar geoclimatic areas of other European countries. These knowledges are important to better direct the activities of prevention and control of allergic diseases, and to better schedule allergy immunotherapy.
AA: Conceptualization, Resources, Data curation, Formal Analysis, Writing—original draft. BC: Data curation, Resources, Formal analysis. AR: Formal analysis, Writing—review & editing. The manuscript has been read and approved by all the authors.
The authors declare that they have no conflicts of interest.
Ethical approval was waived by the Ethical Committee of Azienda Ospedaliera “C. Poma” because this study analyzed retrospective data.
Informed consent to participate in the study was obtained from all participants.
Not applicable.
The data of this manuscript could be available from the corresponding authors upon reasonable request.
Not applicable.
© The Author(s) 2024.
Open Exploration maintains a neutral stance regarding jurisdictional claims in published maps and institutional affiliations.
Copyright: © The Author(s) 2024. This is an Open Access article licensed under a Creative Commons Attribution 4.0 International License (https://creativecommons.org/licenses/by/4.0/), which permits unrestricted use, sharing, adaptation, distribution and reproduction in any medium or format, for any purpose, even commercially, as long as you give appropriate credit to the original author(s) and the source, provide a link to the Creative Commons license, and indicate if changes were made.