Affiliation:
1Chemistry Department, Postgraduate Program in Chemistry, Federal University of Tocantins, Gurupi 77410-530, Brazil
Affiliation:
1Chemistry Department, Postgraduate Program in Chemistry, Federal University of Tocantins, Gurupi 77410-530, Brazil
2Chemistry Department, Federal University of Tocantins, Gurupi 77410-530, Brazil
ORCID: https://orcid.org/0000-0002-5227-9539
Affiliation:
1Chemistry Department, Postgraduate Program in Chemistry, Federal University of Tocantins, Gurupi 77410-530, Brazil
2Chemistry Department, Federal University of Tocantins, Gurupi 77410-530, Brazil
Email: nelson.luis@uft.edu.br
ORCID: https://orcid.org/0000-0002-5980-3209
Explor BioMat-X. 2025;2:101326 DOI: https://doi.org/10.37349/ebmx.2025.101326
Received: October 10, 2024 Accepted: December 28, 2024 Published: January 14, 2025
Academic Editor: Hamid Yeganeh, Iran Polymer and Petrochemical Institute (IPPI), Iran
Aim: The chronicity of injuries is also a public health problem, and it is necessary to develop and apply new materials to promote more satisfactory results in the wound healing. Thus, this study aims to develop natural polymer films based on a combination of κ-carrageenan and sodium alginate, crosslinked with Zn2+, for the controlled delivery of mupirocin (MUP).
Methods: Vibrational spectroscopy (Raman and infrared spectroscopies) was used to characterize the chemical structure and crosslinking process. Micro-Raman imaging and scanning electron microscopy were employed to observe the spatial distribution of the polymers and morphology of the samples, respectively. The uniformity (in terms of mass, thickness, and MUP concentration) of the films, MUP release kinetics, and their bactericidal activity were subjected to analysis.
Results: The films exhibited good uniformity in terms of thickness, mass, and quantity of MUP. However, the percentage of antibiotics was lower than that added, indicating losses during the film production process. Swelling and release kinetic studies indicated good swelling capacity of the films and controlled drug delivery process. The antibacterial activity of the films was determined against Staphylococcus aureus, Escherichia coli, Staphylococcus epidermidis, and Pseudomonas aeruginosa using the zone of inhibition method. All films produced showed activity against the growth of these bacteria.
Conclusions: The results illustrate the potential of employing κ-carrageenan and sodium alginate in the fabrication of polymeric films for the regulated release of MUP, with the aim of developing wound dressings that can improve wound healing outcomes.
Wound healing remains a problem because wounds caused by burns, chronic diseases, trauma, and post-surgery may be unavoidable for the proliferation of resistant microorganisms [1]. Thus, skin repair is indispensable, and the faster it occurs, the shorter the exposure time of the body to a series of pathogens [2]. Chronic wounds, which do not heal easily and generate a vicious cycle of inflammation and infection, impair the functional restoration of skin tissue [3].
Studies indicate that patients with chronic wounds have an affected quality of life compared to those who are not affected because of pain, difficulty in walking, dissatisfaction, anxiety, depression, social isolation, and constantly changing body image, causing a decrease in self-esteem and functional ability, and often preventing them from carrying out their routine activities [4–6].
Successful treatment of chronic wounds involves several factors, and complications, such as preexisting diseases, comorbidities, and advanced age, can make this process difficult. One such treatment is the use of topical antibiotics [7]. Mupirocin (MUP), a class of antibiotics used to treat wounds, inhibits the synthesis of bacterial proteins by the reversible and specific binding of isoleucyl tRNA synthetase [8]. It has excellent activity against gram-positive staphylococci, but its activity against gram-negative organisms is more variable [9].
Although MUP is used to treat various bacterial skin infections, it has some limitations such as a short half-life, high protein binding, and drug resistance. Therefore, new strategies for its administration have been adopted to improve patient safety, reduce drug resistance, and expand its delivery [10].
In recent years, polymer-based films have been developed as a means of sustained or controlled drug delivery, with adhesive properties, providing the drug to a specific location on the skin in a prolonged manner, and improving therapeutic effects [11]. Among polymers, hydrogels have the advantage of maintaining the environment hydrated and ideal for treatment, in addition to having low interfacial tension, high permeability to oxygen and water, absorption of excess exudates, easy trauma, and good mechanical properties [12, 13]. Particularly, carbohydrate-based hydrogels are good candidates for the construction of delivery systems because they are nontoxic, biocompatible, and biodegradable [14].
The novelty of our study was the production of biodegradable films based on sodium alginate and κ-carrageenan, loaded with MUP, which exhibited antibacterial activities against both gram-positive and gram-negative microorganisms. Films comprising different proportions of the polysaccharides were obtained through crosslinking with the Zn2+ ion and were applied as a matrix for the controlled delivery of MUP. Zn2+ was selected as the crosslinking agent because it is an essential micronutrient for human health with significant biological relevance and abundance in the epidermis. Topical zinc sulfate has also been used to treat wounds and improve healing [15]. The obtained films were characterized by infrared spectroscopy, Raman spectroscopy, micro-Raman imaging, and scanning electron microscopy (SEM). The degree of swelling, uniformity, release, permeation kinetics, and antimicrobial effects of the films against the four bacteria were studied.
The polymer films were prepared using the solvent casting method [1, 16]. First, 20 mL of an aqueous solution containing 5% w/v of the polymers (sodium alginate/κ-carrageenan) and 0.08 g of MUP (8% in relation to the polymer mass) was prepared and stirred for 4 h. The solutions were thereafter poured into Petri dishes for solvent evaporation at room temperature (25–28°C). After drying, the obtained films were immersed in 20 mL of 1.0% w/v zinc acetate aqueous solution for 5 min to perform the crosslinking process (Figure 1). The films were washed with excess distilled water and dried at room temperature. The obtained polymeric films and their compositions are listed in Table 1 and for comparative purposes, samples without the crosslinking process were obtained.
The composition of polymer films is expressed as a percentage in relation to mass
| Films | Sodium alginate (%) | κ-carrageenan (%) | Crosslinking |
|---|---|---|---|
| F1 | 50 | 50 | Present |
| F2 | 75 | 25 | Present |
| F3 | 25 | 75 | Present |
| F4 | 50 | 50 | Absent |
| F5 | 75 | 25 | Absent |
| F6 | 25 | 75 | Absent |
The water absorption study was conducted using five circles of each film with a diameter of 6 mm, obtained using a paper punch. Initially, the mass of each dry sample was checked and thereafter left to rest in a pH 7 phosphate buffer solution with 5% methanol. At certain times, the films were removed from the solution, excess moisture was removed with a paper towel, and the mass was measured and submerged in phosphate buffer pH 7 with 5% methanol again to continue the swelling evaluation.
To perform the tests, the obtained films were perforated with the aid of a paper punch to generate circular pieces of film with a diameter of 6 mm. Thus, to achieve uniformity in thickness, the thickness of five pieces of each film was measured, with the aid of a caliper. To ensure mass uniformity, the mass of five pieces of each film was measured using an analytical balance. The MUP content test was performed by immersing five pieces of each film in 10 mL of an aqueous solution of phosphate buffer (pH 7.4) and methanol in a ratio of 3:1, respectively, for 24 h. After this period, the obtained solution was filtered, and the MUP concentration was measured at 226 nm using a PG Instruments T70 ultraviolet-visible (UV-vis) spectrophotometer [8].
In vitro MUP permeation and release studies were performed in duplicate using the Franz cell method. The formulation under study was added to the donor compartment, and over time, an aliquot was removed from the recipient compartment to quantify the MUP using UV-vis spectroscopy at a wavelength of 226 nm. As MUP transport medium, an aqueous phosphate buffer solution (pH 7.4) with 5% methanol and a polysulfone membrane were used as the interface between the donor and receptor compartments. The obtained data were adjusted to zero-order, first-order, Higuchi, Korsmeyer-Peppas, and Weibull models [17–19].
A disk diffusion sensitivity test was performed to evaluate the antimicrobial activities of the polymer films. For the positive control, 200 µg of MUP was used and the negative control was sterile distilled water. The microorganisms used in the bioassay were extracted from standard strains (American Type Collection Culture-ATCC) of gram-positive bacteria, Staphylococcus aureus (ATCC 6538) and Staphylococcus epidermidis (ATCC 0128), and gram-negative bacteria, Escherichia coli (ATCC 25922) and Pseudomonas aeruginosa (ATCC 27893), recommended for antimicrobial susceptibility testing and associated with skin wounds [20].
The ATCC strains of microorganisms were activated by seeding in 90 mm Petri dishes containing Cromoclin US Agar medium and stored in a bacteriological oven at 37°C for 24 h. After 24 h, the microorganisms on the plates were manipulated, and each inoculum was transferred to a test tube containing sterile saline solution. The turbidity obtained using this dilution was adjusted to a standard turbidity of 0.5 McFarland. Bacteria were seeded in 150 mm × 15 mm Petri dishes containing Mueller-Hilton agar. Inhibitory activity was observed when a halo or zone of inhibition formed around the antimicrobial discs, inhibiting bacterial growth, and the diameter was measured in millimeters (mm) using a ruler.
Infrared spectra were obtained for the samples using a PerkinElmer brand Fourier-transform infrared (FTIR) spectrometer (Spectrum Two model). The region of analysis was set to 4,000–400 cm–1, with a resolution of 4 cm–1, and the average number of scans was 32. Raman measurements were performed using a Brucker RFS 100 spectrometer, which was equipped with a neodymium-doped yttrium aluminium garnet (Nd+3/YAG) laser operating at a wavelength of 1,064 nm in the near-infrared range and a germanium detector that was cooled with liquid nitrogen. The instrument had a resolution of 4 cm–1, with an average of 516 accumulations.
The measurements were conducted using Brucker SENTERRA instrumentation model affixed to the microscope. The Raman image was obtained by mapping twenty points on the sample with the use of a 50× optical lens. The analysis parameters were as follows: laser excitation at 785 nm, an average of 25 co-additions, 3.0 seconds of exposure for each point, laser power of 10 mW, and a spectral resolution of 4 cm–1.
SEM images were obtained using a Hitachi Tabletop TM 3000 scanning electron microscope with magnification from 50× up to 10,000× with no sample preparation (no metallic recovery of the samples), a backscattered electron detector (BSE), and 15 keV observation condition mode.
Table 2 summarizes film uniformity data in relation to mass, thickness, and MUP concentration. It was observed that all films presented uniformity in the three parameters analyzed, presenting a low standard deviation. However, there was a difference in thickness and uniformity between the films, with F2 presenting a greater thickness and thus a greater mass. Figure 2 depicts the bar graph of the absorptive capacity and the results of the two-way ANOVA analysis. The data were evaluated for normality using the Kolmogorov-Smirnov test, and the homogeneity of variance was assessed using the Bartlett test. In all statistical tests, a significance level of p < 0.05 was employed. The statistical analyses were conducted using GraphPad Prism software, version 7.0 for Windows (GraphPad Software).
Parameters analyzed in the films
| Films | Mass uniformity (g) | Thickness (mm) | MUP concentration (%) |
|---|---|---|---|
| F1 | 0.0055 ± 0.0012 | 0.1700 ± 0.0447 | 3.403 ± 0.2489 |
| F2 | 0.0107 ± 0.0019 | 0.2800 ± 0.0758 | 3.602 ± 0.5039 |
| F3 | 0.0057 ± 0.0012 | 0.1480 ± 0.0045 | 3.825 ± 0.1536 |
MUP: mupirocin
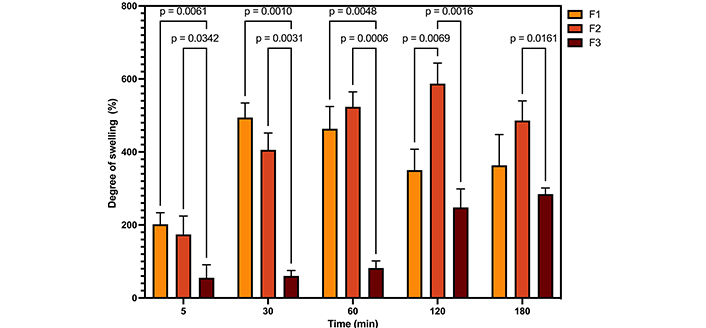
Illustrates the degree of absorption of the samples, together with the results of the two-way ANOVA analysis. F1: 50% sodium alginate and 50% κ-carrageenan, crosslinked; F2: 75% sodium alginate and 25% κ-carrageenan, crosslinked; F3: 25% sodium alginate and 75% κ-carrageenan, crosslinked
Figure 3 shows the Raman spectra of MUP and the carbohydrates used to obtain the films, and Table 3 summarizes the attempt to assign bands [21–25]. Figure 4 presents the Raman spectra of the films obtained with and without crosslinking to compare and identify the spectral changes. Thus, in the film spectra, it was possible to observe bands at 359, 893, and 1,093 cm–1 and associate them with the presence of both carbohydrates. The bands at 736 and 853 cm–1 are related to κ-carrageenan and those at 809 and 957 cm–1 are related to sodium alginate.
Tentative Raman bands assignment (cm–1)
| Sodium alginate | κ-carrageenan | Assignment |
|---|---|---|
| 1,620/1,417 | ν(COO–) | |
| 1,306/1,344 | δ(CH) | |
| 1,258 | (S=O) | |
| 1,100 | Glycoside ring respiration | |
| 959 | δ(C–C–H), δ(C–O–H) and ν(C–O–C) | |
| 810 | δ(C–O–H), ν(C–C), ν(C–O), δ(C–C–H) and δ(C–C–O) | |
| 1,090 | ν(C–O) | |
| 848 | (C–O–SO4) | |
| 430 | δ(C–C–C) and δ(C–O–C) |
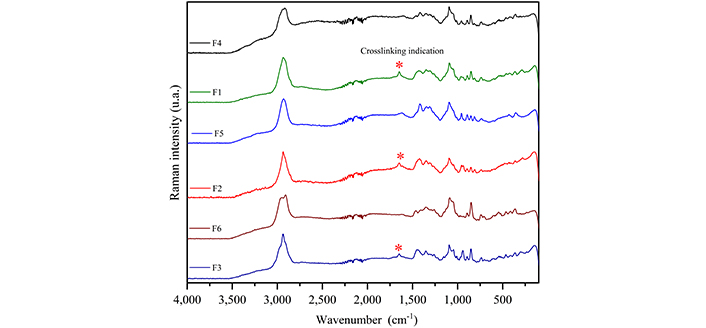
Raman spectra of the films. F1: 50% sodium alginate and 50% κ-carrageenan, crosslinked; F2: 75% sodium alginate and 25% κ-carrageenan, crosslinked; F3: 25% sodium alginate and 75% κ-carrageenan, crosslinked; F4: 50% sodium alginate and 50% κ-carrageenan, non-crosslinked; F5: 75% sodium alginate and 25% κ-carrageenan, non-crosslinked; F6: 25% sodium alginate and 75% κ-carrageenan, non-crosslinked
Figure 5 presents the infrared spectra of MUP and the carbohydrates used to obtain the films, and Table 4 summarizes the assignment of the observed bands [25–33]. Figure 6 presents the infrared spectra of the films obtained with and without crosslinking to compare and identify the spectral changes. Bands associated with both carbohydrates were observed in the spectra of all samples.
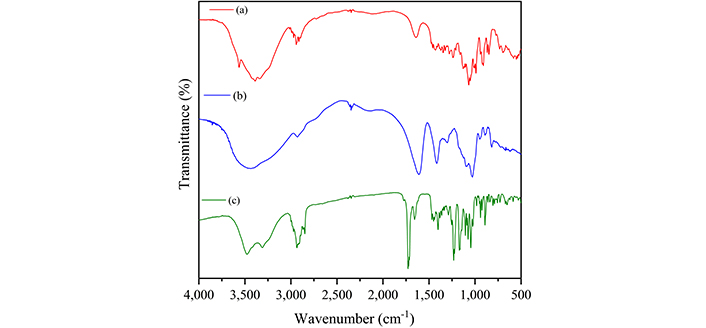
Infrared absorption spectra of κ-carrageenan (a), sodium alginate (b), and mupirocin (c)
Tentative infrared bands assignment (cm–1)
| Sodium alginate | κ-carrageenan | Assignment |
|---|---|---|
| 3,443 | 3,600–3,100 | (OH) |
| 3,100–2,800 | (CH) | |
| 2,970 | ν(OH) | |
| 1,642 | δ(OH) | |
| 1,610 | νasymmetric (COO–) | |
| 1,417 | νsymmetric (COO–) | |
| 1,238 | ν(S=O) | |
| 1,258 | ν(C–O) | |
| 1,165 | ν(C–O), ν(C–C) and δ (C–C–C) | |
| 912 | ν(C–O–C) glycosidic bond | |
| 848/704 | δ(C–O–S) |
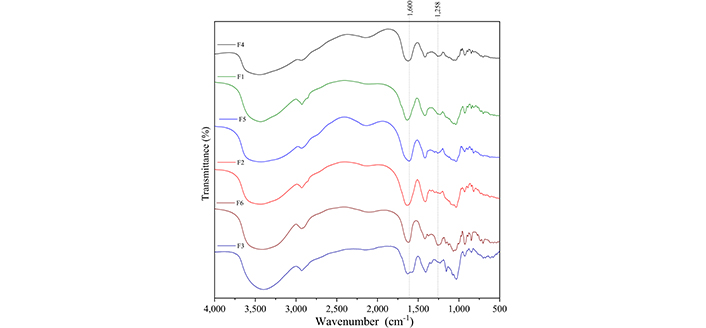
Infrared absorption spectra of the films. F1: 50% sodium alginate and 50% κ-carrageenan, crosslinked; F2: 75% sodium alginate and 25% κ-carrageenan, crosslinked; F3: 25% sodium alginate and 75% κ-carrageenan, crosslinked; F4: 50% sodium alginate and 50% κ-carrageenan, non-crosslinked; F5: 75% sodium alginate and 25% κ-carrageenan, non-crosslinked; F6: 25% sodium alginate and 75% κ-carrageenan, non-crosslinked
Figure 7 presents the permeation data using the Franz cell and the polysulfone membrane in a medium of phosphate buffer and 5% methanol. First, MUP presents a good release for all films except for F3, as it was the only film with a permeation percentage lower than 60%. This may be related to the fact that the film presented lower degrees of swelling than the other films, which would lead to lower MUP release [1]. Furthermore, a controlled release process was observed in all films, as immediate permeation was not observed; this only occurred when MUP permeation was analyzed without the presence of polymeric film. To study the permeation and release kinetics, the data were fitted to zero-order, first-order, Higuchi, Peppas-Korsmeyer, and Weibull models. The equations for each model, parameters obtained, and statistical analyses for each film are summarized in Table 5.
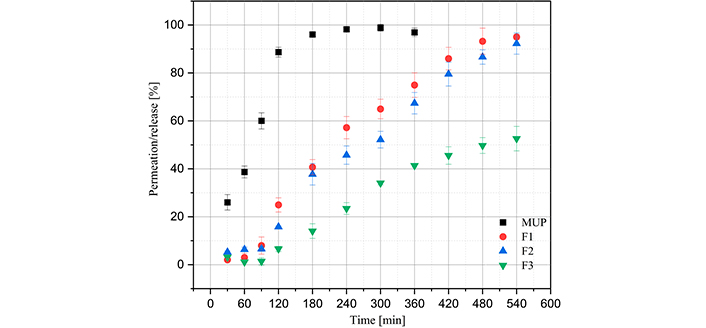
Graph of film permeation/release profiles. MUP: mupirocin; F1: 50% sodium alginate and 50% κ-carrageenan, crosslinked; F2: 75% sodium alginate and 25% κ-carrageenan, crosslinked; F3: 25% sodium alginate and 75% κ-carrageenan, crosslinked. The release of MUP was conducted until the time of 360 minutes, as it was observed that after 240 minutes there was a stabilization of concentration
Data referring to kinetic models
| Models※ | Parameters | MUP | F1 | F2 | F3 |
|---|---|---|---|---|---|
| Zero-orderQt = Q0 + k0t | k0 | 0.0026 | 0.0189 | 0.0108 | 0.0068 |
| R2 | 0.9480 | 0.9776 | 0.9626 | 0.9951 | |
| First-order | k1 | 0.0551 | 0.0024 | 0.0042 | 0.0042 |
| R2 | 0.5730 | 0.657 | 0.8805 | 0.5359 | |
| Higuchi | kH | 0.0444 | 0.0169 | 0.0143 | 0.0131 |
| R2 | 0.9315 | 0.6359 | 0.5677 | 0.8585 | |
| χ2 | 5.774 | 94.47 | 151.2 | 4,206 | |
| Peppas-Korsmeyer | k | 0.0201 | 0.001 | 4.775 × 10⁻⁴ | 7.086 × 10⁻⁵ |
| n | 0.7070 | 1.087 | 1.215 | 1.470 | |
| R2 | 0.9662 | 0.9853 | 0.9622 | 0.9826 | |
| χ2 | 2.8275 | 9.874 | 7.138 | 9.757 | |
| Weibull | To | 8.188 | 8.822 | 10.77 | 8.7978 |
| τ | 111.0 | 269.4 | 316.2 | 517.6 | |
| β | 1.006 | 1.623 | 1.665 | 1.683 | |
| R2 | 0.9776 | 0.9984 | 0.9949 | 0.9904 | |
| χ2 | 2.155 | 1.345 | 1.578 | 4.509 |
※ Zero-order: Qt represents the quantity of drug dissolved over time t, with Q0 denoting the initial amount of drug present in the solution and k0 is the zero-order release constant, expressed in units of concentration per time. First-order: Qt represents the quantity of drug dissolved over time t, with Q0 denoting the initial amount of drug present in the solution, and k1 is the first-order rate constant. Higuchi: Mt is the amount of drug released over time t, M∞ is the amount of drug released after time ∞, and kH represents the Higuchi release kinetic constant. Peppas-Korsmeyer: Mt/M∞ is the fraction of drug released at the time t, k is the release rate constant, and n is the release exponent. Weibull: Mt is the amount of drug dissolved as a function of time t, M∞ is the total amount of drug released, T0 accounts for the lag time measured due to the dissolution process, τ denotes a scale parameter describing the time dependence, and β describes the shape of the dissolution curve progression. MUP: mupirocin; F1: 50% sodium alginate and 50% κ-carrageenan, crosslinked; F2: 75% sodium alginate and 25% κ-carrageenan, crosslinked; F3: 25% sodium alginate and 75% κ-carrageenan, crosslinked
Figure 8 shows the micro-Raman images of the κ-carrageenan/alginate films obtained by integrating the band at 864 cm–1. This was chosen because it is a region where only κ-carrageenan shows a signal. In the Raman image of all the mixtures, 20 points were analyzed, and in all of them the presence of bands at 864 cm–1 was observed, with more or less intensity, represented by blue to red coloration on the contour map.
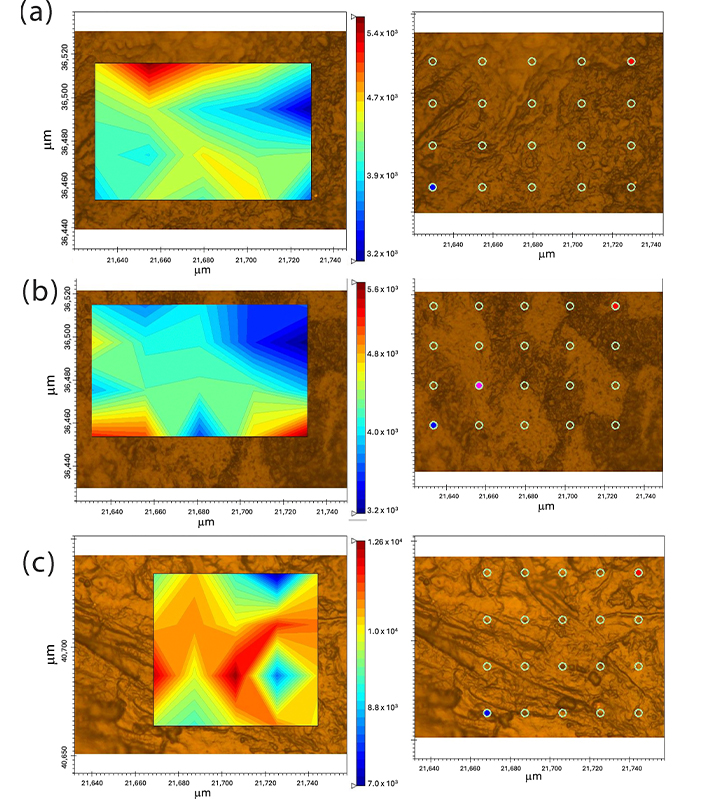
Micro-Raman image of films. F1: 50% sodium alginate and 50% κ-carrageenan, crosslinked; F2: 75% sodium alginate and 25% κ-carrageenan, crosslinked; F3: 25% sodium alginate and 75% κ-carrageenan, crosslinked
Figure 9 shows SEM images of the films. The solvent evaporation method used in this study does not normally produce interesting architectural structures, such as electrospinning or phase separation methods [1, 34]. However, analysis using SEM can provide useful information on the miscibility of the polymers that form the film. Film F2 was the only film that presented a flat surface, as opposed to films F1 and F3, which presented an agglomerated surface after evaporation of the solvent. However, for all of them, phase separation was not observed.
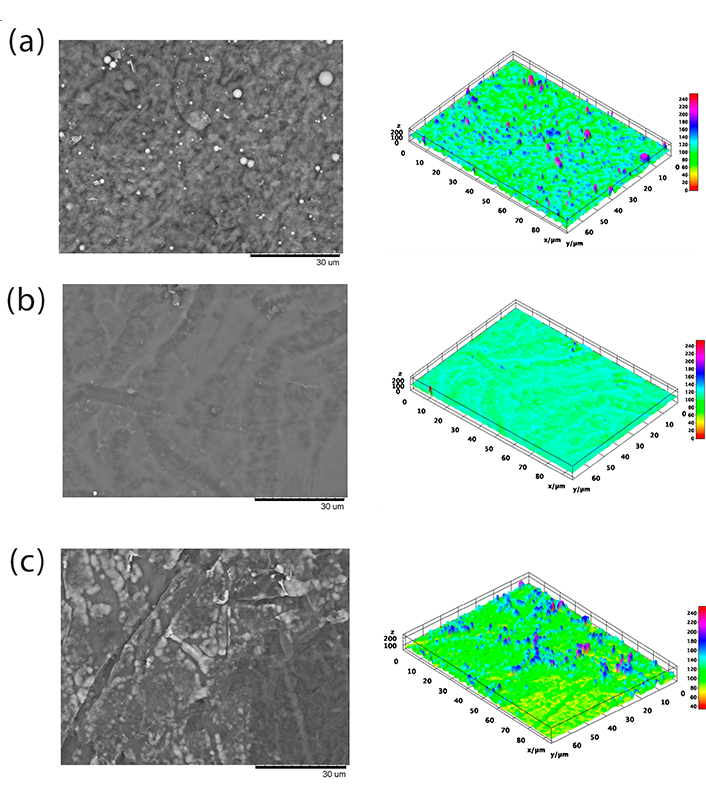
Scanning electron microscopy of films. F1: 50% sodium alginate and 50% κ-carrageenan, crosslinked; F2: 75% sodium alginate and 25% κ-carrageenan, crosslinked; F3: 25% sodium alginate and 75% κ-carrageenan, crosslinked
Figure 10 depicts the bar graph representing the diameters of inhibition and the results of the one-way analysis of variance (adjusted p-value). The data were assessed for normality using the Kolmogorov-Smirnov test, and the homogeneity of variance was evaluated through the utilization of Bartlett’s test. The impact of the samples on bacterial growth was evaluated through one-way analysis of variance (ANOVA), followed by a Tukey test. In all statistical tests, a significance level of p < 0.05 was employed. The statistical analyses were conducted using GraphPad Prism software, version 7.0 for Windows (GraphPad Software).
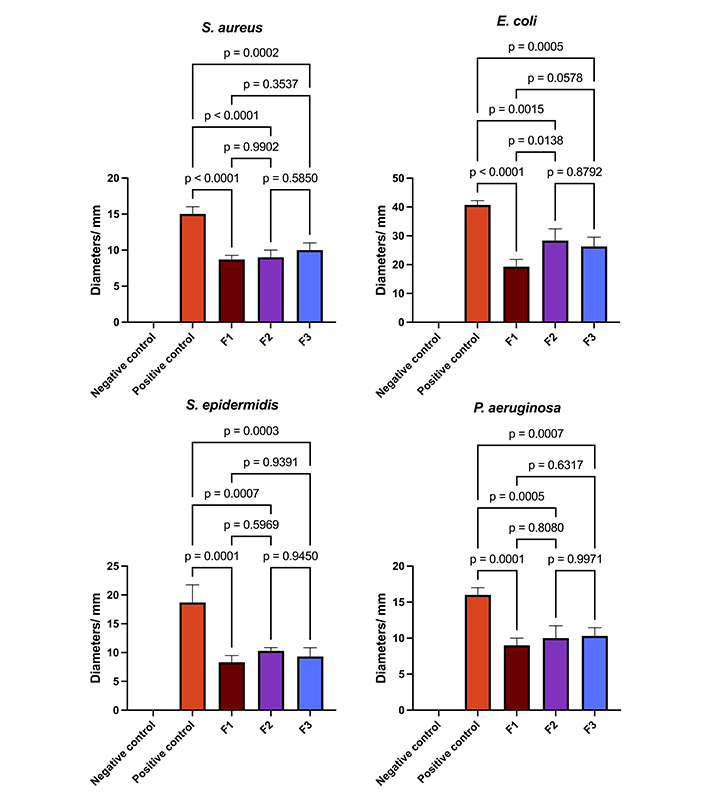
The data presented in bar graphs illustrates the diameters of inhibition, and one-way ANOVA analysis. F1: 50% sodium alginate and 50% κ-carrageenan, crosslinked; F2: 75% sodium alginate and 25% κ-carrageenan, crosslinked; F3: 25% sodium alginate and 75% κ-carrageenan, crosslinked
The mechanical properties of a polymer are significantly influenced by the crosslinking density. The modulus or rigidity of polymers with a higher crosslinking density is typically enhanced [35]. In addition, polymer blends can change the properties of the system, such as the three-dimensional organization of the chains and, consequently, the thickness of the film [36]. In this context, the observed thicknesses of the polymeric films can be attributed to the distinct proportions of carbohydrates utilized in each film and the potential for varying degrees of crosslinking, given the disparate compositions of each film. Regarding the MUP concentration, it is observed that the films present values between 3.403 and 3.825%; however, these values are lower than the 8.0% added during the preparation of the polymeric film. This may be due to the non-total solubilization of MUP and its deposition in the Petri dish and/or the crosslinking and washing process that resulted in the MUP leaching process.
The swelling capacity of polymeric films is an important parameter when applied to dressings. Carbohydrates, such as carrageenan and sodium alginate, swell in physiological fluids [37, 38]. The water absorption capacity and rate of crosslinked and water swellable polymers can be explained in terms of the diffusion of water in the polymer network and the dynamics of hydrogen bond formation. Consequently, as the crosslinking density is responsible for forming the 3D structure of the materials, it will influence the water absorption process [39]. Thus, if the degree of crosslinking is insufficient, the interactions between the polymer chains will be readily disrupted, resulting in a fragile hydrogel that is susceptible to dissolution in water. Conversely, a high degree of crosslinking will result in a reduction in the hydrogel’s swelling capacity [40]. A statistical comparison of the samples reveals that films F1 and F2 exhibit comparable absorption capacity, exceeding that of sample F3. Additionally, mass loss is discernible in samples F1 and F2 after 120 and 180 minutes, respectively, whereas this phenomenon is not observed in film F3. This may be associated with the elevated proportion of κ-carrageenan in the film F3 and a greater degree of crosslinking.
The crosslinking process can be confirmed by comparing the Raman spectra of the films with and without crosslinking; thus, the appearance of a band at 1,650 cm–1 is observed, which can be associated with the interaction of the alginate carboxylic group with Zn2+ ions. It was also observed that the band at 956 cm–1 split into two in the spectra of the crosslinked films (F1 and F2) compared to the spectrum of the non-crosslinked films; for the F3 crosslinked film, this band was not present in the spectrum of the non-crosslinked film. As this band is associated only with sodium alginate and attributed to δ(C–O–H), it can indicate the interaction process between the Zn2+ ions and the alginate hydroxyl. This result corresponds with the literature, which describes the formation of a complex between this carbohydrate and Zn2+ ions [41]. In relation to κ-carrageenan, it is not possible to indicate the crosslinking process from the Raman spectra, because it would occur owing to the interaction of the OSO3– groups with Zn2+ and the band related to (S=O) appears superimposed on sodium alginate bands. However, the literature describes the formation and interaction of the carrageenan complex with Zn2+ [42, 43].
Regarding infrared, some changes indicated crosslinking through Zn2+ ions. The carbonyl stretches of sodium alginate (approximately 1,600 cm–1) shifted to higher wavenumbers after crosslinking, which may be related to the formation of coordinated bonds between the carboxylate groups of alginate and Zn2+ ions. This is because coordination changes the length of the C=O bond, which produces a change in wavenumbers [43]. In relation to the carbonyl group of the F3 film, the band at 1,417 cm–1 shifted to lower wavenumbers, indicating the possibility of an interaction between this chemical group and Zn2+. In relation to κ-carrageenan, one of the likely interactions with Zn2+ would be with the sulfonic group, which would alter the bands at 1,258, 848, and 704 cm–1. In relation to the band at 1,258 cm–1, a decrease in its relative intensity is observed after crosslinking. For the bands at 704 and 848 cm–1, it is not possible to observe any change. However, in the literature, it is described that the interaction between ƛ-carrageenan and Zn2+ shifts the band at 1,258 cm–1 to lower wave numbers; thus, it is possible to assume that the change observed in the present study also indicates this interaction [43].
The utilization of polymeric films for the regulated release of MUP has been the subject of numerous investigations. The permeation flow of films comprising high and low molecular weight chitosan was investigated using rabbit skin, and it was demonstrated that the sustained drug release effect could be maintained for up to 24 hours [44, 45]. The same period of controlled release was achieved using rabbit skin in hydrogels composed of acrylic acid and 2-acrylamido-2-methylpropane sulfonic acid. The in vitro release study of compounds containing chitosan, sodium alginate and Carbopol® showed that MUP release was enhanced, with maximum release occurring at 12 h [46]. The release duration observed in this study was up to nine hours, a value that falls below that reported in comparable studies. However, it is important to note that the studies used rabbit skin as the membrane, which will inherently have a reduced release profile compared to a synthetic membrane [47].
In relation to the release kinetics models studied, it was observed that the Higuchi model did not fit well with the experimental data on the permeation of polymeric films, as it presented lower coefficients of determination. This can be explained by the fact that the polymeric films exhibit a high degree of swelling, which was not predicted by this model [48]. However, this model applies well to MUP permeation without polymeric films, because swelling does not occur. The polymeric and MUP films also fit the zero-order model because the coefficient of determination was close to 1.0. This indicated that the permeation and release processes were slow [49]. The Peppas-Korsmeyer model, all the samples presented a coefficient of determination close to 1.0, indicating a good fit with the experimental data. For polymeric films, all values of n were greater than 0.89, indicating that the mechanism of super-relaxation of polymeric chains is decisive for the release and permeation of MUP; however, for MUP permeation, the value of n was 0.7070, indicating non-Fickian transport [19]. The Weibull model, a good fit of the experimental data was also observed; therefore, it was possible to analyze parameter T0, which presented values close to 10 min in all experiments. This may indicate that the polymeric films have MUP on their surface, which is immediately released; this is why the T0 values of the films and isolated MUP are approximately equal [19].
Polymer blends often exhibit compositional and morphological heterogeneity that affects the overall properties of the material. Therefore, it is possible to better understand the influence of heterogeneity on material properties by obtaining a high-resolution spatial distribution of the components of a sample composed of different polymers. In this context, the spatial distribution of molecular species in polymer mixtures can be studied using micro-Raman image analysis [50]. The results demonstrate the presence of κ-carrageenan in all points of the sample, as well as homogeneity at a spatial resolution of approximately 1 µm. This may indicate the presence of similar properties in the different areas of the samples [51]. Similarly, the data obtained by SEM do not indicate the presence of phase separation in the samples.
Regarding microbiological tests, it can be observed that the positive control demonstrated a more pronounced inhibitory effect on all bacterial strains, with a statistically significant difference between the various films (p < 0.05). With respect to the polymeric films, the results for S. aureus, S. epidermidis, and P. aeruginosa were comparable, as evidenced by an adjusted p-value exceeding 0.05 in all comparisons. Regarding the inhibitory activities on E. coli, it can be observed that the F2 and F3 films show comparable inhibitory effects and more pronounced than those observed in the F1 sample. Similar findings have been previously documented in the scientific literature. Films composed of chitosan, sodium alginate, and Carbopol® loaded with MUP demonstrated antimicrobial activity against a range of bacteria, including E. coli (ATCC 8739), Enterococcus hirae (ATCC 10541), S. aureus (ATCC 6538), P. aeruginosa (ATCC 27853), Bacillus cereus (ATCC 7064), and Klebsiella pneumoniae [1].
These results demonstrate the potential of using κ-carrageenan and sodium alginate for the development of polymeric films for the controlled delivery of MUP, aimed at the production of dressings that can improve wound treatment. Vibrational spectroscopy data (infrared and Raman) indicated the presence of both carbohydrates in the polymeric films and the interactions between the Zn2+ ions and the carbohydrates, which resulted in the crosslinking process. The films exhibited good uniformity in terms of mass, thickness, and concentration of MUP; however, the percentage of antibiotics present in the films was lower than that added, indicating loss during the crosslinking and washing processes of the films. The films exhibited good swelling; however, over time, the swelling decreased, probably owing to erosion or another mechanism. In vitro antibiotic permeation/release studies demonstrated the controlled release of the drug, which was almost completely dissolved in films F1 and F2. The morphology of the films was studied using micro-Raman imaging and SEM; the first technique demonstrated a homogeneous distribution of carbohydrates in the films, without indicating the formation of phases, and the second technique also indicated the non-formation of different phases and the formation of mostly flat surfaces. The films exhibited good activity against S. aureus, E. coli, S. epidermidis, and P. aeruginosa; however, the F2 film exhibited the best formal activity. The findings suggest that the utilization of films as a matrix for the controlled release of MUP may prove beneficial for wound treatment. Formulation F2 was identified as the most suitable for film production as it has a higher percentage of MUP release and more pronounced antimicrobial activity against E. coli.
ATCC: American Type Collection Culture
F1: 50% sodium alginate and 50% κ-carrageenan, crosslinked
F2: 75% sodium alginate and 25% κ-carrageenan, crosslinked
F3: 25% sodium alginate and 75% κ-carrageenan, crosslinked
F4: 50% sodium alginate and 50% κ-carrageenan, non-crosslinked
F5: 75% sodium alginate and 25% κ-carrageenan, non-crosslinked
F6: 25% sodium alginate and 75% κ-carrageenan, non-crosslinked
MUP: mupirocin
SEM: scanning electron microscopy
UV-vis: ultraviolet-visible
All the authors thank the Brazilian National Council for Scientific and Technological Development – CNPq, the Coordination of Superior Level Staff Improvement – CAPES/ Brazil, the Foundation for Research of the State of Minas Gerais – FAPEMIG/ Brazil, the Federal University of Juiz de Fora – UFJF/ Brazil, the Spectroscopy and Molecular Structure Nucleus - NEEM/ UFJF, the Research Productivity Scholarship by the Tocantins Research Support Foundation – FAPT, and the Federal University of Tocantins – UFT/ Brazil for their long-standing support in advancing academic research. They had no role in study design, data collection and analysis, decision to publish, or preparation of the manuscript.
TRdS: Conceptualization, Investigation, Writing—original draft. SDdS: Investigation. GSC: Conceptualization, Investigation, Writing—original draft. NLGDdS: Conceptualization, Investigation, Writing—original draft, Supervision, Writing—review & editing. All authors read and approved the submitted version.
The authors declare that they have no conflicts of interest.
Not applicable.
Not applicable.
Not applicable.
The raw data supporting the conclusions of this manuscript is available upon inquiry at nelson.luis@uft.edu.br without undue reservation, by any qualified researcher.
Not applicable.
© The Author(s) 2025.
Open Exploration maintains a neutral stance on jurisdictional claims in published institutional affiliations and maps. All opinions expressed in this article are the personal views of the author(s) and do not represent the stance of the editorial team or the publisher.
Copyright: © The Author(s) 2025. This is an Open Access article licensed under a Creative Commons Attribution 4.0 International License (https://creativecommons.org/licenses/by/4.0/), which permits unrestricted use, sharing, adaptation, distribution and reproduction in any medium or format, for any purpose, even commercially, as long as you give appropriate credit to the original author(s) and the source, provide a link to the Creative Commons license, and indicate if changes were made.
