Affiliation:
1Laboratory Department, Centre for Disease Prevention and Control of Chang’an District, Shijiazhuang 050000, Hebei, China
Affiliation:
2Clinical Laboratory, Hainan Hospital of General Hospital of Chinese People’s Liberation Army, Sanya 572013, Hainan, China
Affiliation:
3Department of Nephrology, Beidaihe Rehabilitation and Recuperation Center of the Chinese People’s Liberation Army, Qinhuangdao 066100, Hebei, China
Affiliation:
4Department of Nephrology, The 981th Hospital of Joint Logistic Support Force, Chengde 067000, Hebei, China
Email: yybjzy@163.com
Explor Cardiol. 2025;3:101247 DOI: https://doi.org/10.37349/ec.2025.101247
Received: May 15, 2024 Accepted: November 06, 2024 Published: January 20, 2025
Academic Editor: Andrea Borghini, Institute of Clinical Physiology-National Research Council (IFC-CNR), Italy
Aim: This study aimed to establish a model based on gene expression in peripheral blood mononuclear cells (PBMCs) for predicting the incidence of heart failure with preserved ejection fraction (HFpEF) in patients with end-stage renal disease (ESRD).
Methods: PBMCs were isolated from patients with stage 2–3 chronic kidney disease, ESRD, ESRD with HFpEF, and ESRD with heart failure with reduced ejection fraction (HFrEF). Differences in the expression of differentially expressed genes in PBMCs among different groups were compared using microarray.
Results: In total, 43 differentially expressed genes were specifically identified in patients with ESRD with HFpEF. The expression of four genes encoding MMP7, S100A8, CXCR3, and CD163 was significantly upregulated. Hence, it played a role in the development of HFpEF. Based on these findings, a nomogram was established using data from the database including 343 patients with ESRD. The receiver operating characteristic curve, calibration curve, model consistency index, and decision curve analyses showed that the nomogram had a good predictive performance for predicting HFpEF.
Conclusions: Specific gene detections can be an important early warning indicator and guide physicians in evaluating the risk of HFpEF in ESRD.
The incidence rate of heart failure (HF) in patients with chronic kidney disease (CKD), including HF with a preserved or reduced ejection fraction (HFpEF and HFrEF, respectively), ranges from 17% to 21% [1]. Extensive clinical and basic research has shed light on HFrEF. However, data about HFpEF are limited. This is likely caused by the multifactorial characteristics of HFpEF and the lack of knowledge about its pathophysiology in the population with CKD. However, some studies have shown an association between HFpEF and CKD. Eiros et al. [2] reported that 46% of patients with HFpEF had CKD. Further, patients with CKD exhibited worse diastolic dysfunction than patients without CKD [3]. Inflammation can induce endothelial dysfunction at the early stage of HF in patients with end-stage renal disease (ESRD), consequently promoting monocytes to infiltrate heart tissues and increasing myocardial stiffness [4]. Monocyte is a type of white blood cell in the peripheral circulation, and it primarily participates in innate immunity. However, its effects on the development of HFpEF in individuals with ESRD remain unclear. Platelet factor 4 (PF4), which is stored in α-granulate, can be released into the circulation if platelets are activated during uremia. Moreover, it can drive cardiac macrophages to present the M4 phenotype. Hence, the actual role of platelet-induced monocyte activation in the development of HFpEF should be comprehensively evaluated. This study aimed to establish a model based on gene expression in peripheral blood mononuclear cells (PBMCs) for predicting the incidence of HFpEF in patients with ESRD.
This single-center, retrospective, observational study used data from a prospective database. Data on patients on hemodialysis were collected, and plasma specimens were obtained from an established cohort [5]. The ethics committee of the Health Department of the Beijing Military Region approved this study (BHD-C-20160524). In total, 343 patients were enrolled in this analysis. All patients provided written informed consent. The clinical investigation was in accordance with the principles outlined in the Declaration of Helsinki.
Incident HF was identified within 37 (32–41) months of follow-up, which was performed until December 2017. A consensus regarding a definite HF diagnosis was reached by nephrologists in accordance with the modified Framingham criteria. The Framingham criteria for HF consists of major (paroxysmal nocturnal dyspnoea, orthopnea, jugular venous distension, third heart sound, cardiothoracic ratio > 0.5 on X-ray, pulmonary oedema on X-ray, and pulmonary crackling rales) and minor [peripheral oedema, nocturnal cough, dyspnoea at exercise, hepatomegaly, pleural effusion, and tachycardia (defined as ≥ 100 bpm)] criteria. To fulfill the Framingham criteria for HF, the presence of two major or one major + two minor criteria is required. The left ventricular EF was calculated using the modified Simpson method. HFpEF and HFrEF were defined as left ventricular EF ≥ 40% and < 40%, respectively [6].
Peripheral blood (40 mL) samples were collected via venipuncture into ethylenediamine tetraacetic acid tubes and stored at 4°C overnight. PBMCs were isolated using Sep-Mate tubes and lymph prep (Stem Cell Technologies, Cambridge, MA, the USA), according to the manufacturer’s instructions. After isolation, any residual red blood cells were depleted via cell lysis, washed twice with PBS, and stored at –80°C in 90% fetal bovine serum (FBS)/10% dimethyl sulfoxide. Then, PBMCs were co-stained with antibodies against CD14 (1:100, clone: M5E2) and CD16 (1:100, clone: 3G8). Cells were incubated with antibodies for 30 min on ice in the dark. Both antibodies were purchased from BioLegend (San Diego, CA, the USA). CD14+ CD16Low and CD14+ CD16Medium-High PBMCs were collected using fluorescence activating cell sorter (FACS, Aria III cell sorter, BD Biosciences, San Jose, CA, the USA).
Total RNA was extracted and purified using the RNeasy Micro Kit (Cat. #74004, QIAGEN, GmBH, Germany). The RNA integrity number (RIN) ≥ 7 and 28S/18S ≥ 0.7 were checked to inspect RNA integration using Agilent Bioanalyzer 2100 (Agilent Technologies). Total RNA was amplified and labeled with the Low Input Quick Amp Labeling Kit, One-Color (Cat. #5190-2305, Agilent Technologies). Labeled cRNA was purified with the RNeasy Mini Kit (Cat. #74106, QIAGEN, GmBH, Germany). Each slide was hybridized with 600 ng of Cy3-labeled cRNA using the Gene Expression Hybridization Kit (Cat. #5188-5242, Agilent Technologies) in a hybridization oven at 65°C (Cat. #G2545A, Agilent Technologies). After 17 hours of hybridization, the slides were washed in staining dishes (Cat. #121, Thermo Shandon, Waltham, MA, the USA) with the Gene Expression Wash Buffer Kit (Cat. #5188-5327, Agilent Technologies). The slides were scanned using the Agilent Microarray Scanner (Cat. #G2565CA, Agilent Technologies) with default settings: dye channel: green, scan resolution = 3 μm, photomultiplier tube (PMT) 100%, and 20 bit. Data were extracted with the Feature Extraction software 10.7 (Agilent Technologies, Santa Clara, CA, the USA).
Quantitative polymerase chain reaction (Q-PCR) was performed using SYBR Green PCR Master Mix (No. QPK-201, TOYOBO CO., LTD. Life Science Department, Toyobo, Osaka, Japan) and the Rotor-Gene 3000A real-time PCR system (QIAGEN, Corbett, Sydney, Australia) according to the manufacturer’s instructions. In brief, the PCR amplification reaction mixture (20 μL) contained 2 μL cDNA, 0.4 μL sense (F) primer, 0.4 μL anti-sense (R) primer, 10 μL SYBR Green PCR Master Mix, and 7.2 μL H2O. After initial denaturation at 95℃ for 1 min, the reaction was cycled 45 times. Each cycle consisted of denaturation at 95°C for 15 s and primer annealing and extension at 60℃ for 31 s. Results were presented as the relative expression of the targeted genes normalized to the expression of glyceraldehyde-3-phosphate dehydrogenase. Real-time PCR was performed in triplicate for each experiment. Next, the average values were measured. Each experiment was repeated three times. Using the gene-specific efficiencies, the mRNA relative expression folds were calculated as a 2–ΔΔ cycle threshold. Table S1 shows the data on the primer sequences.
Dichotomous variables were presented as numbers (proportions) and continuous variables as means (± standard deviation) or medians (quartiles). The χ2 test was used to compare dichotomous variables. As appropriate, the t-test or analysis of variance was utilized to compare continuous variables. To investigate the risk factors of HFpEF in patients with ESRD, univariate and multivariate Cox regression analyses were performed to investigate the interaction of variables. Nomograms are primarily advantageous as they can estimate individualized risk based on patient and disease characteristics. Hence, a nomogram was created to determine the association between gene expressions in PBMCs (S100A8, MMP7, CXCR3, and CD163) and the incidence of HFpEF based on the multivariate analysis results. Harrell’s concordance index (C-index) was used to assess the predictive ability of the nomogram. Internal validation of the nomogram was performed using 1,000 bootstrap resamples to evaluate the difference between the actual and predicted probabilities. The prediction efficacy of the generated nomogram was assessed using the receiver operating characteristic curve. The clinical usefulness of the nomogram was assessed via decision curve analysis. Data were analyzed using the Statistical Package for the Social Sciences software (version 18.0; SPSS Inc., Chicago, IL) and R packages (http://www.r-project.org). In all analyses, P-values of ≤ 0.05 were considered statistically significant.
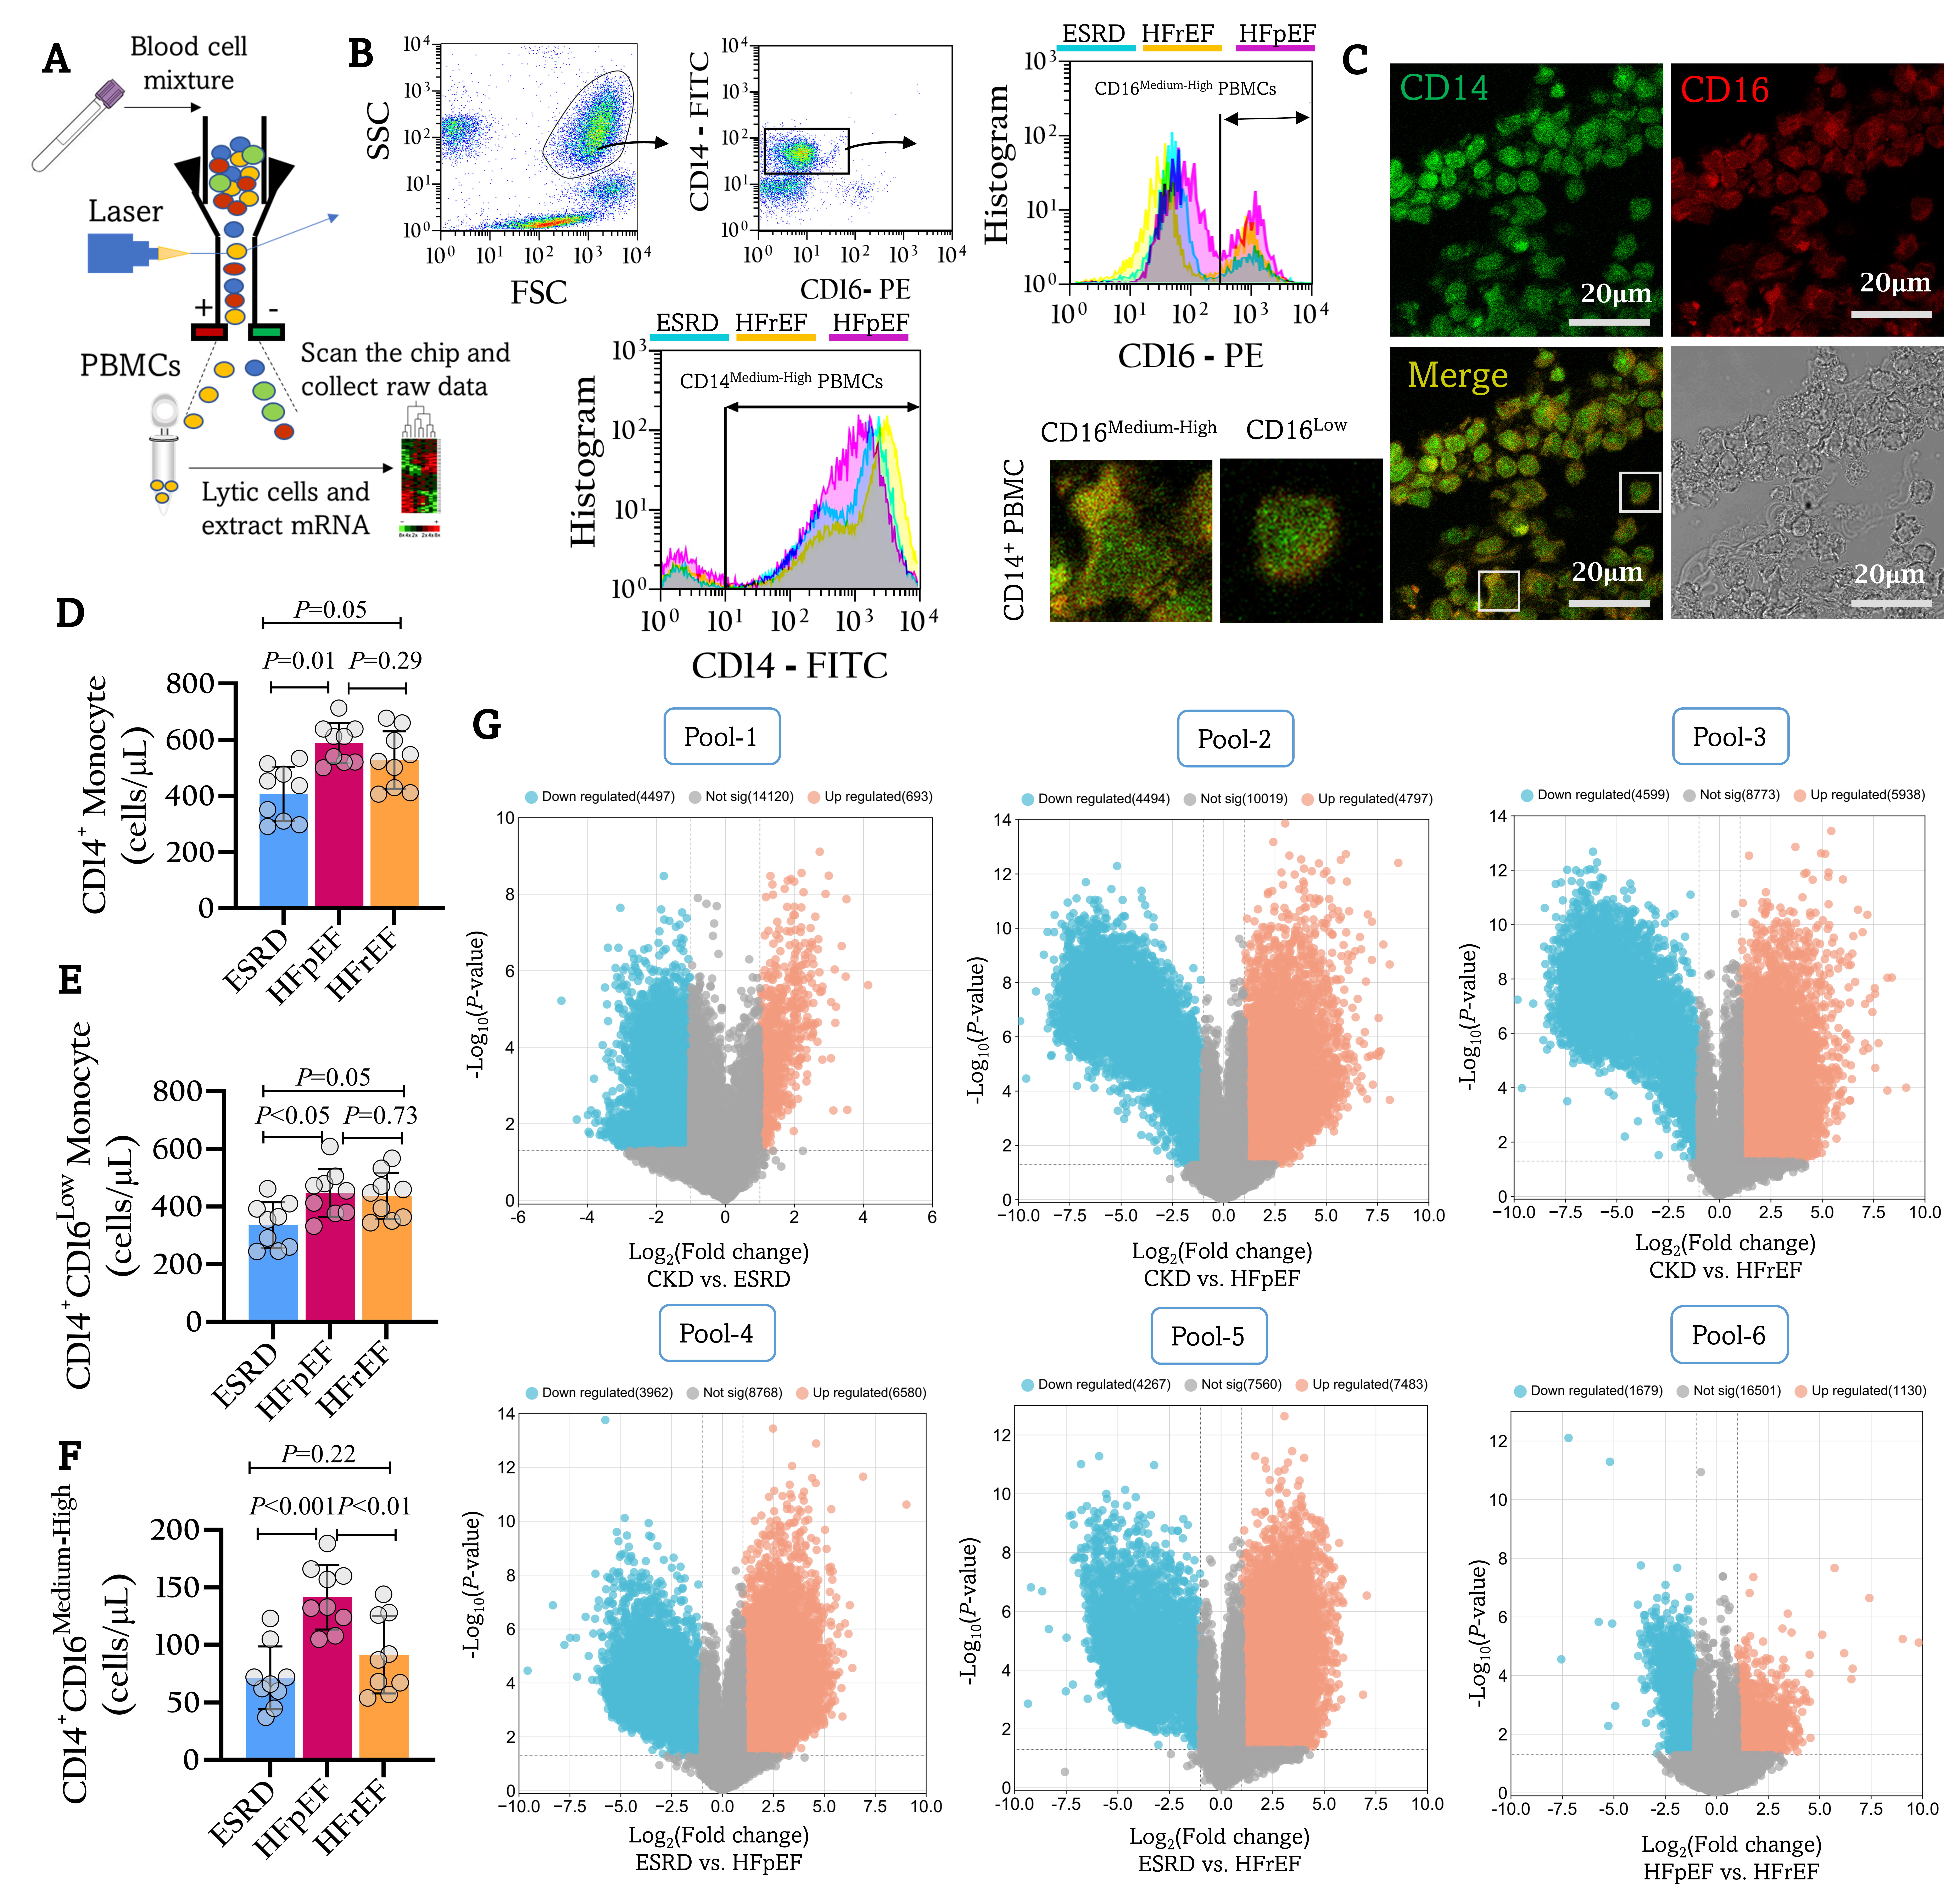
The PBMCs were isolated from patients with CKD/ESRD in our cohort using FACS (Figure 1A and B). As shown in Figure 1C, only a small part of CD14+ PBMCs highly expressed CD16 markers in patients with ESRD. The populations of CD14+ and CD14+ CD16Low PBMCs in patients with HFpEF and HFrEF were both significantly higher than those in patients with ERSR. Meanwhile, the population of CD14+ CD16Medium-High PBMCs, HFpEF patients > HFrEF and ESRD patients, P both < 0.05 (Figure 1D–F). The gene expression profiles were compared among PBMCs drawn from patients with stage 2–3 CKD, those with ESRD without HF (ESRD), and those with ESRD with HFpEF (HFpEF) or HFrEF (HFrEF) to identify the elements contributing to the incidence of HFpEF in patients with ESRD. Microarray data have been deposited in the ArrayExpress database at EMBL-EBI (www.ebi.ac.uk/arrayexpress) under accession number E-MTAB-13612. As shown in Figure 1G, differentially expressed genes (DEGs) were compared between CKD and ESRD (Pool-1), CKD and HFpEF (Pool-2), CKD and HFrEF (Pool-3), ESRD and HFpEF (Pool-4), ESRD and HFrEF (Pool-5), and HFpEF and HFrEF (Pool-6). Table S2 shows the 73 genes encoding highly expressed surface markers on monocytes and high levels of monocyte-derived cytokines (Pool-7).

The PBMC isolation and microarray analysis. (A) Human PBMCs were isolated using a fluorescence activating cell sorter (FACS). (B) PBMCs were isolated using FACS. Step 1: side scatter (FSC: x-axis) versus forward scatter (SSC: y-axis) plot showing single cells. Step 2: side scatter (CD16: x-axis) versus forward scatter (CD14: y-axis) plot showing leukocytes in the PE-negative/FITC-positive fraction. (C) Identification of the sorted PBMCs via immunofluorescent staining. Green: CD14; Red: CD16. (D–F) The number of CD14+ PMBCs, CD14+ CD16Low PMBCs, and CD14+ CD16Medium-High PMBCs. (G) The gene expressions in PBMCs were compared between groups. Differentially expressed genes (DEGs) were compared between CKD and ESRD (Pool-1), CKD and HFpEF (Pool-2), CKD and HFrEF (Pool-3), ESRD and HFpEF (Pool-4), ESRD and HFrEF (Pool-5), and HFpEF and HFrEF (Pool-6). CKD: chronic kidney disease; ESRD: end-stage renal disease; FITC: fluorescein isothiocyanate; FSC: forward scatter; HFpEF: heart failure with preserved ejection fraction; HFrEF: heart failure with reduced ejection fraction; PBMCs: peripheral blood mononuclear cells; PF: phycoerythrin; SSC: side scatter
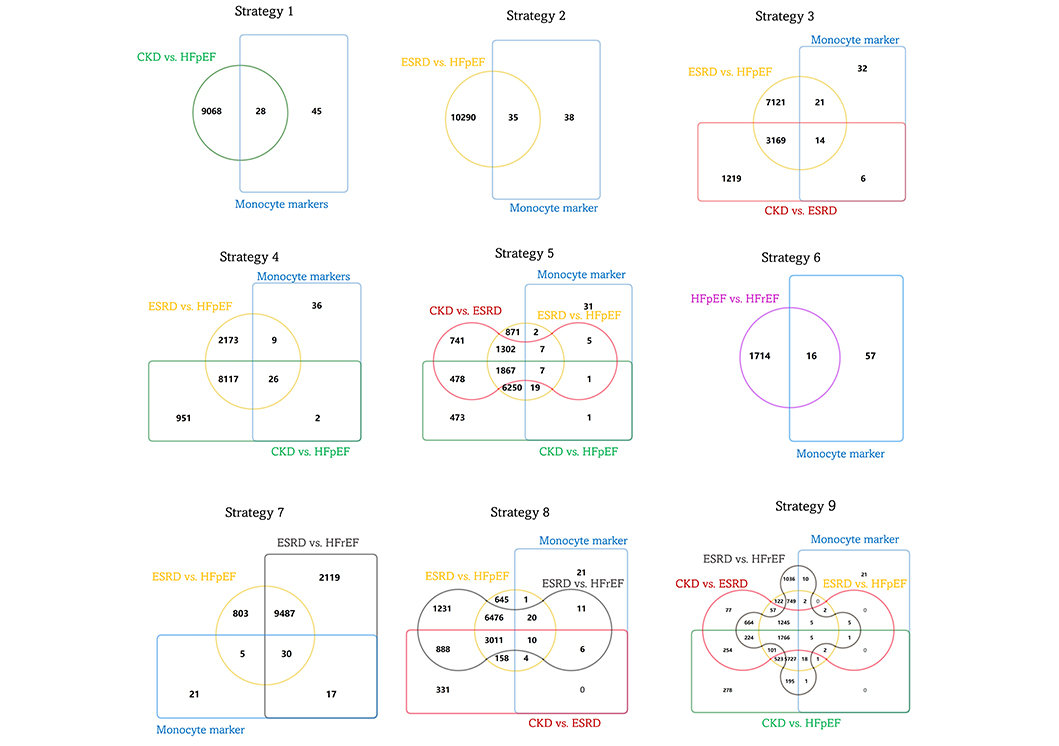
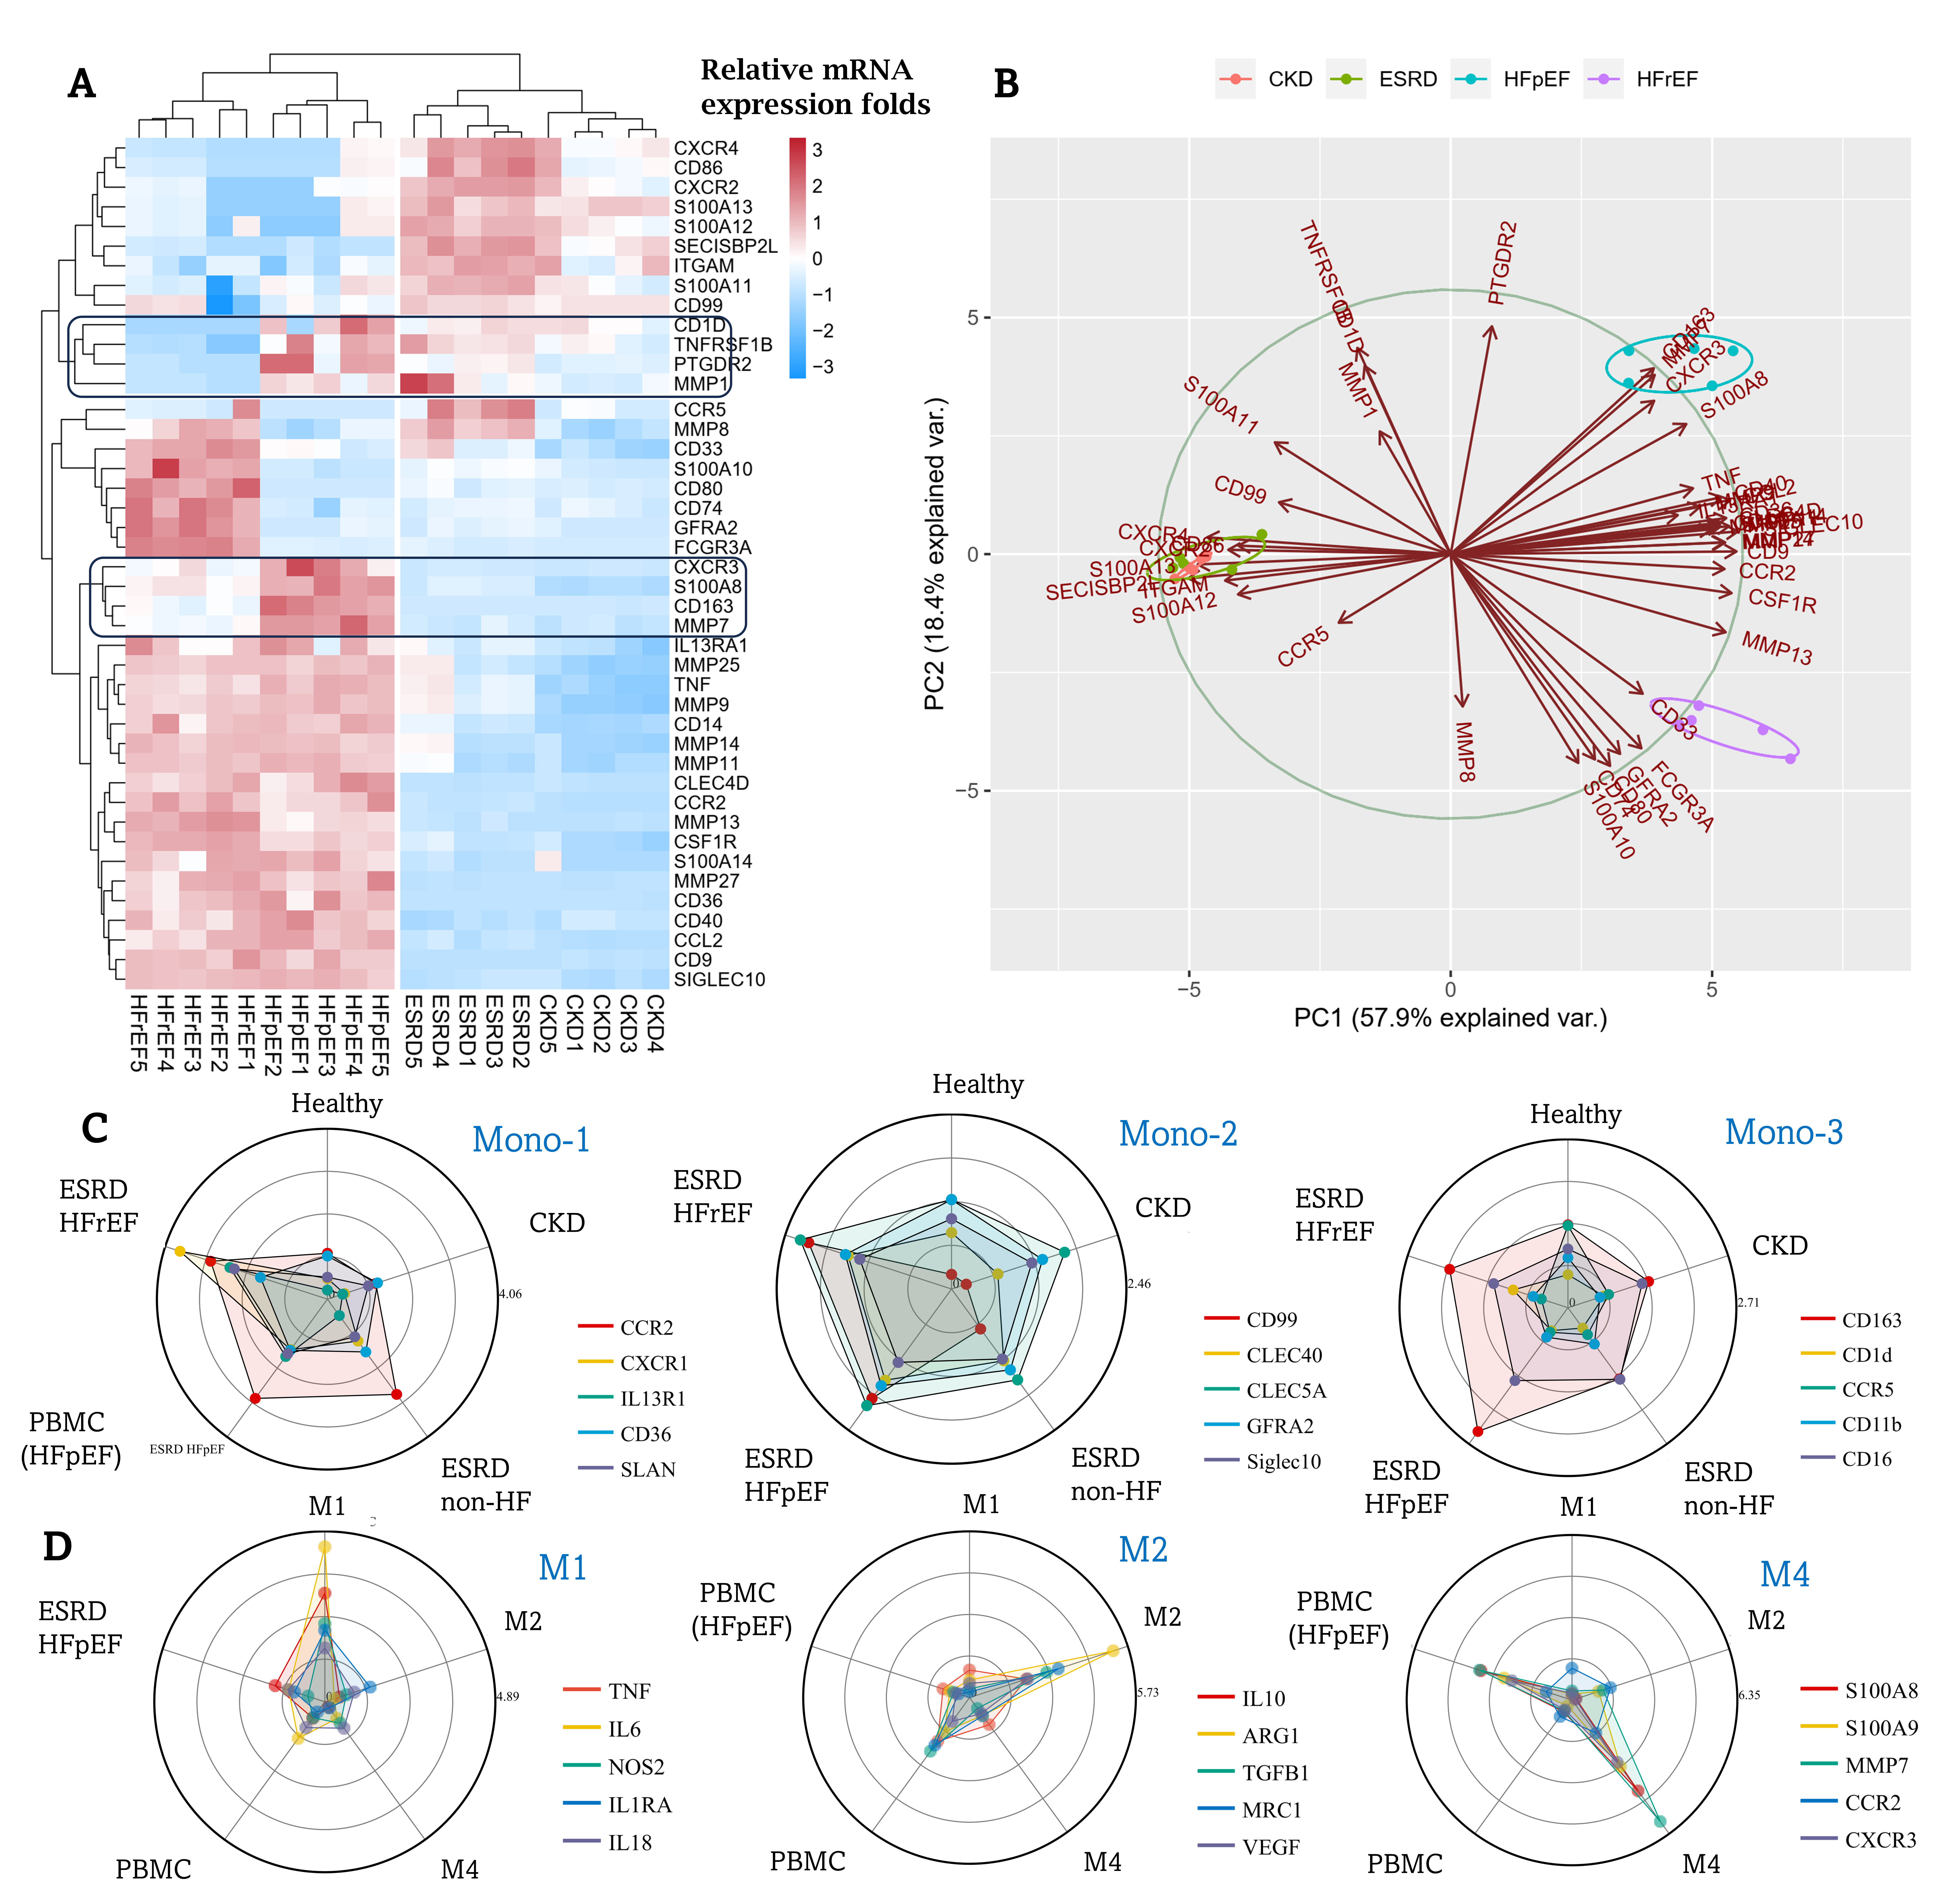
Nine inter-pool comparison strategies were designed to screen out DEGs specifically contributing to the incidence of HFpEF in ESRD (Table S3 and Figure 2). However, 43 genes were identified from the candidate DEG pool (Figure 3A). Via a principal component analysis (PCA) in Figure 3B, four genes encoding S100A8, MMP7, CXCR3, and CD163 might play an important role in HFpEF. Fifteen gene expressions of surface markers representing different monocyte subsets were detected in PBMCs from health controls and patients with CKD, ESRD, HFpEF, and HFrEF. The expressions of monocyte-1 (Mon-1), Mon-2, and Mon-3 subset surface markers in patients with HFpEF were not significantly upregulated unlike those in patients with ESRD (Figure 3C). Compared with inactivated PBMCs, the PBMCs from patients with HFpEF presented with M4-like macrophages (M4), but not either M1- or M2-like phenotypes (Figure 3D).

Inter-pool comparison strategies to screen out DEGs associated with HFpEF. CKD: chronic kidney disease; DEGs: differentially expressed genes; ESRD: end-stage renal disease; HFpEF: heart failure with preserved ejection fraction; HFrEF: heart failure with reduced ejection fraction

DEGs could contribute to the development of HFpEF in ESRD. (A) There were 43 overlapping DEGs. The expression of eight DEGs in the HFpEF group was significantly upregulated compared with that in the CKD, ESRD, and HFrEF groups. The relative mRNA levels were shown by the color keys. (B) Principal component analysis (PCA) shows that the expressions of MMP7, S100A8, CXCR3, and CD163 were directed to HFpEF. (C) The gene expressions of Mon-1 (monocyte-1), Mon-2, and Mon-3 subset surface markers were compared among healthy people and patients with CKD, ESRD, HFpEF, and HFrEF. (D) PBMCs from healthy people were used as control. To control the direction of polarization, PBMCs were treated toward the M1 (M1-like macrophages), M2, and M4 phenotypes. The specificity of classical phenotype markers in M1 (TNF, IL6, Il1R1, NOS2, and IL18), M2 (ARG1, IL10, TGFB1, VEGF, and MRC1), and M4 (S100A8/9, MMP7, CCR2, and CXCR3) was evaluated using radar charts showing the gene expression levels as determined via Q-PCR. The polar direction of PBMCs isolated from patients with HFpEF is toward the M4 phenotype. CKD: chronic kidney disease; DEGs: differentially expressed genes; ESRD: end-stage renal disease; HFpEF: heart failure with preserved ejection fraction; HFrEF: heart failure with reduced ejection fraction; PBMCs: peripheral blood mononuclear cells; Q-PCR: quantitative polymerase chain reaction
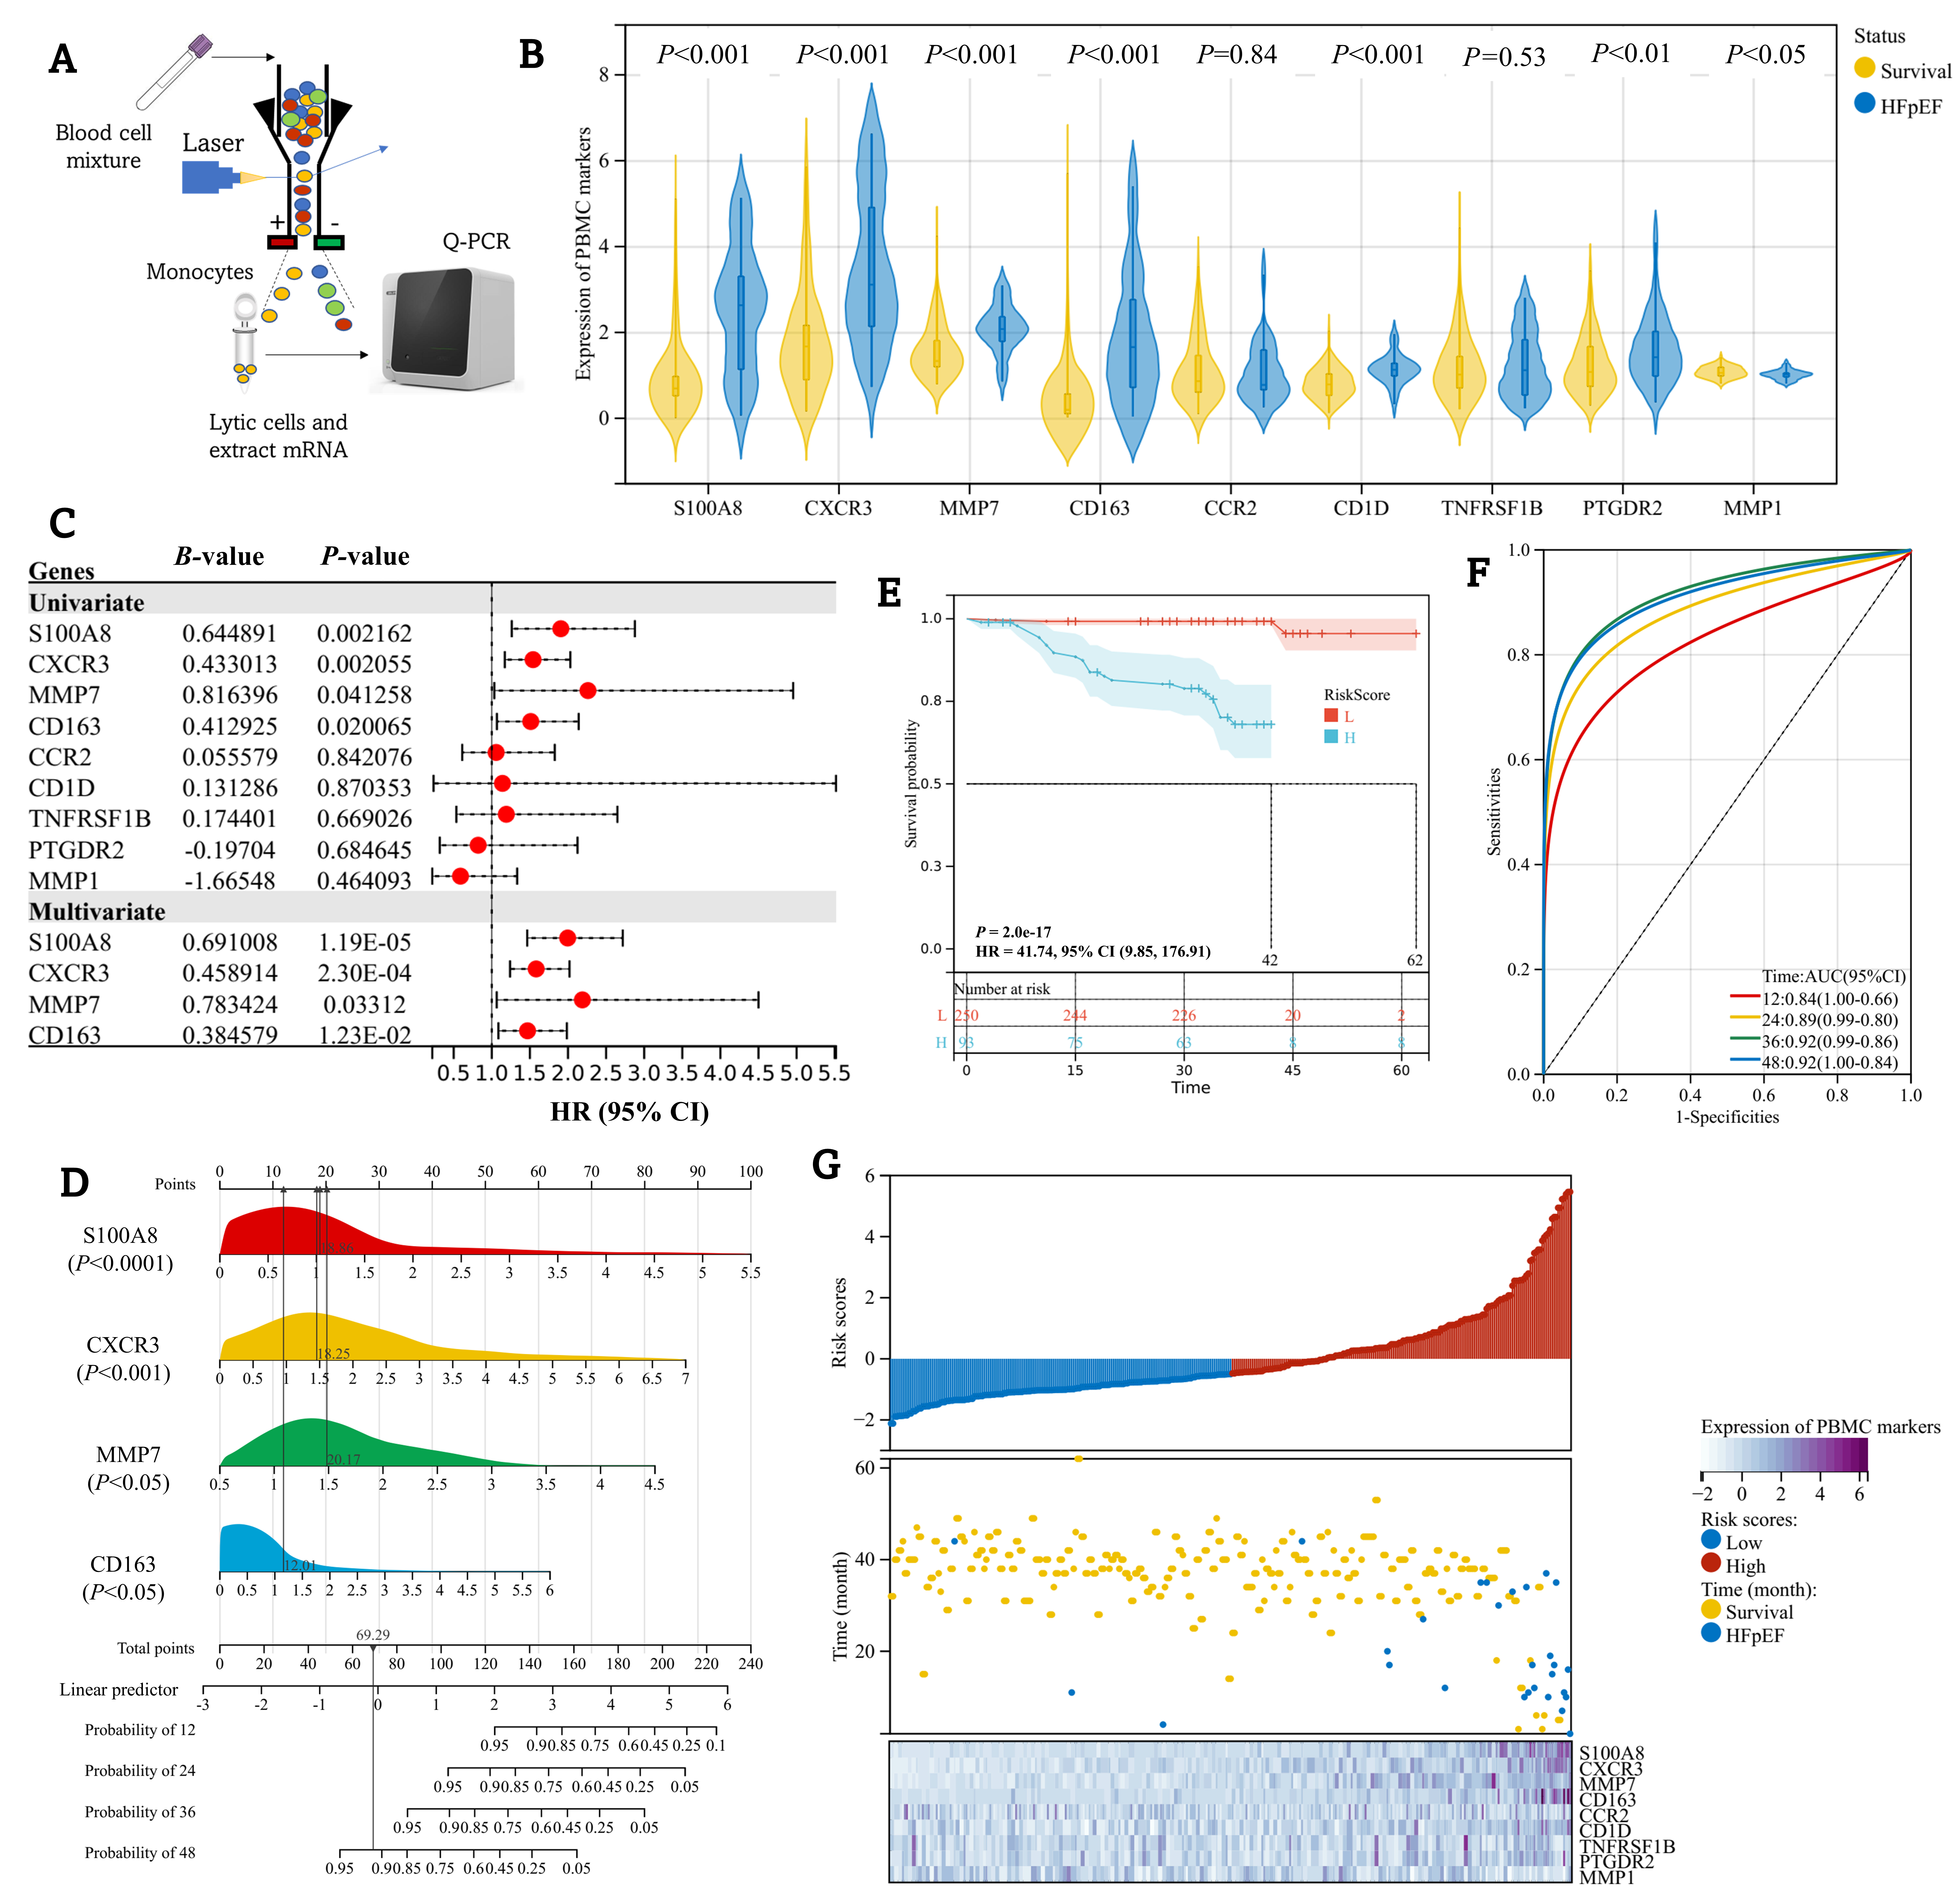
As presented in Figure 4A, there were nine DEGs that might contribute to the incidence of HFpEF in ESRD. Then, the mRNA expressions of S100A8, CXCR3, MMP7, CD163, CD1D, TNFRSF1B, PTGDR2, and MMP1 in PBMCs from 343 patients were identified. Then, they were followed up at a median of 37 (32–41) months. During the follow-up period, 28 HFpEF events were recorded. Based on the univariate analysis, the expression of S100A8, CXCR3, MMP7, CD163, CD1D, PTGDR2, and MMP1 in the PBMCs of patients with HFpEF was significantly upregulated compared with that of survivors (Figure 4B). The genes with significant differences in the univariate analysis were used in the multivariate analysis. Multivariate Cox regression analysis revealed the association between the genes encoding monocyte surfaced markers, including S100A8, CXCR3, MMP7, and CD163, and the incidence of HFpEF. Results showed that S100A8 [hazard ratio (HR) = 1.996, 95% confidence interval (CI): 1.465–2.719], CXCR3 (HR = 1.583, 95% CI: 1.240–2.021), CD163 (HR = 1.469, 95% CI: 1.087–1.985), and MMP7 (HR = 2.189, 95% CI: 1.006–4.500) were independent risk factors of HFpEF (Figure 4C).

The expression of DEGs in PBMCs can be effective in predicting HFpEF in the ESRD cohort. (A) The protocol of PBMC isolation and the following Q-PCR analysis for a panel of candidate DEGs contributing to HFpEF. (B) The mRNA expressions of nine monocyte markers, including CCR2, CD1D, CD163, MMP1, TNFRSF1B, PTGDR2, S100A8, MMP7, and CXCR3, were included. (C) The univariate and multivariate Cox regression analysis of the mRNA expressions of candidate DEGs in PBMCs to the incidence of HFpEF in the ESRD cohort. (D) The visualization image represents the Cox hazard regression of mRNA expressions in PBMCs to the incidence of HFpEF. The RSs of nine gene expressions in PBMCs to HFpEF. The cutoff of aggregate RS was 69.3, and the calculated RS above the cutoff was considered as an individual under high-risk HFpEF. (E) HR and 95% CI for predicting HFpEF. Red line: low risk (L). Blue line: high risk (H). (F) The area under the ROC curve for evaluating the performances of the model in predicting the 1-, 2-, 3-, and 4-year possibility of undergoing HFpEF. (G) A composite graph was used to describe the prediction of mRNA expressions in PBMCs (heatmap) to the risks of HFpEF with consideration of aggregate RSs. DEGs: differentially expressed genes; ESRD: end-stage renal disease; HFpEF: heart failure with preserved ejection fraction; HR: hazard ratio; PBMCs: peripheral blood mononuclear cells; Q-PCR: quantitative polymerase chain reaction; ROC: receiver operating characteristic; RSs: aggregate risk scores
The multivariate Cox regression analysis results were used to generate a nomogram for predicting HFpEF in ESRD. The nomogram was used to assign scores to four genes (S100A8, CXCR3, CD163, and MMP7) in patients with HFpEF. These scores were added to obtain the total score, which corresponds to the different prediction probabilities of HFpEF (Figure 4D). The performance of the generated nomogram was assessed using various evaluation metrics. The model C-index was 0.879 (95% CI: 0.786–0.972), indicating that the nomogram had good accuracy in estimating the risk of HFpEF. The R package was used to calculate the optimal truncation value of the score and set the minimum sample size at > 25% and the maximum sample at < 75%. All patients were classified into the high- and low-risk HFpEF groups. Further, a significant prognostic difference was observed between the two groups (P < 0.001, Figure 4E). The performance of this nomogram was examined via a receiver operating characteristic curve analysis. The area under the receiver operating characteristic curve for the 1-, 2-, 3-, and 4-year HFpEF were 0.84 (0.66–1.00), 0.89 (0.80–0.99), 0.92 (0.86–0.99), and 0.92 (0.84–1.00), respectively. These values indicated a good diagnostic performance for predicting HFpEF in patients with ESRD (Figure 4F). Patients in the high-risk group had a significantly higher incidence of HFpEF than patients in the low-risk group. Collectively, our results revealed that the gene signature, including S100A8, CXCR3, MMP7, and CD163 in PBMCs, had a good performance for predicting the risk of HFpEF (Figure 4G).
The functional diversity of monocytes and macrophages and their ability to contribute to different cardiac processes are dependent on phenotypic plasticity. However, how the balance of monocyte subsets in HFpEF is achieved remains an open question. The current study found that the gene expressions of MMP7, S100A8, CXCR3, and CD163 in PBMCs were strongly associated with the incidence of HFpEF in ESRD. MMP7, S100A8, and CXCR3 are the classical markers for labeling “M4-like” macrophages. Thus, the finding strongly indicated that the specific subset of monocytes can probably contribute to the development of HFpEF.
Monocytes are grouped according to the relative expression levels of CD14 and CD16 and chemokine receptors, and their phagocytic activity. According to the allotment renewed in 2017 by the Nomenclature Committee of the International Union of Immunologic Societies, three distinct monocyte subsets were defined as follows: classical (CD14++/CD16−, or Mon-1), intermediate (CD14++/CD16+, or Mon-2), and non-classical (CD14+/CD16++, or Mon-3). The origin of various monocyte subsets differ, and certain cytokines determine the direction of the subset. Mon-1 is the predominant subset of HF in the general population (80.1%–87%), followed by Mon-2 (3.3%–3.7%) and Mon-3 (5.8%–6.2%) [7, 8]. In our ESRD cohort, patients with HFpEF had significantly higher populations of CD14+ CD16Medium-High PBMCs (24.5% ± 0.61%) than those with HFrEF and HF survivors (17.4% ± 0.43% and 16.9% ± 0.51%). Therefore, a part of classical PBMCs convert into a new subset and contribute to HFpEF.
The current study primarily aimed to identify the possible novel monocyte subset that strongly promoted the development of HFpEF in ESRD. Mon-1 originates from precursors in the bone marrow. However, the origins of other monocyte subsets and regulatory mechanisms to form a particular subset are based on the cellular environment. However, this notion should be validated. Some studies have revealed that Mon-1 may differentiate into both Mon-2 and Mon-3 [9]. Interestingly, the current study found that a part of PBMCs highly expressed genes encoding M4-like markers including MMP7, S100A8, and CXCR3, thereby suggesting the possible origin of M4-like macrophages inflating heart tissues in ESRD. M4-like macrophage polarization is strongly associated with platelet activation and PF4 release. During uremia, platelets are intensely activated. The recruitment, migration, and activation of monocytes are facilitated by the secretion of platelets, such as PF4. Moreover, they described the phenotype of macrophages as “M4 type”. M4 macrophages lack the hemoglobin receptor CD163. However, they upregulate the expression of S100A8 and MMP7. In contrast, this study identified the monocytes that highly expressed not only MMP7 and S100A8 but also CD163, considered as M2-like marker, and that were strongly associated with HFpEF in ESRD. In addition, a recent study reported that the incubation of serum collected from patients with HFpEF could stimulate monocytes toward M2-like differentiation [10]. It reflected the differences between “M4-like macrophages” and “M4-like monocytes”. Therefore, the specific subset can probably promote multi-directional differentiation toward cardiac macrophages with different phenotypes and identify the outcomes of uremic-induced heart injury in humans.
Emerging studies have shown that adverse cardiac remodeling (CR) is associated with high morbidity and mortality in HF [11]. Further, matrix metalloproteinases (MMPs) play an important role in the process because of their ability to degrade collagen components [12]. We recently reported that PF4 and other platelet-derived particles significantly upregulate MMP7 expression by cardiac macrophages in uremic mice. Further, the development of HFpEF is significantly dependent on changes in collagen homeostasis [13]. Circulating monocytes presented with M4-like functions in patients with HFpEF patients, which can indicate the possible origin of cardiac macrophages in uremia and explain the signs of diastolic dysfunction despite a pEF in uremic mice [14].
The current study had several limitations. Firstly, since monocytes are the precursor of macrophages, the cell polarization and activation status of monocytes could not be simply investigated via cytokine activation. That is, monocytes could not be activated toward M4-like phenotype with PF4 in vitro because the stimulation will directly drive monocytes toward M4-like macrophages rather than M4-like monocytes. Therefore, the features of specific monocytes contributing to HFpEF can only be achieved via in vivo experiments. Second, it remains unclear which subset of monocytes highly express MMP7 and S100A8. They were probably grouped into the Mon-2 subset or a novel subset that originated from the Mon-1 subset. In conclusion, the definite subtype of monocytes that contributed to the development of HFpEF in patients with ESRD is still unclear. Thus, further research should be performed. For all, gene detections for M4-like phenotype in monocytes can be an important early warning indicator and guide physicians for evaluating the risk of HFpEF in ESRD.
CI: confidence interval
CKD: chronic kidney disease
DEGs: differentially expressed genes
ESRD: end-stage renal disease
FACS: fluorescence activating cell sorter
HF: heart failure
HFpEF: heart failure with preserved ejection fraction
HFrEF: heart failure with reduced ejection fraction
HR: hazard ratio
M4: macrophage-4
Mon-1: monocyte-1
PBMCs: peripheral blood mononuclear cells
PF4: platelet factor 4
Q-PCR: quantitative polymerase chain reaction
The supplementary tables for this article are available at: https://www.explorationpub.com/uploads/Article/file/101247_sup_1.pdf.
XW: Investigation, Writing—original draft. MS: Validation, Writing—review & editing, Supervision. LM: Conceptualization, Investigation, Writing—original draft, Writing—review & editing. YY: Conceptualization, Investigation, Writing—original draft, Writing—review & editing, Funding acquisition. All authors read and approved the submitted version.
The authors declare that they have no conflicts of interest.
The ethics committee of the Health Department of the Beijing Military Region approved this study (BHD-C-20160524).
All patients provided written informed consent.
Not applicable.
Microarray data have been deposited in the ArrayExpress database at EMBL-EBI (www.ebi.ac.uk/arrayexpress) under accession number E-MTAB-13612. Requests for accessing the datasets should be directed to Yang Y, e-mail: yybjzy@163.com.
The present work was supported by the 13th Five-Year Key Plan for the Military Medical Scientific Research Project to Yang Yang (CBJ14L016). The funder had no role in study design, data collection and analysis, decision to publish, or preparation of the manuscript.
© The Author(s) 2025.
Open Exploration maintains a neutral stance on jurisdictional claims in published institutional affiliations and maps. All opinions expressed in this article are the personal views of the author(s) and do not represent the stance of the editorial team or the publisher.
Copyright: © The Author(s) 2025. This is an Open Access article licensed under a Creative Commons Attribution 4.0 International License (https://creativecommons.org/licenses/by/4.0/), which permits unrestricted use, sharing, adaptation, distribution and reproduction in any medium or format, for any purpose, even commercially, as long as you give appropriate credit to the original author(s) and the source, provide a link to the Creative Commons license, and indicate if changes were made.
View: 2305
Download: 287
Times Cited: 0
