Original Article

Affiliation:
Mahmood Clinical Pharmacology Consultancy, LLC, Rockville, MD 20850, USA
Email: Iftekharmahmood@aol.com
Explor Drug Sci. 2025;3:100894 DOI: https://doi.org/10.37349/eds.2025.100894
Received: November 29, 2024 Accepted: January 28, 2025 Published: February 27, 2025
Academic Editor: Marcello Iriti, Milan State University, Italy
Aim: The objective of this study was to develop a minimal physiologically based pharmacokinetic (mPBPK) model to predict area under the curve (AUC) and maximum plasma concentration (Cmax) of drugs in subjects with varying degrees of hepatic impairment and compare this mPBPK model with the whole body PBPK model.
Methods: Hepatic impairment classification system, which is based on Child-Pugh score was used. In this mPBPK model, 4 physiological parameters [portal and renal blood flow, glomerular filtration rate (GFR), and liver size] and 2 biochemical parameters (albumin and bilirubin) were used. Total number of drugs analyzed in this study was 52, and the predicted Cmax and AUC values were compared with dedicated clinical trials. Out of 52 drugs, the predictive performance of mPBPK was compared with the whole body PBPK model for 27 drugs, and the remaining 25 drugs were used to further test the robustness of the mPBPK model.
Results: The results of the study indicated that the predictive performance of the mPBPK model was comparable with the whole body PBPK model, both in terms of Cmax and AUC. For 52 drugs, there were 120 data points for AUC (37, 47, and 36 for mild, moderate, and severe hepatic impairment, respectively), and from mPBPK model, 92%, 94%, and 89% data points were within 0.5–2-fold prediction error, respectively.
Conclusions: Overall, the results of the study indicated that the proposed mPBPK model, in its predictive performance, is as robust and accurate as whole body PBPK model.
The liver is the main site of metabolism for many drugs, leading to the clearance (CL) of these drugs through a variety of oxidative and conjugative metabolic pathways (phase I and II reactions) [1]. Hepatic impairment may lead to changes in the pharmacokinetic (PK) of drugs due to the reduced capacity of the liver to metabolize drugs. As a result, drugs or active metabolites can be accumulated in the body and may reach to toxic levels. Furthermore, pro-drugs needed to be converted to active metabolite(s) for therapeutic benefits, but hepatic impairment may lead to the reduced formation of active metabolite(s), resulting in the reduced efficacy of such products [1].
There can be many liver diseases, such as alcoholic liver disease and chronic infections with hepatitis viruses B and C, acute hepatitis D or E, primary biliary cirrhosis, and primary sclerosing cholangitis [1]. In hepatic disease, there are changes in the activity of metabolizing enzymes and hepatic transporters [2]. Besides liver, reduced duodenal cytochrome P450 3A (CYP3A) activity has also been noted in the hepatic disease [3]. Hepatic disease may also alter kidney function, resulting in the accumulation of a drug and its active or inactive metabolite(s) even though a drug is not primarily metabolized in the liver [1].
The Food and Drug Administration of the United States of America (US FDA) suggests a Child-Pugh score system for the assessment of liver function [1]. The Child-Pugh score system measures several clinical tests such as encephalopathy grade, ascites, serum bilirubin, serum albumin, and prothrombin time. Based on these tests, the FDA has suggested 3 categories of hepatic impairment. Based on Child-Pugh score, these three categories are: category A or mild liver impairment (score 5–6), category B or moderate liver impairment (score 7–9), and category C or severe liver impairment (score 10–15).
Modeling and simulation can be helpful in predicting PK of a drug in subjects with hepatic impairment and finding a suitable dose for the initiation of a dedicated clinical trial [1]. In order to predict PK of drugs in hepatic impairment, whole body physiologically based PK (PBPK) models have been suggested [4–6]. However, there are examples in the literature that suggest that the whole body PBPK model can be simplified (generally known as reduced or lumped PBPK) to predict PK parameters or dose of a drug [7–17].
The objective of this study is to propose a minimal PBPK (mPBPK) model to predict PK parameters such as maximum plasma concentration (Cmax) and area under the curve (AUC) in subjects with different degrees of hepatic impairment and compare the predictive performance of the proposed mPBPK model with the predictive performance of the whole body PBPK model as well as with dedicated clinical trials.
Fifty two drugs were used in this study to predict PK parameters such as Cmax and AUC in subjects with hepatic impairment by a mPBPK model. The predicted Cmax and AUC values from mPBPK model were then compared with the observed Cmax and AUC values from dedicated hepatic impairment clinical trials. Out of 52 drugs, 27 drugs were used to compare the predicted Cmax and AUC from mPBPK model with the whole body PBPK model. The remaining 25 drugs were used to further strengthen the accuracy of the predictive performance of the proposed mPBPK model.
It should be noted that in this study, the whole body PBPK models were not developed rather Cmax and AUC values were taken from the published PBPK studies for the comparison of Cmax and AUC values with the predicted values from mPBPK model. Hence, in this manuscript, there are no differential equations and generated Cmax-time plots for whole body PBPK. References for whole body PBPK model are provided in this manuscript so that the interested readers can find the whole body PBPK modeling strategy by the respective authors. In order to predict Cmax and AUC values for mPBPK, these values were used from healthy subjects from dedicated hepatic impairment clinical trials (Supplementary material). The following is the description of the development of the mPBPK model in this study.
In this study, the mPBPK model consisted of 4 physiological parameters in each category of hepatic impairment. The 4 physiological parameters used in this study were portal and renal blood flow, glomerular filtration rate (GFR), and liver size in different degrees of hepatic impairment [4, 5, 18] (Table 1). These 4 physiological parameters were chosen due to their substantial impact on liver impairment. In hepatic impairment, not only liver size is reduced with the progression of the disease but liver associated parameters such as portal blood flow are also reduced [18]. Since hepatic impairment impacts GFR [4] and renal blood flow [5]. Therefore, GFR and renal blood flow rates were selected. Two biochemical parameters such as albumin and bilirubin were also included. In hepatic impairment, albumin levels are reduced [18], and bilirubin levels are increased [19]. Hence, these two parameters were included. In short, only those parameters were selected which are substantially impacted by the liver impairment.
Fold change (compared to healthy subjects) in physiological parameters as a function of liver impairment
| Parameters | Mild | Moderate | Severe |
|---|---|---|---|
| GFR [4] | 0.70 | 0.58 | 0.55 |
| Renal blood flow [5] | 0.88 | 0.65 | 0.48 |
| Portal blood flow [18] | 0.72 | 0.60 | 0.13 |
| Albumin [18] | 0.84 | 0.69 | 0.53 |
| Bilirubin [19] | 1.10 | 2.50 | 3.50 |
| Sum | 4.24 | 5.02 | 5.19 |
| Functional liver size [18] | 0.91 | 0.81 | 0.64 |
The numbers in parenthesis are reference numbers. The values are ratios, therefore, without any unit. Bilirubin values widely vary across subjects with mild, moderate, and severe liver impairment. Bilirubin values in Table 1 are based on FDA guidance (< 2, 2–3, and > 3 mg/dL for mild, moderate, and severe liver impairment, respectively) [1] and severity grading in drug induced liver injury [19]. Any value of bilirubin > 1 or < 2 is considered mild liver impairment therefore, a value slightly > 1 (1.1) was chosen for subjects with mild liver impairment. According to severity grading, this value will be > 1–1.5. A mid-point of 2.5 was chosen for subjects with moderate liver impairment (2–3) [1]. According to severity grading, this value will be > 1.5–2.5. Any value can be > 3 for subjects with severe liver impairment therefore, a value slightly > 3 (3.5) was chosen for subjects with severe liver impairment [1]. According to severity grading, this value will be > 2.5–5. FDA: Food and Drug Administration; GFR: glomerular filtration rate
In this mPBPK model, only log P value was used as a product characteristic. It was noted that log P values for some drugs are negative, and the inclusion of negative log P in the model produced a slight impact (under-estimation) on the predictive power of the mPBPK model. Therefore, negative log P values were not included in the mPBPK model but rather ignored. The log P (experimental) values for mPBPK model were taken from DrugBank [20]. If experimental log P values were not available, then the predicted log P values were used. Average (all values were ratios) was taken for 3 physiological and 2 biochemical parameters (Table 1) as well as log P (if positive). The average value was divided using the liver mass for mild, moderate, and severe hepatic impairment to estimate a physiological factor (Table 1). This physiological factor was then used to predict Cmax and AUC in subjects with different degrees of hepatic impairment, as described in Equation 1 below. An example of calculation of AUC is shown in Supplementary example.
For the prediction of CL, the following Equation 2 should be used:
It should be noted that unlike a traditional whole body PBPK model, no differential equations were used to develop Cmax-time data for mPBPK model. This step was not needed in this study because Cmax and AUC values were available from healthy subjects from dedicated clinical trials and used with the physiological factors to predict (as shown in Equation 1) Cmax and AUC in subjects with different degrees of hepatic impairment.
Initially, the proposed mPBPK model was compared with the whole body PBPK model (n = 27). In order to further evaluate the robustness of the mPBPK model, 25 more drugs were taken from the literature and analyzed. The criteria for the selection of 25 drugs was the availability of the data in subjects with severe hepatic impairment because this is the group where prediction of Cmax and AUC is difficult. All 25 drugs had the AUC values in subjects with severe hepatic impairment (22 for Cmax). Overall, 52 drugs were used to predict the Cmax and AUC in subjects with different degrees of hepatic impairment to assess the predictive performance of the proposed mPBPK model by comparing with the observed (obtained from dedicated clinical trials) Cmax and AUC values.
Prediction fold errors of 2 (0.5–2), 0.5–1.5 (a 50% prediction error on either side of 1), and a more stringent criteria in terms of 0.7–1.3 (a 30% prediction error on either side of 1) were used for the assessment of the predictive performance of the proposed mPBPK model. A similar criteria was used for the comparison of mPBPK with the whole body PBPK. Considering a high variability in the PK parameters in liver impairment, a 30% prediction error was considered accurate and acceptable from clinical perspective. The prediction fold error was calculated as follows in Equation 3:
Average fold error (AFE), which is the log-transformed ratio of the predicted and observed Cmax or AUC, was calculated in patients with mild, moderate, and severe. For AFE, a value of 1.0 indicates no prediction error, and AFE was calculated as follows in Equation 4:
where n is the number of observations.
The fold-change (healthy versus liver impairment) for physiological and biochemical parameters used in this study to develop mPBPK model is shown in Table 1. The results of this study are summarized below and in Tables 2, 3, and 4. In supplementary Tables S1–S6, the observed and predicted AUC and Cmax values in subjects with different degrees of hepatic impairment by the mPBPK model and whole body PBPK model are shown. In supplementary Tables S7–S12, the predicted and observed AUC and Cmax values of 25 drugs with the observed PK values are presented to further demonstrate the robustness of the proposed mPBPK model. In Supplementary example, an example is provided to show how AUC can be predicted from the proposed method (same goes for Cmax).
Comparison between minimal and whole body PBPK prediction for AUC
| Range | mPBPK | Whole body PBPK | ||
|---|---|---|---|---|
| Within the range # | Within the range (%) | Within the range # | Within the range (%) | |
| Mild (n = 19) | ||||
| 0.5–2 | 16 | 84 | 17 | 89 |
| 0.5–1.5 | 15 | 79 | 14 | 74 |
| 0.7–1.3 | 11 | 58 | 10 | 53 |
| > 2 | 0 | 0 | 1 | 5 |
| < 0.5 | 3 | 16 | 1 | 5 |
| AFE | 0.84 | - | 0.96 | - |
| Moderate (n = 23) | ||||
| 0.5–2 | 20 | 87 | 19 | 83 |
| 0.5–1.5 | 20 | 87 | 18 | 78 |
| 0.7–1.3 | 15 | 65 | 11 | 48 |
| > 2 | 0 | 0 | 3 | 13 |
| < 0.5 | 3 | 13 | 1 | 4 |
| AFE | 0.79 | - | 0.94 | - |
| Severe (n = 11) | ||||
| 0.5–2 | 8 | 73 | 7 | 64 |
| 0.5–1.5 | 7 | 64 | 5 | 45 |
| 0.7–1.3 | 6 | 54 | 3 | 27 |
| > 2 | 0 | 0 | 3 | 27 |
| < 0.5 | 2 | 18 | 1 | 9 |
| AFE | 0.77 | - | 1.28 | - |
n = 27 drugs. -: no data. #: number of drugs. AFE: average fold error; AUC: area under the curve; mPBPK: minimal physiologically based pharmacokinetic; PBPK: physiologically based pharmacokinetic
Comparison between minimal and whole body PBPK prediction for Cmax
| Range | mPBPK | Whole body PBPK | ||
|---|---|---|---|---|
| Within the range # | Within the range (%) | Within the range # | Within the range (%) | |
| Mild (n = 9) | ||||
| 0.5–2 | 8 | 89 | 7 | 78 |
| 0.5–1.5 | 7 | 78 | 6 | 67 |
| 0.7–1.3 | 2 | 22 | 3 | 33 |
| > 2 | 0 | 0 | 2 | 22 |
| < 0.5 | 1 | 11 | 0 | 0 |
| AFE | 0.96 | - | 1.28 | - |
| Moderate (n = 16) | ||||
| 0.5–2 | 10 | 63 | 12 | 75 |
| 0.5–1.5 | 9 | 56 | 9 | 56 |
| 0.7–1.3 | 8 | 50 | 5 | 31 |
| > 2 | 4 | 25 | 4 | 25 |
| < 0.5 | 2 | 13 | 0 | 0 |
| AFE | 1.04 | - | 1.22 | - |
| Severe (n = 8) | ||||
| 0.5–2 | 3 | 38 | 4 | 50 |
| 0.5–1.5 | 1 | 13 | 3 | 38 |
| 0.7–1.3 | 1 | 13 | 2 | 25 |
| > 2 | 5 | 63 | 4 | 50 |
| < 0.5 | 1 | 13 | 0 | 0 |
| AFE | 1.66 | - | 1.71 | - |
n = 27 drugs. -: no data. #: number of drugs. AFE: average fold error; Cmax: maximum plasma concentration; mPBPK: minimal physiologically based pharmacokinetic; PBPK: physiologically based pharmacokinetic
Prediction statistics for AUC and Cmax by mPBPK (n = 52 drugs)
| Range | mPBPK (AUC) | mPBPK (Cmax) | ||
|---|---|---|---|---|
| Within the range # | Within the range (%) | Within the range # | Within the range (%) | |
| Mild | n = 37 | n =25 | ||
| 0.5–2 | 34 | 92 | 24 | 96 |
| 0.5–1.5 | 30 | 81 | 20 | 80 |
| 0.7–1.3 | 23 | 62 | 15 | 60 |
| > 2 | 0 | 0 | 2 | 8 |
| < 0.5 | 3 | 8 | 0 | 0 |
| AFE | 1.05 | - | 1.18 | - |
| Moderate | n = 47 | n = 38 | ||
| 0.5–2 | 44 | 94 | 34 | 89 |
| 0.5–1.5 | 41 | 87 | 26 | 68 |
| 0.7–1.3 | 29 | 62 | 20 | 53 |
| > 2 | 0 | 0 | 5 | 13 |
| < 0.5 | 3 | 6 | 0 | 0 |
| AFE | 0.95 | - | 1.21 | - |
| Severe | n = 36 | n = 30 | ||
| 0.5–2 | 32 | 89 | 23 | 77 |
| 0.5–1.5 | 28 | 78 | 16 | 53 |
| 0.7–1.3 | 19 | 53 | 11 | 37 |
| > 2 | 0 | 0 | 8 | 27 |
| < 0.5 | 3 | 8 | 0 | 0 |
| AFE | 0.90 | - | 1.42 | - |
-: no data. #: number of drugs. The number of observations in Table 4 is the total number of observations from mPBPK (Tables 2 and 3) and the additional data analysis of 25 drugs. AFE: average fold error; AUC: area under the curve; Cmax: maximum plasma concentration; mPBPK: minimal physiologically based pharmacokinetic
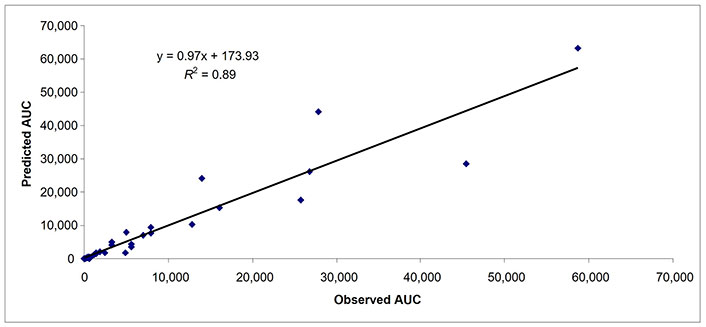
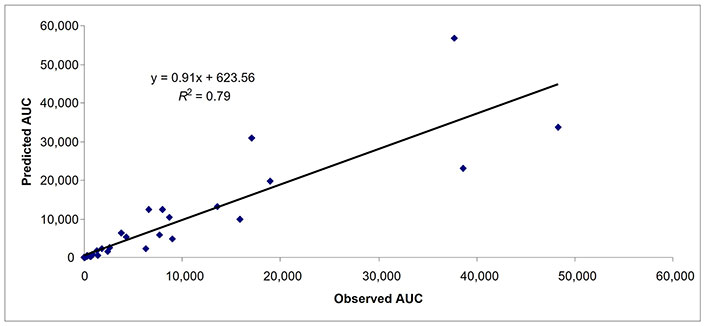
Figures 1, 2, and 3 show the relationship between predicted AUC values by mPBPK and whole body PBPK. Figures 4, 5, and 6 show the relationship between predicted AUC values from mPBPK and the observed AUC values (for all 52 drugs).
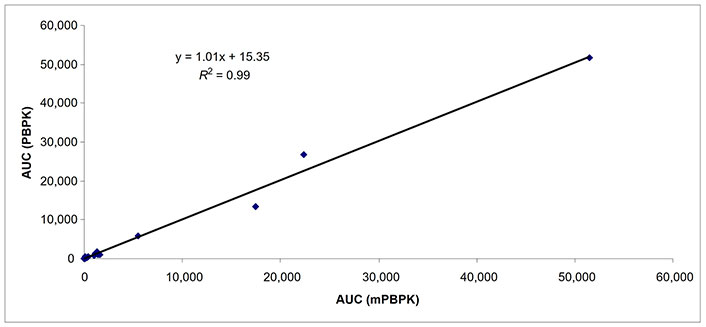
Predicted AUCs comparing whole body PBPK and mPBPK in subjects with mild hepatic impairment (n = 19). AUC: area under the curve; mPBPK: minimal physiologically based pharmacokinetic; PBPK: physiologically based pharmacokinetic
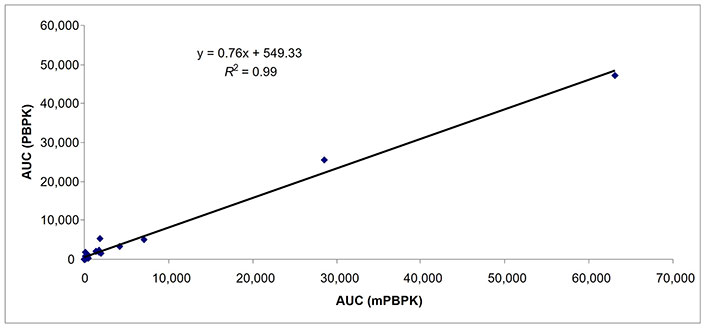
Predicted AUCs comparing whole body PBPK and mPBPK in subjects with moderate hepatic impairment (n = 23). AUC: area under the curve; mPBPK: minimal physiologically based pharmacokinetic; PBPK: physiologically based pharmacokinetic
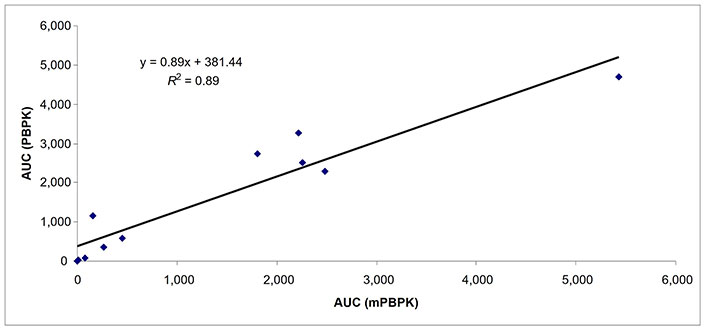
Predicted AUCs comparing whole body PBPK and mPBPK in subjects with severe hepatic impairment (n = 11). AUC: area under the curve; mPBPK: minimal physiologically based pharmacokinetic; PBPK: physiologically based pharmacokinetic
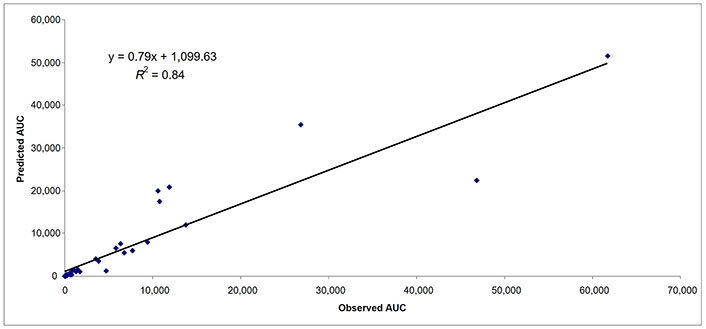
Predicted and observed AUCs in subjects with mild hepatic impairment (n = 37). AUC: area under the curve
Predicted and observed AUCs in subjects with moderate hepatic impairment (n = 47). AUC: area under the curve
Predicted and observed AUCs in subjects with severe hepatic impairment (n = 36). AUC: area under the curve
Out of 52 drugs, 27 drugs (53 and 33 data points for AUC and Cmax, respectively) were predicted by the proposed mPBPK model compared with the whole body PBPK model (Tables 2 and 3). Overall, from mPBPK, 52 drugs with 120 data points for AUC and 93 data points for Cmax were predicted in subjects with varying degrees of hepatic impairment (Table 4).
The predicted AUC and Cmax values by mPBPK and whole body PBPK (data from the literature) were compared with the observed values (from dedicated clinical trials). Then the comparison between mPBPK and whole body PBPK was done by looking at how many predicted values were within a given fold prediction error. For example, there were 16 and 17 data points in subjects with mild hepatic impairment for AUC within 0.5–2-fold prediction error from mPBPK and whole body PBPK models, respectively (Table 2).
The results of the study are summarized in Tables 2 and 3 and the observed versus predicted values are presented in supplementary Tables S1–S6. There were 27 drugs that were used to compare the AUC and Cmax by the proposed mPBPK model with the whole body PBPK model in subjects with varying degrees of hepatic impairment. The AUC of 27 drugs was predicted with 19, 23, and 11 data points in subjects with mild, moderate, and severe hepatic impairment.
For AUC, at least, 80% of observations were within 2-fold prediction error by both models in subjects with mild and moderate hepatic impairment (Table 2). In subjects with severe hepatic impairment (n = 11), the prediction of AUC was relatively poorer than the subjects with mild and moderate hepatic impairment by both models (Table 2).
From mPBPK in subjects with severe hepatic impairment, the percent of data points within 0.5–2-fold and 0.7–1.3-fold prediction error was 73% and 54%, respectively (Table 2). From whole body PBPK in subjects with severe hepatic impairment, the percent of data points within 0.5–2-fold and 0.7–1.3-fold prediction error was 64% and 27%, respectively (Table 2). However, the sample size (n = 11) in subjects with severe hepatic impairment is too small to make any comparison between the two models.
The Cmax of 16 drugs was predicted with 9, 16, and 8 data points in subjects with mild, moderate, and severe hepatic impairment (Table 3). The percent of data points within 0.5–2-fold prediction error was 89% and 78% in subjects with mild hepatic impairment by mPBPK and whole body PBPK model, respectively. The percent of data points within 0.5–2-fold error was 63% and 75% in subjects with moderate hepatic impairment by mPBPK and whole body PBPK model, respectively. In subjects with severe hepatic impairment, the percent of data points within 0.5–2-fold prediction error was 38% and 50% by mPBPK model and whole body PBPK model, respectively (Table 3). A strong relationship (R2 = ≥ 0.89 for all three categories of hepatic impairment) for predicted AUC values was found between mPBPK and PBPK models (Figures 1–3).
The results of the study indicated that both minimal and whole body PBPK models provided similar results for the prediction of AUC in subjects with mild and moderate hepatic impairment. However, the prediction of AUC in subjects with severe hepatic impairment was poor in both models (Table 2). The percent of data points within 0.7–1.3-fold error was < 50% by both models. The sample size (n = 11) was too small to make any definitive conclusion about the predictive power of the two models for AUC in subjects with severe hepatic impairment.
The prediction of Cmax was even worse than the AUC in subjects with severe hepatic impairment (Table 3). Overall, the prediction of Cmax in subjects with moderate and severe hepatic impairment was poor compared with the prediction of the AUC in subjects with mild hepatic impairment. As the degree of liver impairment increased, the predictive power of both models decreased. It should not be surprising because the physiological complexities increase as the severity of hepatic impairment increases.
The AFE for AUC in subjects with mild, moderate, and severe hepatic impairment by PBPK model was 0.96, 0.94, and 1.28, respectively, whereas, by mPBPK these values were 0.84, 0.79, and 0.77, respectively (Table 2). The AFE for Cmax in subjects with mild, moderate, and severe hepatic impairment by PBPK was 1.28, 1.22, and 1.71, respectively, whereas, by mPBPK these values were 0.96, 1.04, and 1.66, respectively (Table 3).
Overall, the results of the study indicate that the predictive performance of the proposed mPBPK in terms of AUC and Cmax is comparable with the whole body PBPK.
Besides comparing the mPBPK model with whole body PBPK (n = 27 drugs), 25 additional drugs were used to evaluate the robustness of the proposed mPBPK model. For 52 drugs, there were 37, 47, and 36 data points for AUC in subjects with mild, moderate, and severe hepatic impairment, respectively (Table 4). In subjects with mild, moderate, and severe hepatic impairment, 92%, 94%, and 89% of data points (AUC) were within 2-fold prediction error, respectively (Table 4). As observed previously, as the severity of the hepatic impairment increased the accuracy of the prediction decreased. In subjects with mild, moderate, and severe hepatic impairment, 62%, 62%, and 53% of data points (AUC) were within 0.7–1.3-fold prediction error, respectively (Table 4). The AFE for AUC in mild, moderate, and severe hepatic impairment was 1.05, 0.95, and 0.90, respectively. In Figures 4–6, the predicted and observed AUC values by mPBPK model are shown. A strong relationship (R2 = ≥ 0.79 for all three categories of hepatic impairment) for predicted and observed AUC values from mPBPK model was noted (Figures 4–6).
For 52 drugs, there were 25, 38, and 30 observations for Cmax in subjects with mild, moderate, and severe hepatic impairment, respectively (Table 4). In subjects with mild, moderate, and severe hepatic impairment, 96%, 89%, and 77% data points (Cmax) were within 2-fold prediction error, respectively (Table 4). In subjects with mild, moderate, and severe hepatic impairment, 60%, 53%, and 37% data points (Cmax) were within 0.7–1.3-fold prediction error, respectively. The AFE for Cmax in mild, moderate, and severe hepatic impairment was 1.18, 1.21, and 1.42, respectively.
Overall, the results indicated that AUC and Cmax can be predicted with reasonable accuracy by mPBPK model in subjects with mild and moderate hepatic impairment. The prediction of AUC and Cmax was not as accurate in subjects with severe hepatic impairment as in the subjects with mild and moderate hepatic impairment by both mPBPK and whole body PBPK models.
There is high uncertainty in the prediction of drug exposure in subjects with severe hepatic impairment. This may be because the morphological and physiological changes in subjects with severe hepatic impairment are more complex and severe than the mild and moderate hepatic impairment. This complexity and uncertainty cannot be picked up by models. Furthermore, in a modeling exercise, model-specific limitations due to assumptions in model parameters may be more relevant to severe hepatic impairment than mild and moderate hepatic impairment.
Whole body PBPK models have been suggested for the prediction of PK parameters for special populations such as pediatrics, pregnancy, and renal and hepatic impairment and subsequently for dedicated clinical trials in a specific population. However, over the years, comparative studies between whole body PBPK and minimal or reduced PBPK models have shown that mPBPK models in their predictive performance are as robust and accurate as whole body PBPK models [7–17]. A mPBPK model uses only a few physiological parameters (as few as 3–5) and one or two drug-related physicochemical characteristics and is much simpler to develop than a whole body PBPK model.
The mPBPK model used in this study differs from traditional whole body PBPK models or even other mPBPK models in the sense that no differential equations were developed to generate Cmax-time data but retained two basic characteristics of a whole body PBPK or mPBPK models in terms of physiological organs or parameters and product characteristics. Four physiological parameters, two biochemical parameters, and one product characteristic in terms of log P were used to develop physiological factors for different degrees of hepatic impairment. The direct use of Cmax and AUC values from healthy subjects along with physiological factors generated in this study made it possible to predict Cmax and AUC in subjects with different degrees of hepatic impairment. In other words, the proposed mPBPK model retains the characteristics of a typical whole body or mPBPK model (physiological parameters and product characteristics) but uses a simpler mathematical approach rather than using differential equations to achieve its objective (prediction of Cmax and AUC in subjects with hepatic impairment).
The amount of CYP isozymes such as 3A4, 2D6, 1A2, and 2C9 is substantially reduced in subjects with hepatic impairment [4, 5]. Li et al. [18] in their mPBPK model used liver transporter mRNA levels, uptake transporter activity, and efflux transporter activity but not the CYP isozymes. It should be noted that the authors used the same values for all their transporter parameters in all three categories of hepatic impairment. The contents of CYP isozymes, transporter mRNA levels, and transporter activity were not included in this mPBPK model, and yet the prediction of exposure by mPBPK and whole body PBPK were found to be similar.
In a previous study [15], it was shown that the exposure or CL of renally excreted drugs in subjects with renal impairment (from mild to severe) can be predicted with just one single physiological parameter (GFR) with similar accuracy as with a whole body PBPK model. The comparable prediction accuracy of mPBPK model with the whole body PBPK model indicates (in this study and some previous studies) that the extensive number of physiological parameters as well as product characteristics used in a whole body PBPK model are unnecessary.
In a real world, a mPBPK model or other simple empirical models are more attractive than a whole body PBPK model because a mPBPK model is much simpler and cost- and time-effective, yet as robust and accurate as a whole body PBPK model [7–17]. The proposed methods in this study also do not require any special software rather the entire calculation can be done on a spreadsheet in a very short period of time.
There are two limitations of the mPBPK model presented in this study. The application of negative log P value may add more errors in the prediction than the positive log P value. This is of mathematical nature and the magnitude of prediction error will depend on the negative value of log P (for example, –1 or –3). Higher the negative value, higher the prediction error (highly likely). Furthermore, this model can not estimate inter-individual variability.
There is high variability in the observed PK parameters in subjects with hepatic impairment especially, in severe liver impairment. Therefore, the dose adjustment will require a correct estimate of change in the magnitude of exposure to a drug especially, in severe hepatic impairment. A 2-fold prediction error or even 50% prediction error may not be acceptable for the selection of the ‘right dose’ in subjects with hepatic impairment especially, in severe hepatic impairment. A dedicated clinical PK study will provide accurate information regarding the impact of hepatic impairment of a drug. Whole body PBPK or mPBPK may be used to predict exposure to a drug in subjects with hepatic impairment and the predicted exposure (using experience and scientific judgment) can then be used to select a dose to initiate the clinical trial in this population. PK study should be conducted in all three types of hepatic impairment because PK can be different across three groups especially, in subjects with moderate and severe hepatic impairment than healthy subjects.
In conclusion, this study demonstrates that a mPBPK model using 4 physiological parameters, two biochemical parameters, and one parameter as a product characteristic can be developed with reasonable accuracy for the prediction of drug exposure in subjects with varying degrees of hepatic impairment. More accurate prediction was noted in subjects with mild and moderate hepatic impairment as compared to subjects with severe hepatic impairment by both models. In order to evaluate the robustness and accuracy of the proposed model a study with a larger data set particularly, in patients with severe hepatic impairment is needed.
The renowned statistician Box [21] stated that “since all models are wrong the scientist cannot obtain a ‘correct’ one by excessive elaboration.”. On the contrary, following William of Occam should seek an economical description of natural phenomena. Just as the ability to devise simple but evocative models is the signature of the great scientist so over-elaboration and over-parameterization are often the mark of mediocrity.
AFE: average fold error
AUC: area under the curve
CL: clearance
Cmax: maximum plasma concentration
CYP3A: cytochrome P450 3A
FDA: Food and Drug Administration
GFR: glomerular filtration rate
mPBPK: minimal physiologically based pharmacokinetic
PBPK: physiologically based pharmacokinetic
PK: pharmacokinetic
The supplementary tables for this article are available at: https://www.explorationpub.com/uploads/Article/file/100894_sup_1.pdf. Other supplementary material for this article is available at: https://www.explorationpub.com/uploads/Article/file/100894_sup_2.pdf.
IM: Conceptualization, Data curation, Writing—original draft.
The author has no conflicts of interest.
Since this study analyzed secondary data, ethical approval is not required.
Not applicable.
Not applicable.
Data were taken from the literature and references are provided in the manuscript.
Not applicable.
© The Author(s) 2025.
Open Exploration maintains a neutral stance on jurisdictional claims in published institutional affiliations and maps. All opinions expressed in this article are the personal views of the author(s) and do not represent the stance of the editorial team or the publisher.
Copyright: © The Author(s) 2025. This is an Open Access article licensed under a Creative Commons Attribution 4.0 International License (https://creativecommons.org/licenses/by/4.0/), which permits unrestricted use, sharing, adaptation, distribution and reproduction in any medium or format, for any purpose, even commercially, as long as you give appropriate credit to the original author(s) and the source, provide a link to the Creative Commons license, and indicate if changes were made.