 Original Article

Affiliation:
1LifeScan Scotland Ltd, IV2 3ED Inverness, UK
Email: mgrady@lifescan.com
ORCID: https://orcid.org/0000-0002-8006-1844
Affiliation:
1LifeScan Scotland Ltd, IV2 3ED Inverness, UK
ORCID: https://orcid.org/0000-0003-1152-8209
Affiliation:
2LifeScan Global Corporation, Malvern, PA 19355, USA
ORCID: https://orcid.org/0000-0003-4329-3379
Explor Endocr Metab Dis. 2024;1:167–176 DOI: https://doi.org/10.37349/eemd.2024.00014
Received: January 10, 2024 Accepted: May 13, 2024 Published: July 24, 2024
Academic Editor: Victor Gault, Ulster University, UK
The article belongs to the special issue The Impact of Digitalization To Improve Nutrition and Self-Management in Patients With Diabetes
Aim: Current diabetes guidelines recommend people with gestational diabetes mellitus (PwGDM) use primarily blood glucose meters (BGM) for diabetes management. We evaluated glycemic trends and guideline-recommended glycemic targets achieved in PwGDM using a diabetes app with a family of Bluetooth® connected BGMs.
Methods: Anonymized glucose and app analytics data from 26,382 PwGDM were sourced from a server. Data from their first 7-days using the app with connected BGMs was compared to 7-days prior to a 10-week timepoint.
Results: Percent fasting readings in range (RIR, < 5.3 mmol/L) improved by +20.3 percentage points in the overall population. Improved glucose RIR (3.5 to 7.8 mmol/L) (+8.3 percentage points), mean blood glucose (BG, –0.59 mmol/L), and fasting RIR (+33.2 percentage points) were observed in those with baseline mean BG ≥ 6.1 mmol/L. Improvements in mean BG of –0.32 to –2.36 mmol/L, and RIR of +3.0 to +38.3 percentage points correlated with higher baseline mean BG ≥ 6.1 to ≥ 7.8 mmol/L. Only 58.5% of PwGDM with baseline mean BG ≥ 6.1 mmol/L had > 80% RIR at baseline, which improved to 79.5% at 10 weeks. PwGDM averaged 17 app sessions and 90 minutes per week on the app.
Conclusions: PwGDM engaged with the diabetes app and connected BGM, facilitating attainment of glycemic targets, an especially important outcome for those with higher mean glucose at baseline.
Gestational diabetes mellitus (GDM) prevalence has increased in parallel with obesity and diabetes, with global prevalence estimated at 14.0% [1]. The severity of maternal glycemia is associated with complications [2]. In the Hyperglycemia and Adverse Pregnancy Outcomes study, increasing levels of glycemia, whether fasting, 1-hour, or 2-hour postprandial, were associated with worsening outcomes [3]. For people with GDM (PwGDM), who are usually diagnosed in the second or third trimester of pregnancy and revert back to normoglycemia after delivery, the 2024 American Diabetes Association (ADA) Standards of Care for Diabetes in Pregnancy recommend blood glucose meters (BGM) as the primary tool for glucose monitoring [4]. Recommended targets include fasting blood glucose (BG) < 5.3 mmol/L and either 1-hour postprandial BG < 7.8 mmol/L or 2-hour postprandial BG < 6.7 mmol/L. While recognizing the superiority of continuous glucose monitors (CGM) in pregnant people with type 1 diabetes [5], the ADA standards state there is insufficient data to support CGM for pregnant people with type 2 diabetes or PwGDM [6–8]. Similarly, the International Consensus on time in range (TIR) [9] found insufficient evidence to provide firm recommendations on TIR for PwGDM, but provided guidance, suggesting > 90% TIR (3.5 to 7.8 mmol/L), < 5% time above range (> 7.8 mmol/L), < 4% time below range (< 3.5 mmol/L) and < 1% time below range (< 3.0 mmol/L). The CGM concept of TIR cannot be applied to episodic monitoring using BGMs; therefore, we use the concept of “readings in range” (RIR). Our real-world evidence analysis of 26,382 PwGDM, performing over 8 million glucose readings, evaluated the utility of a diabetes app and Bluetooth® connected BGMs to support improved glycemic management and achievement of guideline-recommended glycemic targets.
This real-world data analysis is based on pooled app data from PwGDM in 17 countries using a family of Bluetooth® connected OneTouch® blood glucose meters, consisting of Select Plus Flex, Ultra Plus Flex, Verio Flex, Ultra Plus Reflect and Verio Reflect (Figure 1 and Supplementary material). Data on performance of these systems has been published [10, 11]. Bluetooth® technology allows people to sync this family of meters to the OneTouch Reveal® mobile diabetes app. Users can grant permission to share app data in real-time with clinicians who use the professional (web) version of the app. We used de-identified data from registered users of the app. People who downloaded the app were informed about the processing of personal data in accordance with the privacy policy. Users provided explicit consent for the processing of personal data, including use of de-identified data to perform analytics, conduct research, and for product development. Additional ethics committee approval was not required, and no clinical sites or external investigators were involved. The current analysis fetched data from users who registered for the app between 29th March 2016 and 18th April 2023.
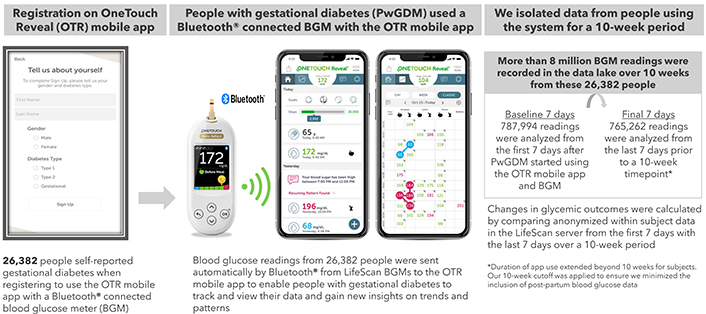
Process for real-world data collection from the OneTouch Reveal® mobile diabetes app
Analyses were performed for people who self-reported a diagnosis of GDM during app registration (Figure 1). People with a GDM diagnosis often are advised to perform BG monitoring from diagnosis until delivery, typically a time span of 10 to 16 weeks. Based on analysis of the distribution of our dataset, we determined that a 10-week period captured sufficient BG data from the vast majority of PwGDM, while remaining short enough to exclude postpartum data. From our data lake, we identified 26,382 PwGDM who checked BG at least 3.5 times per day over a 10-week period (over 8 million readings). We performed within-subject pairwise comparisons of the 787,994 readings from their first 7 days after app registration (Baseline) to the 765,262 glucose readings during the 7 days prior to a 10-week timepoint. Paired within-subject changes were calculated for the following endpoints: RIR (defined as 3.5 to 7.8 mmol/L), hyperglycemic readings (> 7.8 mmol/L), and hypoglycemic readings (< 3.5 mmol/L). The first glucose check between 5 am and 8 am and not tagged as “post-meal” was defined as “fasting,” with fasting RIR defined as < 5.3 mmol/L. Based on the distribution of observed glucose data, we also conducted an analysis of outcomes for those with a baseline mean BG < 6.1 versus ≥ 6.1 mmol/L. App analytics (number of app sessions, time spent on the app and the specific app screens viewed; see Supplementary material) retrieved from Google Analytics enabled us to describe app interactions and app feature usage per subject. All statistical comparisons between baseline and 10 weeks were performed by paired-sample t-tests using IBM SPSS Statistics 26. All statistical comparisons were p < 0.001.
Our dataset included 26,382 PwGDM who checked their BG at least 3.5 times per day on average over the 10-week timeframe, providing 8,070,414 individual glucose readings. Mean BG level of 6.07 mmol/L at baseline was maintained at 10 weeks (5.83 mmol/L), and the proportion of fasting RIR increased by +20.3 percentage points (50.6% to 71.0%). RIR improved marginally by +3.1 percentage points (88.9% to 92.0%) with a concomitant reduction of –3.3 percentage points for hyperglycemic readings (10.7% to 7.5%). The frequency of BG checks remained steady from baseline to 10 weeks (4.3 to 4.1 checks per day) (Table 1). A clinically meaningful reduction in mean BG of –0.59 mmol/L at 10 weeks (6.73 to 6.13 mmol/L) was found in those with baseline mean BG ≥ 6.1 mmol/L, with minimal changes in those with baseline mean BG < 6.1 mmol/L. Over 95% of glucose readings remained in range in those with baseline mean BG < 6.1 mmol/L; however, those with higher initial mean BG (≥ 6.1 mmol/L) had only 79.4% RIR at baseline, improving to 87.7% RIR at 10 weeks. More dramatic gains were seen in their fasting RIR, with only 30.4% of baseline readings between 5 am and 8 am < 5.3 mmol/L, improving to 63.6% at 10 weeks (Table 2). Mean BG reduced by –0.32, –0.64, –1.11 and –2.36 mmol/L in subjects with baseline mean BG ranging from ≥ 6.1 to ≥ 7.8 mmol/L. Similarly, RIR improved by +3.0, +10.3, +19.6 and +38.3 percentage points on average in subjects with baseline mean BG ranging from ≥ 6.1 to ≥ 7.8 mmol/L. Those with more clinically acceptable mean BG levels (≥ 5.0 to ≤ 6.1 mmol/L) maintained this level of glycemia, whereas those with the very lowest baseline levels (< 5.0 mmol/L) increased mean BG and RIR at 10 weeks to more clinically appropriate levels (Table 3 and Table 4). The proportion of PwGDM who had > 80% RIR at baseline was 1.7-fold higher in those with baseline mean BG < 6.1 mmol/L versus those with baseline mean BG ≥ 6.1 mmol/L (98.8% vs 58.5%). More PwGDM with sub-optimal baseline mean BG achieved this > 80% RIR target at 10 weeks using the app and BGM system than at baseline (58.5% improving to 79.5%). Similarly, in these same PwGDM, a dramatic improvement was observed in the proportion who achieved the target of < 5% of readings in the hyperglycemic range (from 9.0% to 32.2%) (Table 5). PwGDM performed an average of 17 sessions on the diabetes app every week and spent more than 90 minutes per week interacting with the app, where they could visualize glucose trends and gain behavioral insights (Supplementary material). To broaden applicability, we also present the data within the results tables in mg/dL in Tables S1–5.
Summary of glycemic changes and BG check frequency
| Glycemic metrics in PwGDM | Baseline to 10 weeks (n = 26,382)* | ||
|---|---|---|---|
| Baseline(First 7 days) | At 10 weeks(Last 7 days) | Change frombaseline | |
| Mean BG | 6.07 ± 0.80 mmol/L | 5.83 ± 0.55 mmol/L | –0.23 mmol/L* |
| Hypoglycemic readings < 3.5 mmol/L(mean BG ± SD) | 0.4%(3.07 ± 0.48 mmol/L) | 0.5%(3.10 ± 0.43 mmol/L) | +0.1 %pts* |
| Fasting readings in-range < 5.3 mmol/L(mean BG ± SD) | 50.6%(4.76 ± 0.32 mmol/L) | 71.0%(4.67 ± 0.32 mmol/L) | +20.3 %pts# (n = 18,235) |
| Readings in-range 3.5 to 7.8 mmol/L(mean BG ± SD) | 88.9%(5.75 ± 0.44 mmol/L) | 92.0%(5.63 ± 0.35 mmol/L) | +3.1 %pts* |
| Hyperglycemic readings > 7.8 mmol/L(mean BG ± SD) | 10.7%(8.74 ± 0.91 mmol/L) | 7.5%(8.63 ± 0.81 mmol/L) | –3.3 %pts* |
| Hyperglycemic readings > 10.0 mmol/L(mean BG ± SD) | 1.6%(11.25 ± 1.78 mmol/L) | 0.7%(11.29 ± 1.90 mmol/L) | –0.9 %pts* |
| BGM check frequency (average per day) | 4.3 | 4.1 | –0.1* |
*: mean, within subject, difference between baseline and 10 weeks. Includes only subjects checking BG at least 3.5 times per day on average. # Percentage of BG readings within a time window of 5–8 am that were < 5.3 mmol/L. Average of within subject changes from baseline. All changes p < 0.001. To convert mmol/L to mg/dL, multiply by 18.0182. %pts: percentage points; BG: blood glucose; PwGDM: people with gestational diabetes mellitus
Change in mean BG and RIR as a function of mean BG at baseline
| Baselinemean BG | Mean checkfrequency | Mean BGat base | Mean BGat 10 weeks | Change* inmean BG | RIRat baseline | RIRat 10 weeks | Change* in RIR3.5 to 7.8 mmol/L | Fasting RIRat baseline | Fasting RIRat 10 weeks | Change infasting RIR < 5.3 mmol/L# |
|---|---|---|---|---|---|---|---|---|---|---|
| < 6.1 mmol/L (n = 15,542) | 4.4 | 5.60 mmol/L | 5.63 mmol/L | +0.02 mmol/L | 95.5% | 95.1% | –0.5 %pts | 65.1% | 76.2% | +11.2 %pts(n = 10,638) |
| ≥ 6.1 mmol/L (n = 10,840) | 4.3 | 6.73 mmol/L | 6.13 mmol/L | –0.59 mmol/L | 79.4% | 87.7% | +8.3 %pts | 30.4% | 63.6% | +33.2 %pts(n = 7,597) |
*: mean, within subject, difference between baseline and 10 weeks. Includes only subjects checking BG at least 3.5 times per day on average. # Percentage of BG readings within a time window of 5–8 am that were < 5.3 mmol/L. Average of within subject changes from baseline. To convert mmol/L to mg/dL, multiply by 18.0182. %pts: percentage points; BG: blood glucose; RIR: readings in range
Change in mean BG as a function of mean BG at baseline
| Mean glucose at baseline (mmol/L) | Number of GDM subjects(n = 26,382) | Check frequencyper day at baseline | Mean glucoseat baseline | Mean glucoseat 10 weeks | Change* inmean glucose |
|---|---|---|---|---|---|
| < 4.4 | 20 | 4.1 | 4.30 mmol/L | 4.89 mmol/L | +0.58 mmol/L |
| ≥ 4.4 to < 5.0 | 809 | 4.4 | 4.82 mmol/L | 5.13 mmol/L | +0.32 mmol/L |
| ≥ 5.0 to < 5.6 | 5,332 | 4.5 | 5.32 mmol/L | 5.47 mmol/L | +0.15 mmol/L |
| ≥ 5.6 to < 6.1 | 9,381 | 4.3 | 5.82 mmol/L | 5.76 mmol/L | –0.07 mmol/L |
| ≥ 6.1 to < 6.7 | 6,710 | 4.1 | 6.34 mmol/L | 6.02 mmol/L | –0.32 mmol/L |
| ≥ 6.7 to < 7.2 | 2,545 | 4.0 | 6.88 mmol/L | 6.24 mmol/L | –0.64 mmol/L |
| ≥ 7.2 to < 7.8 | 899 | 4.0 | 7.46 mmol/L | 6.34 mmol/L | –1.11 mmol/L |
| ≥ 7.8 | 686 | 3.9 | 8.92 mmol/L | 6.56 mmol/L | –2.36 mmol/L |
*: mean, within subject, difference between baseline and 10 weeks. Includes only subjects checking BG at least 3.5 times per day on average. To convert mmol/L to mg/dL, multiply by 18.0182. BG: blood glucose; GDM: gestational diabetes mellitus
Change in readings in range as a function of mean BG at baseline
| Mean glucose at baseline (mmol/L) | Number of GDM subjects(n = 26,382) | Readings in rangeat baseline | Readings in rangeat 10 weeks | Change in readings in range3.5–7.8 mmol/L |
|---|---|---|---|---|
| < 4.4 | 20 | 89.0% | 95.1% | +6.1 %pts |
| ≥ 4.4 to < 5.0 | 809 | 97.3% | 97.3% | –0.0 %pts |
| ≥ 5.0 to < 5.6 | 5,332 | 97.4% | 96.3% | –1.1 %pts |
| ≥ 5.6 to < 6.1 | 9,381 | 94.3% | 94.1% | –0.2 %pts |
| ≥ 6.1 to < 6.7 | 6,710 | 87.3% | 90.3% | +3.0 %pts |
| ≥ 6.7 to < 7.2 | 2,545 | 75.7% | 85.9% | +10.3 %pts |
| ≥ 7.2 to < 7.8 | 899 | 62.4% | 82.1% | +19.6 %pts |
| ≥ 7.8 | 686 | 38.6% | 76.9% | +38.3 %pts |
*: mean, within subject, difference between baseline and 10 weeks. Includes only subjects checking BG at least 3.5 times per day on average. To convert mmol/L to mg/dL, multiply by 18.0182. %pts: percentage points; BG: blood glucose; GDM: gestational diabetes mellitus
Change in goal attainment in those with lower or higher mean BG at baseline
| Percent of subjects achievingtargets for gestational diabetes† | Percent of subjects achieving guideline target range goals at baseline and 10 weeks based on mean BG category at baseline* | |||||
|---|---|---|---|---|---|---|
| BG < 6.1 mmol/L(% of subjectsat baseline)(n = 15,542) | BG <6.1 mmol/L(% of subjectsat 10 weeks)(n = 15,542) | Change from baselinein subjectsachieving this goal | BG ≥ 6.1 mmol/L(% of subjectsat baseline)(n = 10,840) | BG ≥ 6.1 mmol/L(% of subjectsat 10 weeks)(n = 10,840) | Change from baselinein subjectsachieving this goal | |
| Achieved target for% readings < 3.0 mmol/L | 96.8 | 97.6 | +0.8 %pts | 99.0 | 96.4 | –2.6 %pts |
| Achieved target for% readings < 3.5 mmol/L | 95.7 | 96.1 | +0.4 %pts | 99.2 | 95.4 | –3.8 %pts |
| Achieved target for% readings 3.5 to 7.8 mmol/L | 98.8 | 96.6 | –2.3 %pts | 58.5 | 79.5 | +21.0 %pts |
| Achieved target for% readings > 7.8 mmol/L | 68.6 | 68.0 | –0.6 %pts | 9.0 | 32.2 | +23.2 %pts |
*: Includes only subjects checking BG at least 3.5 times per day on average. All readings < 3.0, < 3.5, 3.5–7.8 and > 7.8 mmol/L identified and the percentage of subjects meeting each of the PwGDM target guidelines calculated at baseline and at 10 weeks. † Guidelines targets for readings in range are: < 1% readings < 3.0 mmol/L; < 4% readings < 3.5 mmol/L; > 80% readings 3.5 to 7.8 mmol/L; < 5% readings > 7.8 mmol/L. To convert mmol/L to mg/dL, multiply by 18.0182. %pts: percentage points; BG: blood glucose; PwGDM: people with gestational diabetes mellitus
Our real-world analysis found PwGDM using the diabetes app with Bluetooth® connected BGMs either maintained or significantly improved attainment of guideline-recommended glycemic goals. Greater improvements in mean BG and RIR were found in those who had higher levels of glycemia when initiating the app and meter, which is promising given the greater likelihood of perinatal complications if hyperglycemia persists.
High patient and clinician satisfaction have previously been reported in PwGDM using Bluetooth® connected BGMs with a smartphone-based app [12], consistent with findings we have also noted in our studies where we assessed this [13, 14]. One feature available in the app we used that we did not explore in our analysis was the ability to set customized BG checking reminders; however, a prior systematic review showed that reminder systems increased compliance with monitoring and decreased mean BG levels [15]. Furthermore, switching to a Bluetooth® connected BGM and app-based system significantly improved BG data logging by users and the availability of BG data in the electronic health record [16].
We observed that a large proportion of subjects in our real-world analysis had high mean glucose levels initially. This is important given there is strong evidence that glycemic trend trajectories upon GDM diagnosis are associated with perinatal outcomes. For instance, PwGDM with stable optimal or rapidly improving trajectories were more likely to perform ≥ 3 checks per day, which is consistent with our check frequency data, and were less likely to have perinatal complications, whereas PwGDM with slowly improving or sub-optimal glycemic trajectories were less likely to check ≥ 3 times per day [17]. A further association was observed in a study by Wernimont et al. [18] between adherence to BG checking recommendations (of 4 glucose checks per day) using a cellular-enabled BGM and improved perinatal outcomes, observed over approximately 9 weeks. That study was limited by a small sample size of 63 PwGDM.
A more extensive study in 260 PwGDM by Pigato et al. [19] found that higher GDM management adherence, including to glucose checking, was linked to better glycemic management and a reduced risk for operative delivery, especially compared to the subset of 47 PwGDM in the least adherent group.
Our dataset did not contain patient-level information on clinical care received or post-partum outcomes, so we cannot comment on whether the check frequencies or glycemic changes we observed improved perinatal outcomes. It is plausible that the features and insights provided by our systems support better compliance to recommended BG checking guidelines, which other studies have shown can improve outcomes [17–19]. Others have shown that applying more stringent glycemic targets (fasting < 5.0 mmol/L, postprandial < 6.7 mmol/L), especially in overweight or obese PwGDM, improved glycemic management with minimal additional hypoglycemia risk [20]. We also observed negligible hypoglycemia in our cohort. The benefits of achieving an A1c target of < 6.5% (< 48 mmol/mol) throughout pregnancy [21] substantiate the importance of maintaining RIR, which can be supported by the insights provided by regular monitoring. Despite the advent of CGM, episodic monitoring with BGM remains the primary glucose monitoring technology used globally, especially for PwGDM, for whom the most recent standards recommend using BGM. It is worth emphasizing, however, that the outcomes reported here should not be extrapolated to other meters or apps given the many unique features in our meters and app (e.g., ColorSure Range Indicators, Blood Sugar Mentor feature and 14-day summary reports).
The Bluetooth® connected meters used in this analysis enable automatic transmission of readings to the electronic logbook within the app. The criticality of this becomes obvious when considering reports that raise concerns regarding data integrity. In one, only 62% of PwGDM performed ≥ 80% of their recommended glucose checks, with significant discrepancies between self-reported readings in a paper diary and those in the meter memory [22]. In a systematic review, which included studies with PwGDM, authors concluded that the failure to record glucose checks in paper diaries was the most extensive “error” seen, but the inclusion of readings that were not in the meter memory was a greater cause for concern [23].
Clearly, our real-world design does not allow us to ascertain how, or if, healthcare professionals used data from the system during consultations, but one can be assured of the integrity of readings transmitted to the app, which are then automatically presented as color-coded trends and patterns for clinical guidance and decision making. Data integrity was especially important when we examined improvements in fasting readings, between 5 am and 8 am. Only the first (earliest) reading in this timeframe was used for our analysis and post-meal tagged readings were also excluded. We acknowledge that this purposefully conservative 3-hour timeframe may still include non-fasting readings and may omit some fasting readings but, in comparison to far smaller randomized clinical studies, the volume of data available in our analysis provides reassurance regarding data sufficiency. We also witnessed a dramatic improvement of readings achieving the guideline target within this designated timeframe. This finding is especially important given that data from a large medical record analysis of 12,942 PwGDM showed high fasting BG levels were associated with a higher risk for adverse outcomes [24].
We adopted the same numeric goals for our analysis using BGM as are used by the consensus TIR guidelines for CGM [9], although we replaced the concept of TIR with RIR. We observed that more than 80% of our users who had lower mean glucose readings initially continued to meet our target of having > 90% of their readings be in range. By contrast, while it was concerning that only one-fifth of those with higher mean glucose readings at baseline met this same criterion, encouragingly this improved substantially to 49% at 10 weeks using the app and meter. It is worth acknowledging that the > 90% TIR criterion specific to gestational diabetes in the consensus guidance represents a high benchmark because it assumes CGM usage. Arguably, this benchmark could be lower when applied to BGM. In fact, an analysis of perinatal complications in 26,774 PwGDM from a health insurer [17] defined optimal glycemic management as at least 80% of BGM readings meeting ADA glycemic targets. When applying this criterion of > 80% RIR, we reassuringly found that 79% of those PwGDM with higher initial mean glucose readings achieved this goal after using the app and meter, as did 97% of those with lower initial mean glucose readings.
The anonymized and limited nature of real-world data collection did not enable us to confirm gestational age upon app initiation or the date of delivery. We also recognise that BG readings would be influenced by additional factors that we could not assess, such as lifestyle interventions, whether medications were prescribed and the nature of these medications. We also did not have access to perinatal outcomes or the extent of complications arising during pregnancy. While the nature of our data analysis precluded our ability to see diabetes management interventions, it is assumed that interventions occurred. BGM data is of most value when it is used to make adjustments in diabetes management by either the person with diabetes (lifestyle changes) or the healthcare professional (medication changes). Accordingly, it is the visibility of the BG data and patterns in the app and BGM that enables changes in diabetes management that lead to improved glycemic outcomes.
In contrast to smaller traditional clinical studies, a major strength of real-world evidence methodology is the ability to offset the lack of specific patient information or a control group with far greater patient numbers per endpoint to derive insights and conclusions. Real-world evidence studies and randomized controlled trials complement each other in the knowledge they provide.
Given the continuing reliance by the vast majority of PwGDM on BGM systems, it is important to benchmark the clinical benefits of the latest Bluetooth® connected BGM/digital innovations. The BGM systems we analyzed as one component of the overall treatment care plan enabled PwGDM to maintain high levels of concordance with guideline-recommended glycemic targets during pregnancy and significantly improved attainment of targets in PwGDM with higher initial glycemia.
ADA: American Diabetes Association
BG: blood glucose
BGM: blood glucose meters
CGM: continuous glucose monitors
GDM: gestational diabetes mellitus
PwGDM: people with gestational diabetes mellitus
RIR: readings in range
TIR: time in range
The supplementary materials for this article are available at: https://www.explorationpub.com/uploads/Article/file/101414_sup_1.pdf. The supplementary tables for this article are available at: https://www.explorationpub.com/uploads/Article/file/101414_sup_2.pdf.
Support for this study and manuscript was provided by LifeScan Inc, Malvern, PA 19355 USA.
MG and EH: Writing—original draft, Writing—review & editing. HC: Formal analysis, Writing—review & editing.
MG, HC, and EH are all current employees of LifeScan.
Users who downloaded the app were informed about personal data processing per the privacy policy and provided explicit consent for the use of de-identified data for analytics, research, and product development. No additional ethics committee approval was required, and no clinical sites or external investigators were involved.
Users provided consent for LifeScan to utilize their deidentified data during the app registration process per our privacy policy (https://onetouchreveal.com/content/en_US/privacy).
Not applicable.
The data is available from the corresponding author upon reasonable request.
Not applicable.
© The Author(s) 2024.
Copyright: © The Author(s) 2024. This is an Open Access article licensed under a Creative Commons Attribution 4.0 International License (https://creativecommons.org/licenses/by/4.0/), which permits unrestricted use, sharing, adaptation, distribution and reproduction in any medium or format, for any purpose, even commercially, as long as you give appropriate credit to the original author(s) and the source, provide a link to the Creative Commons license, and indicate if changes were made.

View: 7019
Download: 141
Times Cited: 0
