 Original Article

Affiliation:
1Laboratory of Organic Chemistry, School of Chemical Engineering, Aristotle University of Thessaloniki, 54124 Thessaloniki, Greece
2Natural Products Research Centre of Excellence (NatPro-AUTH), Center for Interdisciplinary Research and Innovation of Aristotle University of Thessaloniki (CIRI-AUTh), 57001 Thessaloniki, Greece
Affiliation:
3Laboratory of Analytical Chemistry, School of Chemical Engineering, Aristotle University of Thessaloniki, 54124 Thessaloniki, Greece
4Center for Bioanalysis & Omics (BIOMIC_AUTH), Center for Interdisciplinary Research and Innovation of Aristotle University of Thessaloniki (CIRI-AUTh), 57001 Thessaloniki, Greece
ORCID: https://orcid.org/0000-0002-5900-1011
Affiliation:
5Asty Wine, 54248 Thessaloniki, Greece
Affiliation:
5Asty Wine, 54248 Thessaloniki, Greece
Affiliation:
1Laboratory of Organic Chemistry, School of Chemical Engineering, Aristotle University of Thessaloniki, 54124 Thessaloniki, Greece
2Natural Products Research Centre of Excellence (NatPro-AUTH), Center for Interdisciplinary Research and Innovation of Aristotle University of Thessaloniki (CIRI-AUTh), 57001 Thessaloniki, Greece
Email: adreana@cheng.auth.gr
ORCID: https://orcid.org/0000-0002-2833-2694
Explor Foods Foodomics. 2024;2:497–524 DOI: https://doi.org/10.37349/eff.2024.00048
Received: April 07, 2024 Accepted: July 13, 2024 Published: August 29, 2024
Academic Editor: Nives Ogrinc, Jožef Stefan International Postgraduate School and Jožef Stefan Institute, Slovenia
The article belongs to the special issue Metrological Aspects in the Analysis of Nutrients, Functional Compounds, Additives and Contaminants in Food and Feed
Aim: Three factors that affect the chemical composition and perceptible aroma of Retsina—a distinguished Greek wine, crafted by infusing resin harvested from the Aleppo pine (Pinus halepensis Mill.) into the fermentation process of white or rosé wines—were studied: i) the pine forest altitude (resins were harvested from two distinct forests), ii) the resins’ tapping method (two tapping methods were implemented; a conventional one using a paste of sulfuric acid on the pine trunk as an irritating stimulant, and a natural method by not using any chemical stimulant) and iii) the duration of resin extraction in the must (a short and a long extraction time were investigated).
Methods: To study these three factors and their respective interactions, nine vinification protocols were carried out. Must and wine samples were collected at different time points during fermentation, maturation and after bottling, and analyzed by both headspace SPME-GC-MS and RP-LC-TIMS-TOF MS techniques. The findings of the chemical analyses were subsequently correlated with those of sensory analysis conducted.
Results: In the case of pine resins harvested using the natural method, neither the forest microclimate, nor the employed duration of resin extraction in the must seem to affect the intensity of the oily character in the wine, which remains at low levels. On the other hand, the results showed that when pine resin is harvested by the conventional method, longer contact times release heavier and more oily aromas into the must.
Conclusions: In the case of pine resin collected using the natural method, the extraction time in the wine must and the choice of the harvesting area of the resin do not constitute a factor of quality for the produced wine, but rather a matter of style, in contrast to conventionally harvested resin, where these factors are critical for the resulted quality.
Retsina, a distinguished Greek wine, is meticulously crafted by infusing natural resin harvested from the Aleppo pine (Pinus halepensis Mill.) into the fermentation process of white or rosé wines. Its production is governed by strict regulations, earning it a coveted Traditional Designation, a recognition within Greek [1] and European [2] legislation for wines produced exclusively in the geographical territory of Greece [“appellation traditionnelle”, Commission Regulation (EC) No 1308/2013].
Retsina boasts a rich heritage that spans over four millennia [3, 4], with its unique flavor rooted in the ancient tradition of preserving wine in vessels, notably amphorae, through the addition of pine resin [3, 5–8]. In Historia naturalis, Pliny the Elder (23–79 AD) describes the addition of resin as the optimum method to avert the transformation of wine into vinegar [9]. Apart from eliminating the effect of oxygen, preserving the wine [6, 7, 9, 10], there is also strong evidence that pine resin was utilized as an internal waterproofing layer of the amphorae [5–7], employed at the time for the transportation of wine all across the Mediterranean Sea. Gradually, resin infusions became the standard technique for suppressing unpleasant flavors and odors from the containers [4, 7, 10], with resinated wine eventually evolving to a popular drink due to its unique taste [7].
While this historic practice once graced civilizations surrounding the eastern Mediterranean Sea, its contemporary rendition thrives exclusively in Greece [9–12]. Specifically, Retsina wines in Greece undergo a unique production process involving the addition of resin from pine trees up to ~1% (w/v) during alcoholic fermentation [1, 13]. This resin not only imparts distinct taste to the wine, but also contains esters of benzoic, salicylic, and cinnamic acids, potentially elevating the phenolic levels of the resulting wine [13]. After fermentation concludes, the wine undergoes a meticulous racking process to remove any resin and other solid residues from fermentation, according to the standard white or rosé wine vinification process [12]. The alcohol content of Retsina wines should be kept between 10.0% and 13.5% (v/v) [1], but typically hovers around 12.0–12.5% (v/v) [12]. The key grape varieties in Retsina production are Savvatiano (Savatiano), Rhoditis (Roditis), Athiri and Assyrtiko (Asyrtiko) [1, 10, 12].
Savatiano is a white grape, well-suited for arid climates [10]. Grown in large quantities [14], particularly in Central Greece, it produces a low-acid, well-structured wine, suitable for Retsina production [10]. On the other hand, Roditis is a reddish grape with a variety of clones, grown mainly in Attica and the northern Peloponnese [10]. It is one of the most planted varieties in Greece and is being exploited for the production of rosé wines [10], which are characterized by citrus, pineapple, melon, banana and white flower aromas. As for the Assyrtiko variety, it is considered to have originated from the volcanic island of Santorini [15]. Assyrtiko wine has been characterized by fruity (citrus and tropical fruits) and mineral aromas, or by earthy, mushroom, nutty and honeylike aromas developed through ageing [15, 16].
The production of Retsina is influenced by several key factors. Beyond the confines of vineyards and wineries [10, 12, 15], the quality of the resin employed, including the tapping method and location of resin, assumes paramount importance. Natural tapping involves making incisions in the tree without the use of stimulants [17, 18], while acid stimulation involves the application of substances like sulfuric acid to enhance resin flow (conventional method) [19–21]. The choice between these methods can influence the flavor, aroma, and overall quality of the resin, thereby affecting the final Retsina product. Similarly, resin collected at different locations may exhibit variations in aroma, flavor, and chemical composition due to climate, temperature [21] and soil composition differences [22]. The duration of contact between the resin and the wine during the winemaking process plays a crucial role in determining the intensity of the pine resin’s flavor and aroma in Retsina. Longer contact times can lead to a more pronounced resin character, while shorter contact times may result in a subtler influence. Properly managing contact time ensures that the resin integrates well with the wine, enhancing its complexity without overpowering other flavors, while consistent contact times are important for maintaining a standardized quality in Retsina production.
The addition of pine resin significantly influences both the color and the taste of the resulting wine, elevating phenolic levels with compounds such as tyrosol, gallic acid, (−)-epicatechin, p-coumaric acid and (+)-catechin [13]. The resin tapped from P. halepensis stands out as the preferred choice due to its characteristic aroma compounds, including mainly the terpenes α-pinene, β-pinene, myrcene, 3-δ-carene, and β-caryophyllene [23, 24], followed by a number of other terpenoids, such as limonene, camphene, sabinene, α-terpinene, γ-terpinene, terpinolene, humulene (α-caryophyllene), longifolene, santene, bornyl acetate and γ-terpineol [23, 24]. Retsina appears to be fairly rich in benzaldehyde (bitter almond taste), 1-octanol, α-terpineol, terpinen-4-ol and certain polyoxygenated terpenes [25]. There are also some intriguing findings in the literature, indicating that selected phenolic compounds in wines influence the volatility and sensory perception of the aromatic components [11].
P. halepensis (Mill.) belongs to the Pinaceae family, which includes about 250 species [23, 26]. It is the largest genus of conifers found naturally in the Mediterranean region, in Asia, the Caribbean and in North and Central America [23, 26, 27]. With needle-like gray-green leaves that grow in pairs, these evergreen and resinous trees can reach heights of 3 meters to 80 meters [27]. In Greece, P. halepensis is found in Central Greece, Peloponnesus, Euboea, Sporades, Ionian islands and in the peninsula of Chalkidiki [23].
In pine trees, resin is generated and congregated in large quantities in all tissues (stems, roots, branches, needles, and cones) [21]. This viscous secretion consists of approximately equal parts of volatile turpentine (mono- and sesquiterpenoids) and rosin (primarily diterpenoid acids) [28, 29]. When resin canals are wounded, the amassed resin flows out [21]. This reaction is believed to be part of a sophisticated defense mechanism to thwart herbivore and pathogen invasion. Upon injury, the bark beetles and their symbiotic fungal pathogens are killed, coated in resin, and eternally banished [28]. Eventually, in the presence of air, the volatile turpentine evaporates, leaving behind a semi-crystalline mass of resin acids, which forms a protective barrier that keeps insects and pathogens out of the wound [21, 29].
In ancient Egypt, resin was employed both in medicine and in mummification processes [21]. In traditional medicine, P. halepensis resin has been utilized as a treatment source for respiratory and urinary disorders, as well as an antimicrobial, analgesic, anti-inflammatory and wound healing agent [30]. The lipophilic extractives of P. halepensis (mainly resin acids) still have pharmacological, cosmetics and culinary applications [31], while the hydrophilic fractions (predominantly polyphenols) possess antioxidant, antimicrobial, antiviral, anticarcinogenic, cardioprotective, hepatoprotective and neuroprotective properties [13, 30, 31].
As the union of wine and resin, Retsina encapsulates a harmonious blend of tradition and innovation, with each element—from the choice of pine tree species and resin tapping method, to the meticulous winemaking process—contributing to its distinctive flavor, aroma, and overall quality. In the present study, we investigate how the chemical composition and perceptible aroma of Greek Retsina is affected by the three following factors: i) the pine forest location (microclimate), ii) the type of practice employed for the tapping of resin and iii) the resin extraction time in the must. To study these three factors and their respective interactions, nine vinification protocols were carried out. For this, must samples were collected at different time points during fermentation and analyzed by both headspace (HS) solid phase microextraction (SPME)-GC-MS and reversed-phase liquid chromatography-trapped ion mobility spectrometry-time-of-flight mass spectrometry (RP-LC-TIMS-TOF MS) techniques. The findings of the chemical analyses were eventually correlated with the results of parallel sensory analysis.
Sodium chloride (NaCl) and liquid chromatography-mass spectrometry (LC-MS) grade methanol (MeOH) were purchased from Chem-Lab NV (Zedelgem, Belgium). MS grade n-hexane was purchased from Merck KGaA (Darmstadt, Germany). Formic acid (≥ 99%), LC-MS additive, was obtained from Panreac Química SLU (Barcelona, Spain). Ultra-pure water with 18.2 MΩ × cm electrical resistivity was produced from a Milli-Q® water purification system (Millipore, Bedford, MA, USA). Fluorobenzene solution 1,000 μg/mL in MeOH (used as internal standard) and a mixture of C7–C30 n-alkanes in hexane (1,000 μg/mL) were purchased from Sigma-Aldrich (Darmstadt, Germany). The gas chromatography-mass spectrometry (GC-MS) reference standards (+)-α-pinene, (–)-α-pinene, R-(+)-limonene, S-(–)-limonene, α-terpinolene, linalool, sabinene, estragole, β-caryophyllene and thymol were purchased from CPAchem (Stara Zagora, Bulgaria); camphene was purchased from HPC Standards GmbH (Cunnersdorf, Germany); p-cymene, 1,8-cineole, α-terpineol, γ-terpinene, linalyl acetate, terpinen-4-ol and carvacrol were purchased from Sigma-Aldrich (Darmstadt, Germany). All other used standards were of analytical or higher grade, and for this study, obtained from various vendors.
The resins used in this work were sourced from two different locations (microclimate A of low altitude and microclimate B of high altitude) and collected from May until the end of August of 2022, using, or not, a stimulant paste of sulfuric acid supplied by the Directorate General of Forests and Forest Environment according to the relevant regulation [32]. The resin of P. halepensis species was harvested by making a horizontal groove on their trunk and by applying on half of them the stimulant paste of sulfuric acid (conventional procedure), in order to irritate the vacuoles and accelerate the flow of the resin.
The vinification process started in early September. After harvest, Assyrtiko grapes were brought to the winery where they were stored for one day at low temperature. The winemaking was based on the typical white wine vinification process where the first step was destemming, followed by skin-contact maceration for eight hours at low temperature and settling, before adding selected yeasts in barrels to start the alcoholic fermentation. After that, selected pine resins were added in the barrels for a specific duration depending on the corresponding research protocol. The vinification process was completed after aging on lees for six months in 225 L French and American barrels, followed by wine stabilization, filtration and eventually, bottling.
The effect of resins on the aromatic and phenolic profile of the final product (resinated wine) was studied by investigating the following three parameters:
1. The location of the pine forest (P. halepensis species): the resins were sourced from two different microclimates (microclimate A of low altitude and microclimate B of high altitude).
2. The method applied for the collection of pine resins: two different methods were used; one where a stimulant paste of sulfuric acid was applied on the trunk (conventional method) and one where no stimulant paste was applied (natural method).
3. The duration of resin extraction in the wine must during alcoholic fermentation: two different extraction periods where used; one short and one long.
The above parameters resulted in eight different vinification protocols by combining the different microclimates with the collection methods and the resin extraction times in the must (23 combinations). A ninth protocol was used as the control protocol (wine vinified without resin). The resulted protocols are shown in Table 1. Each protocol was replicated in five different barrels.
List of vinification protocols and their corresponding parameters under investigation
| Protocol | Factor A | Factor B | Factor C |
|---|---|---|---|
| Microclimate (altitude) | Tapping method | Extraction time | |
| PR01 | A (low) | Natural | Short |
| PR02 | A (low) | Natural | Long |
| PR03 | A (low) | Conventional | Short |
| PR04 | A (low) | Conventional | Long |
| PR05 | B (high) | Natural | Short |
| PR06 | B (high) | Natural | Long |
| PR07 | B (high) | Conventional | Short |
| PR08 | B (high) | Conventional | Long |
| PR09 | - | - | - |
Sampling of must and wine was conducted five times during the vinification process of Retsina at the following time points: i) at an intermediate point of the fermentation process (stage a), ii) at the end of fermentation process (stage b), iii) at the end of maturation process (stage c), iv) after three months of aging (stage 3M) and v) after six months of aging (stage 6M). In total, 54 samples were collected during alcoholic fermentation (including duplicates) at three different time points (n = 18 for each time point) and another 18 samples were collected three months (n = 9) and six months (n = 9) after bottling of Retsina wine. Samples were stored in 500 mL aliquots at –20°C until analysis.
Must and wine samples were stored at –20oC immediately after collection to pause any metabolic activity and were thawed just before their analysis. Sample preparation was done by pipetting 8 mL of wine/must in a 20 mL autosampler HS vial with 4 g of NaCl (to increase analytes’ concentration), and adding 20 μL of 40 μg/mL fluorobenzene in MeOH (by properly diluting an amount from the stock solution), resulting in a final concentration of 100 parts per billion (ppb) in internal standard. The vials were sealed with polytetrafluoroethylene (PTFE)/silicone septum magnetic caps and vortexed for 15 s. Α pooled QC (Quality Control) stock sample was prepared by mixing equal volumes (8 mL) from every wine/must sample. QC samples were treated like real samples and were being injected every 10 runs. Resins, which were initially stored at –20oC, were also thawed just before their analysis. For each sample, a quantity of 30 mg was transported into a 20 mL HS vial, which was sealed with a PTFE/silicone septum magnetic cap. Reference standards were diluted in various concentration using MS grade MeOH.
HS SPME-GC-MS analysis of resins, musts and wines was performed using an EVOQ GC-TQ Bruker triple quadrupole system (Bruker Daltonics, Bremen, Germany) with a CTC-PAL autosampler (CTC Analytics AG, Zwingen, Switzerland). The chromatographic separation was carried out on an HP-INNOWAX (30 m × 0.25 mm × 0.25 μm) high polarity column (Agilent Technologies, Santa Clara, CA, USA).
Adsorption of volatile compounds was performed by exposing a 24 Ga divinylbenzene/carboxen/polydimethylsiloxane (DVB/CAR/PDMS) (50 μm divinylbenzene, 30 μm carboxen/polydimethylsiloxane) SPME fiber (Supelco Analytical, Bellefonte, PA) to the HS above the sample surface, at a depth of 25 mm inside the vial, for 30 min at 40°C with concurrent agitation. Prior to exposure, each sample was incubated at the aforementioned temperature for 10 min to reach the new equilibrium.
Following the adsorption stage, the fiber was guided to the chromatograph’s inlet, where desorption was carried out for 15 min at 230°C. Every five wine/must samples—or after a resin sample—the fiber was being conditioned at 270°C. Every 10 runs, a QC sample was being injected to assess the stability of the analytical system. Blank runs were also implemented to expose possible carryover. All original samples were analyzed in a randomized order.
Helium (99.999%) was used as carrier gas with a steady flow rate of 1 mL/min. Inlet temperature was set at 230°C. The initial oven temperature was set at 50°C, where it remained for 1 min, then increased with a 3°C/min rate to 70°C, held there for 1 min, then raised to 150°C at a pace of 3°C/min, and eventually increased with a 5°C/min rate to reach the maximum temperature of 230°C, where it remained for 4 min.
Fragmentation was performed by applying electron impact (EI) ionization at 70 eV. The ion source and MS transfer line temperatures were kept at 230°C and 250°C, respectively. Full scan spectra were acquired from 33 atomic mass unit (amu) to 400 amu, with a 250 ms scan time. For wine and must samples, injections were performed in splitless mode and MS spectra were being recorded from the very first second. In the case of resins, a split ratio of 1:10 was determined as the most appropriate, while a collection delay of 3.1 min was set, due to the overwhelming signal of α-pinene.
All samples were thawed in room temperature. They were centrifuged in 14,000 rpm for 10 min and 100 μL of the supernatant were diluted in 300 μL of water. They were finally filtered by 0.22 μm PTFE syringe filters and placed into 2 mL amber LC-MS glass vials. QC samples were produced by mixing equal volumes of each sample.
Chromatography was performed on an Ultra HPLC Elute system equipped with an Elute autosampler (Bruker, Billerica, MA, USA), thermostated at 4°C. Separation was performed with an ACQUITY HSS T3 (2.1 mm × 100 mm) column (Waters Ltd., Elstree, UK) at 40°C. The mobile phases consisted of water with 0.1% v/v formic acid (mobile phase A) and MeOH (mobile phase B), the flow rate was kept constant during analysis at 0.35 mL/min and injection volume was 5 μL. The gradient was as follows: 0% of B for 1.5 min; then 0–10% of B (1.5–4 min); 10–40% of B (4–8 min); 40–100% of B (8–12 min); 100% of B kept for 2 min (until 14 min of gradient); then reached the initial conditions of 100% of A (14–17 min), where it was kept stable until equilibration (2 min).
Mass spectrometer analysis was performed on the trapped ion-mobility time-of-flight (timsTOF) mass spectrometry system (Bruker, Bremen, Germany) and the MS data were acquired in negative [electrospray ionization (ESI)−] ionization mode in a mass range of 20–1,300 amu. Tuning parameters included capillary voltage at –4,500 V, dry gas 10 L/min, dry temperature at 200°C and nebulizer gas 2 Bar. For optimum ion transfer, funnel RF 1, funnel RF 2 and multipole RF were set at 200 Vpp, 250 Vpp, and 200 Vpp, respectively. Deflection delta was set at 60 V, transfer time at 54 µs, and pre-pulse storage at 5 µs. Collision energy and RF were set to 10 eV and 800 Vpp, respectively. Samples were analyzed using a data-dependent acquisition mode by applying acquisition frequency of 3 (min) and 5 (max) Hz and number of maximum precursor ions was set to 3. Fragmentation was performed with a collision energy of 30 eV for all precursor ions. System recalibration was performed for each injection by calibrant infusion (sodium formate 10 mM) during the second segment of the analysis.
Before each analysis, blank samples of H2O were injected into the system to assess system suitability. QCs were analyzed at the beginning, after every 10 samples and at the end of analysis, in order to equilibrate the system and assess its stability during analysis.
GC-MS data were initially handled using the MSWS 8 data process software (Bruker Daltonics, Billerica, MA, USA). Spectral deconvolution and peak integration was fulfilled using the GNU LGPL software MS-DIAL (v. 4.48, RIKEN Center for Integrative Medical Sciences, Yokohama, Japan). Peak identification was performed utilizing the NIST17 Mass Spectral Library (mainlib and replib EI Databases), by referring to available analytical standards retention times and mass spectra and comparing the results to the existing literature. To achieve this, the non-isothermal Kovats retention indices (RI) of the emerging peaks were calculated based on the homologous series of a C7–C30 n-alkanes mixture, though the following equation:
where tx is the retention time of compound “x”, while tn and tn + 1 are the retention times of the reference n-alkane eluting immediately before and after the chemical compound “x” (i.e., hydrocarbon “n” and “n + 1”, respectively).
Multivariate and univariate statistical analyses, as well as interpretation and visualization of data, were performed utilizing both the software package SIMCA-P® (v. 13.0.2, MKS Umetrics AB, Malmö, Sweden) and the web-based platform MetaboAnalyst (https://www.metaboanalyst.ca). Statistical significance of the differentiation between groups for the univariate approach was assessed by employing Student’s t-tests, considering a P-value < 0.05 as statistically significant. Partial least squares-discriminant analysis (PLS-DA) performed in multivariate statistics was validated through permutation plots and coefficient of variation-analysis of variance (CV-ANOVA) values.
LC-MS data were collected both as profile and centroid spectra. Initially, raw data recalibration was performed manually using Data Analysis software (Bruker Daltonics, Bremen, Germany) and clusters of sodium formate. MSConvert (ProteoWizard v. 3.0.11567) online available free software was used for the conversion of the recalibrated centroid data to .mzML files that were further treated with XCMS (v. 3.2.0) under R programming language. Peak detection was performed using CentWave algorithm, while for peak grouping, the peakDensity algorithm was utilized. Resulted data were further filtered out and only features present in 80% of the QCs and with CV < 30% were further processed and were assessed through statistical SIMCA-P® software (v. 13.0.2, MKS Umetrics AB, Malmö, Sweden) and other chemometric tools including the MetaboAnalyst online platform (https://www.metaboanalyst.ca), version 5.0. Data were assessed for normal distribution based on D’Agostino-Pearson statistical test. Two-tailed t-test, with unequal variance and a threshold of P < 0.05, was performed. Area under the curve-receiver operating characteristic (AUC-ROC) values were collected and box plots were illustrated for the significant phenols, while the logarithm base two of fold change (Log2FC) were calculated as the ratio of the final value over the initial value. Principal components analysis (PCA) and orthogonal projection to latent structures discriminant analysis (OPLS-DA) were performed to assess data in a multivariate setting.
Results from DDA (data dependent acquisition) experiments were used for the annotation of polyphenols. For metabolite structure assignment, accurate m/z measurements were first matched to metabolites from online MS databases (Metlin, HMDB and Lipidmaps). After an assessment of the retention time and isotopic pattern, tandem MS fragmentation pattern (from DDA, MS/MS experiments) was employed for further structural elucidation; spectra were compared with those from an in-house library, online available databases and literature (where available). Assignment according to fragmentation pattern was dependent on the ability to obtain spectra with adequate signal. Based on the identification level system of metabolites from untargeted analysis identification, “Level 1” and “Level 2” was reached for most of the ions [33].
The sensory analysis was carried out regularly over the experimental period by a panel of three professionals with specialized skills on wine tasting. The horizontal blind tasting method was selected as it enables the comparison between wines of the same year.
The winetasting form included all the appropriate steps of the sensory analysis: appearance, nose, palate. In addition, specific aromas related to the resin were noted on the winetasting form to help tasters to focus on them: i) fresh pine (mastic/lime/pine), ii) herbal and iii) oily character. The tasters filled out the forms according to the quantitative descriptive tests: each organoleptic characteristic was rated on a scale of 1 (least intense) to 5 (most intense). In this way, a unique organoleptic profile was obtained for each sample/protocol.
Four P. halepensis resins were used throughout this investigation. These resins originated from two distinct forests and were acquired by two different tapping methods (2 × 2 = 4 permutations). In each forest, half of the trees were tapped by the conventional method (i.e., using a paste of sulfuric acid as irritating stimulant), whereas the other half was harvested following the natural approach (solely by cautiously wounding the bark of the tree).
Although the investigation of resins’ composition was not the object of this study, identifying the most prominent constituents of these samples is a necessity, in order to determine which components of Retsina’s volatilome are primarily of resin origin. For this, samples of the four different resins were analyzed with a HS SPME-GC-MS method which was practically identical to the one developed for Retsina samples. The detected compounds, along with their respected identification methods, are presented in Table 2.
Compounds identified in P. halepensis resin samples by HS SPME-GC-MS. Constituents that were also found in Retsina samples (analyzed with the same method) are denoted in bold
| Compound | RT (min) | RI experimental (Kovats) | RI NIST (polar)※ | Identification method |
|---|---|---|---|---|
| α-Pinene | 2.75 | 1,007 | 1,028 ± 8 | MS, RI, RS |
| Camphene | 3.25 | 1,046 | 1,071 ± 8 | MS, RI, RS |
| β-Pinene | 3.74 | 1,084 | 1,112 ± 7 | MS, RI |
| Sabinene (tr.)‡ | 3.93 | 1,098 | 1,124 ± 8 | MS, RI, RS |
| 3-Carene | 4.45 | 1,124 | 1,147 ± 7 | MS, RI |
| β-Myrcene | 4.79 | 1,140 | 1,161 ± 7 | MS, RI |
| 1,4-Cineole (tr.)‡ | 5.07 | 1,154 | 1,185 ± 8 | MS, RI |
| Limonene | 5.47 | 1,173 | 1,200 ± 7 | MS, RI, RS |
| β-Phellandrene | 5.62 | 1,180 | 1,211 ± 7 | MS, RI |
| 1,8-Cineole (eucalyptol) | 5.63 | 1,181 | 1,213 ± 9 | MS, RI, RS |
| Cis-β-ocimene | 6.31 | 1,209 | 1,235 ± 8 | MS, RI |
| γ-Terpinene | 6.50 | 1,216 | 1,246 ± 9 | MS, RI, RS |
| Trans-β-ocimene | 6.78 | 1,225 | 1,250 ± 6 | MS, RI |
| p-Cymene | 7.13 | 1,237 | 1,275 ± 9 | MS, RI, RS |
| α-Terpinolene | 7.46 | 1,249 | 1,283 ± 7 | MS, RI, RS |
| 2-Nonanone | 11.39 | 1,366 | 1,390 ± 7 | MS, RI |
| Cyclosativene | 14.27 | 1,443 | 1,491 ± 6 | MS, RI |
| α-Copaene | 14.86 | 1,459 | 1,492 ± 7 | MS, RI |
| 2-Nonanol | 16.63 | 1,506 | 1,521 ± 11 | MS, RI |
| Linalool (tr.)‡ | 17.69 | 1,534 | 1,547 ± 7 | MS, RI, RS |
| Fenchol (tr.)‡ | 18.52 | 1,555 | 1,582 ± 9 | MS, RI |
| β-Caryophyllene | 18.63 | 1,558 | 1,595 ± 16 | MS, RI, RS |
| Terpinen-4-ol | 19.22 | 1,573 | 1,602 ± 9 | MS, RI, RS |
| 2-Undecanone | 19.35 | 1,577 | 1,598 ± 6 | MS, RI |
| Trans-pinocarveol | 20.85 | 1,624 | 1,664 ± 7 | MS, RI |
| α-Caryophyllene | 21.12 | 1,634 | 1,667 ± 14 | MS, RI |
| Estragole | 21.43 | 1,645 | 1,670 ± 12 | MS, RI, RS |
| γ-Muurolene | 21.93 | 1,664 | 1,692 ± 12 | MS, RI |
| Trans-verbenol | 21.95 | 1,665 | 1,683 ± 4 | MS, RI |
| Endo-borneol | 22.62 | 1,690 | 1,702 ± 15 | MS, RI |
| D-germacrene | 22.63 | 1,691 | 1,710 ± 14 | MS, RI |
| α-Terpineol | 22.83 | 1,698 | 1,697 ± 10 | MS, RI, RS |
| α-Muurolene | 23.38 | 1,713 | 1,726 ± 12 | MS, RI |
| δ-Cadinene | 24.37 | 1,739 | 1,758 ± 13 | MS, RI |
| Myrtenol | 25.86 | 1,778 | 1,796 ± 8 | MS, RI |
| Trans-carveol | 27.61 | > 1,800# | 1,845 ± 9 | MS, RI |
| Cymen-8-ol | 28.04 | > 1,800 | 1,850 ± 16 | MS, RI |
| Caryophyllene oxide | 31.78 | > 1,800 | 1,989 ± 19 | MS, RI |
| Methyl eugenol | 33.51 | > 1,800 | 2,013 ± 16 | MS, RI |
| Copaborneol | 37.88 | > 1,800 | 2,175 ± 28 | MS, RI |
※: retention indices for polar columns according to NIST17 Mass Spectral Library; ‡: traces (barely detectable peaks); #: C18 was the last detectable n-alkane (26.72 min); RT: retention time; MS: mass spectrum; RI: retention indices (Kovats); RS: reference standard
In summary, 40 compounds were identified in the volatile fraction of resin samples. In all cases, the most prominent constituent was by far the monoterpene α-pinene. The concentration of α-pinene in the HS above the resin samples was so overwhelming, that a collection delay was necessarily applied. The most significant components—besides α-pinene—were the monocyclic monoterpenes limonene, α-terpinolene and β-phellandrene, the acyclic monoterpene β-myrcene, the bicyclic monoterpenes camphene, β-pinene and 3-carene, the bicyclic sesquiterpenes α-caryophyllene, β-caryophyllene and α-muurolene, the tricyclic sesquiterpene α-copaene and the oxygenated monocyclic monoterpenoids estragole and α-terpineol (Table S1 and Figure S1). A typical resin chromatogram is displayed on Figure S2.
In total, 73 samples were collected throughout the fermentation, maturation, and aging process. Detailed explanation of sample codes and the corresponding vinification protocols can be found in Table 1. The applied HS SPME-GC-MS method revealed the existence of at least 51 constituents in the volatile fraction of Retsina samples. Out of the 51, 19 compounds are commonly found either exclusively in resins, or in both resins and wine/must (Table 2), while the rest are well-documented [10, 12, 14, 16, 34–39] products of the fermentation and aging process of wine (Table S2).
Briefly, 19 of the 40 components found in P. halepensis resins were also detected in the volatile fraction of Retsina samples, which were strategically collected throughout the vinification process. The integration results for these 19 peaks for all samples are available in Table S3a–h. In most cases, the predominant volatile molecule of resin origin was α-terpineol, a sweet-floral pine-woody odoriferous oxygenated monoterpenoid. The majority of samples were also relatively rich in endo-borneol, fenchol and 2-nonanol, while an intriguing fluctuation was observed for the case of α-pinene—the predominant constituent of P. halepensis resins—over time. A chromatogram of a Retsina QC sample is displayed on Figure S3.
One of the objectives of the present study was the assessment of the (poly)phenols detected in must and Retsina wine and their correlation with the resin and vinification process. We mainly focus on selected phenolic compounds that are commonly detected in plants, including resins from P. halepensis and are largely found in grape, grape musts and wines (Table 3).
Annotated polyphenols from DDA experiments
| m/z experimental | m/z theoretical | Accuracy (ppm) | Monoisotopic mass | RT(min) | Annotations | Level※ |
|---|---|---|---|---|---|---|
| 386.0415 | 386.0406 | 2 | 387.0406 | 1.1 | Glutathione S-sulfonate | 2 |
| 306.0784 | 306.0838 | 18 | 307.0838 | 1.4 | Glutathione | 1 |
| 169.0192 | 169.0210 | 11 | 170.0215 | 3.7 | Gallic acid | 1 |
| 369.0374 | 369.0358 | 4 | 370.0358 | 4.0 | Epicatechin-4β-sulfonates | 2 |
| 305.0672 | 305.0730 | 19 | 306.0740 | 5.7 | Gallocatechin | 1 |
| 457.0863 | 457.0849 | 3 | 458.0849 | 6.0 | Epigallocatechin gallate | 1 |
| 311.0451 | 311.0481 | 10 | 312.0481 | 6.3 | Caftaric acid | 1 |
| 289.0736 | 289.0790 | 19 | 290.0790 | 7.1 | Catechin | 1 |
| 179.0405 | 179.0422 | 9 | 180.0422 | 8.0 | Caffeic acid | 1 |
| 289.0736 | 289.0790 | 19 | 290.0790 | 8.1 | Epicatechin | 1 |
| 463.0987 | 463.0954 | 7 | 464.0955 | 9.9 | Quercetin 3-glucoside | 1 |
| 287.0593 | 287.0633 | 14 | 288.0634 | 9.9 | Dihydrokaempferol | 1 |
| 300.9991 | 301.0062 | 24 | 302.0063 | 10.1 | Ellagic acid | 1 |
| 447.0996 | 447.1005 | 2 | 448.1006 | 10.2 | Kaempferol 3-glucoside | 1 |
| 207.0696 | 207.0735 | 19 | 208.0736 | 10.6 | Ethyl caffeate | 1 |
| 301.0385 | 301.0426 | 14 | 302.0427 | 10.7 | Quercetin | 1 |
| 285.0427 | 285.0477 | 18 | 286.0477 | 11.1 | Kaempferol | 1 |
| 315.0522 | 315.0580 | 18 | 316.0583 | 11.2 | Isorhamnetin | 1 |
※: level of annotation [33]; ppm: parts per million; DDA: data dependent acquisition; RT: retention time
Metabolite annotation was performed manually by comparing retention times and mass spectra to those of the standard, when available. With this approach it was possible to tentatively identify 18 well‐known wine and plant polyphenols (Table 3), previously annotated using the same protocol and therefore under the same conditions of the experiment (i.e., targeted compounds). Additionally, the accurate m/z values were annotated using online available MS databases (Metlin and HMDB). The identification was in accordance with the four levels annotation [33]. Among phenols, glutathione was also studied due to its important role on protecting the aromatic volatile compounds, polyphenols and the color attributes, thus contributing significantly to the quality of the finished product. A representative LC-MS chromatogram from each stage of the vinification is shown in Figure S4.
The untreated data of the HS SPME-GC-MS integrations for the 19 constituents of resin origin, for all vinification protocols, are shown in Tables S3a–h. One way to visualize these data to uncover potent trends in the dimension of time, is through Figure S5. The samples from protocols 1–8 have been split into five groups according to corresponding vinification stages (a, b, c, 3M, 6M). The boxplots in Figure S5 comprehend the integrations for all 19 compounds of interest in these samples. To fit all these data of different magnitudes in a unified chart for further evaluation, the mean value of each individual component was subtracted from the initial integrations, and the results were divided by the respective standard deviation (SD). This conversion (zero-mean univariate transformation) does not alter the initial correlation among samples for each individual peak. The transformed data show the number of SDs the initial values are apart from the respective mean. Positive values correspond to integrations greater than the mean, whereas integrations smaller than the mean are represented by negative values.
A closer examination of Figure S5 reveals three main trends in the course of vinification process. First, there are three components (2-nonanone, fenchol and endo-borneol), whose amount is constantly increasing over time, with a tendency to stabilize after the maturation stage (Figure 1). Secondly, there is the group of compounds α-pinene, β-myrcene, limonene, p-cymene, α-terpinolene, α-copaene, linalool, β-caryophyllene, terpinen-4-ol and myrtenol, whose abundance reaches the maximum when the resin is still in contact with the must (primarily at stage a) and gradually decreases with the removal of resin and the course of time (Figure 2). Finally, there is a third group, consisting of the compounds camphene, 1,4-cineole, γ-terpinene, 2-nonanol, estragole and α-terpineol. In this case, the concentration typically rises until the maturation phase and then drops at the levels of stage “a”, after bottling (Figure 3).
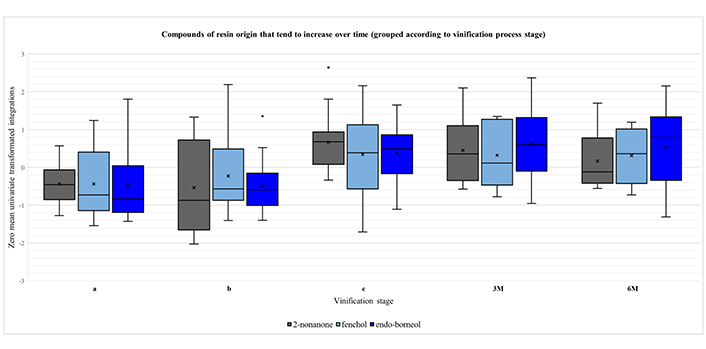
Boxplots for the compounds of resin origin that tend to increase over time, grouped according to vinification process stage: i) intermediate point of fermentation (a); ii) end of fermentation (b); iii) end of maturation (c); iv) three months of aging (3M); and v) six months of aging (6M). A zero-mean univariate transformation has been applied to fit data of different magnitude in a unified chart. In each boxplot, the five whiskers correspond to Q0, Q1, Q2, Q3 and Q4 quartiles. The mean value is depicted with an “x” mark. Outliers are shown as dots outside of the corresponding boxes
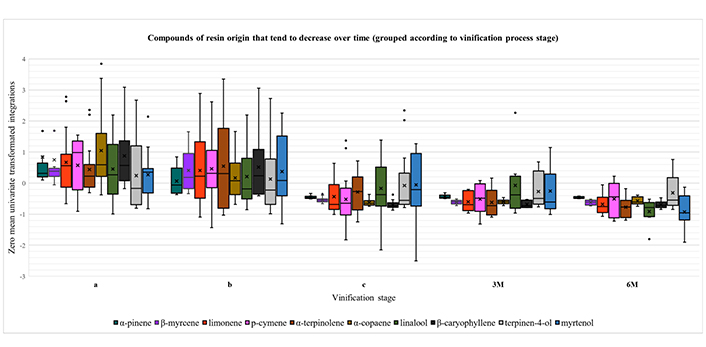
Boxplots for the compounds of resin origin that tend to decrease over time, grouped according to vinification process stage: i) intermediate point of fermentation (a); ii) end of fermentation (b); iii) end of maturation (c); iv) three months of aging (3M); and v) six months of aging (6M). A zero-mean univariate transformation has been applied to fit data of different magnitude in a unified chart. In each boxplot, the five whiskers correspond to Q0, Q1, Q2, Q3 and Q4 quartiles. The mean value is depicted with an “x” mark. Outliers are shown as dots outside of the corresponding boxes
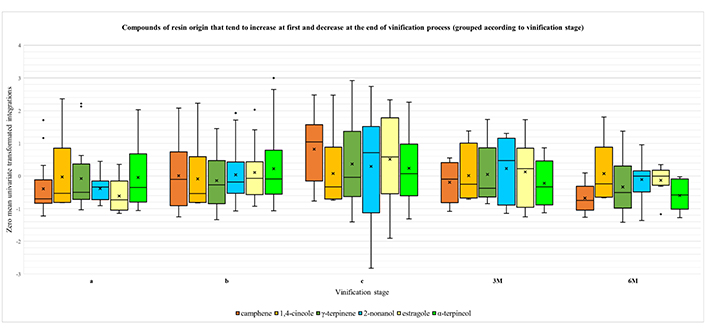
Boxplots for the compounds of resin origin that typically increase until the maturation phase and decrease again after bottling, grouped according to vinification process stage: i) intermediate point of fermentation (a); ii) end of fermentation (b); iii) end of maturation (c); iv) three months of aging (3M); and v) six months of aging (6M). A zero-mean univariate transformation has been applied to fit data of different magnitude in a unified chart. In each boxplot, the five whiskers correspond to Q0, Q1, Q2, Q3 and Q4 quartiles. The mean value is depicted with an “x” mark. Outliers are shown as dots outside of the corresponding boxes
Multivariate statistical analysis, PCA, was performed using data from negative ionization mode to assess reproducibility and stability of the analytical system during batch analysis. As it was observed (Figure S6), QC samples were clustered together indicating the constancy of the analytical procedure. In addition, PCA model showed, as expected, the clear differentiation of samples according to the collection time point. Thus, further assessment of the phenolic alterations of must and Retsina samples due to different P. halepensis resins was performed in each group separately, except for time point C, that was studied both individually and as a cluster with aging samples.
Variation of phenolic compounds during vinification is visualized in Figure S7. Specifically, it was observed that caffeic acid, ellagic acid, epicatechin-4β-sulfonates, ethyl caffeate, gallic acid, gallocatechin, glutathione-S-sulfonate, isorhamnetin and quercetin are constantly increasing over time (Figure 4A), while epigallocatechin gallate, kaempferol, kaempferol-3-glucoside, quercetin-3-glucoside are progressively decreasing (Figure 4B), with quercetin-3-glucoside to be vanished by the end of vinification and aging of Retsina wine. Polyphenols such as caftaric acid, catechin, dihydrokaempferol and epicatechin remain constant during vinification. With regards to glutathione, it was detected during stage “b” of vinification, however, its levels decreased dramatically after 6 months of aging.
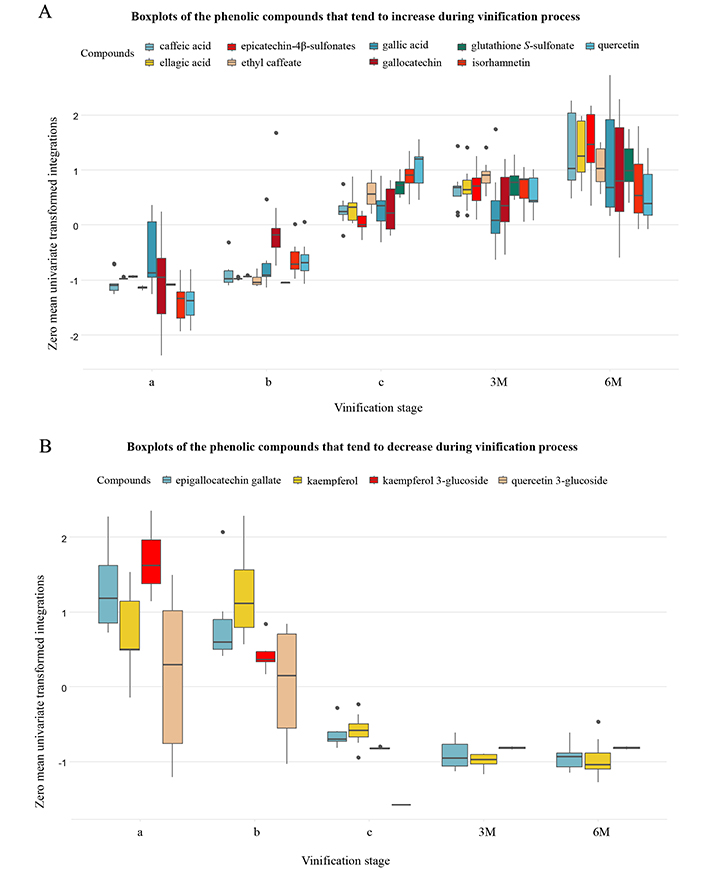
Boxplots of detected polyphenols that tend to increase (A) and decrease (B) over time. Grouped according to vinification process stage: i) intermediate point of fermentation (a); ii) end of fermentation (b); iii) end of maturation (c); iv) three months of aging (3M); and v) six months of aging (6M). A zero-mean univariate transformation has been applied to fit data of different magnitude in a unified chart
Glutathione (l-γ-glutamyl-L-cystinyl-glycine), a naturally occurring tripeptide in grapes [40], has been shown to be highly effective in preserving the volatile compounds in wine and reducing or preventing the development of browning [41]. Thiols, such as glutathione, are known to react quickly with quinones, which are produced by the oxidation of ortho-diphenols, through nucleophilic addition. This reaction results in the creation of stable adducts, some of which have been recently identified [42].
Having explored the correlation between the abundance of volatiles and phenolics with the stage of the vinification process, our focus can now shift exclusively on the phases that follow the maturation of Retsina, i.e., the finished products. In the next sections, we thoroughly investigate three factors that possibly affect the aromatic and phenolic profile of Retsina: i) the origin of the resin added during the fermentation process (altitude of pine forest), ii) the method employed to obtain the resin (natural or conventional tapping) and iii) the resin extraction time in the must.
To investigate the effect of resins from different locations on Retsina’s aroma, 32 samples from the last stages of vinification (end of maturation, three months, and six months of aging), were further examined. These samples cover eight vinification protocols, where resins of two distinct forests of P. halepensis were utilized. In protocols 1–4, resins obtained from microclimate A (low altitude) were used, while protocols 5–8 involved resins originated from microclimate B (high altitude).
By studying 19 features across 32 samples, a 32 × 19 matrix occurred, which was used as the input dataset for multivariate statistics. Samples were divided into two groups according to resin origin (microclimate A and microclimate B). To explore possible patterns, a PLS-DA model with two significant components was constructed, after a zero-mean univariate transformation of data. Data visualization was achieved in SIMCA-P® through the use of score plots (Figure 5) and loading plots. R2Y, Q2Y (Table S4) and CV-ANOVA diagnostics (Table S5, model 1), in conjunction with permutation plots, were used for validation of the model.
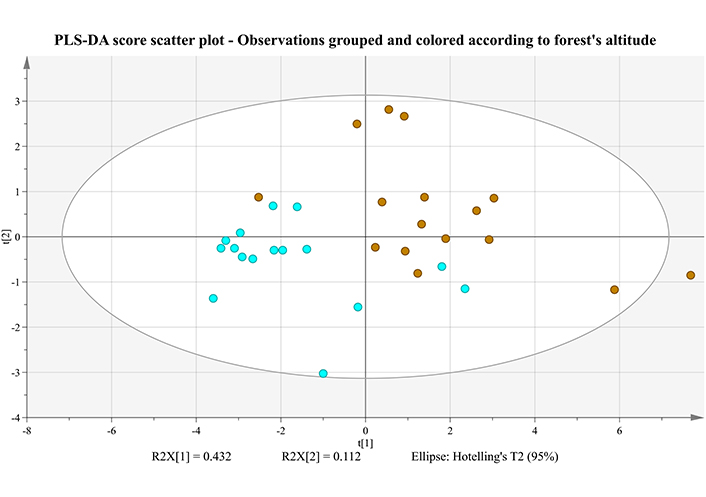
PLS-DA score scatter plot of two first principal components, for Retsina samples received after the maturation stage and grouped according to P. halepensis forests. Microclimate A (low altitude) is shown in light blue, while microclimate B (high altitude) in brown
Although P-value from CV-ANOVA is less than 0.05 (P = 0.00531), indicating a significant model, on the other hand, R2Y, which represents the percent of variation explained by the model (measure of fit), and the Q2Y, which represents the percent of variation predicted by the model according to cross validation (measure of predictivity), are not that great. More specifically, for the first principal component, R2Y = 0.430, while for the first two, cumulative R2Y = 0.644. In addition, Q2Y = 0.363 for the first principal component and Q2Y = 0.396 for the first two. This mediocre reproducibility and predictivity (R2Y << 1.0 and Q2Y < 0.5, respectively) is also supported by the score plot (Figure 5), where a few overlaps can be easily identified. A good portion of the total variance (43.2%) is explained by the first component, while another 11.2% is attributed to the second principal component.
In Table 4, the VIP (variable importance for the projection) list is presented in descending order, where variables with a VIP > 1 are typically defined as significant. While no clear discrimination of the two groups has been occurred, inspection of the loading plot in conjunction with Table 4, reveals a not so apparent trend: the vast majority of compounds are more prominent in samples with resins from microclimate B, especially in fragrances such as 2-nonanol, linalool, fenchol, α-terpinolene, myrtenol and α-terpineol.
Significance (※) of components when sample grouping is based on P. halepensis microclimate
| Compound | VIP (PLS-DA) | P-value (t-test) | Log2 fold change† |
|---|---|---|---|
| 2-Nonanol | 1.5075 | 1.69E-05 | –0.6876 |
| Linalool | 1.3571 | 9.50E-04 | –0.8169 |
| Fenchol | 1.2204 | 2.25E-04 | –0.6329 |
| α-Terpinolene | 1.1878 | 0.0564 | –0.5081 |
| Camphene | 1.1724 | 0.2047 | –0.2996 |
| Myrtenol | 1.1305 | 8.28E-03 | –0.4599 |
| α-Terpineol | 1.1304 | 5.55E-03 | –0.6252 |
| Limonene | 1.1126 | 1.50E-03 | –0.5128 |
| p-Cymene | 0.9331 | 0.1194 | –0.1986 |
| 2-Nonanone | 0.9218 | 0.0251 | –0.2700 |
| γ-Terpinene | 0.9191 | 0.0241 | –0.5793 |
| Estragole | 0.8925 | 9.86E-03 | –0.6378 |
| 1,4-Cineole | 0.8589 | 0.0153 | –1.2947 |
| Terpinen-4-ol | 0.8570 | 0.0167 | –0.8868 |
| β-Caryophyllene | 0.8421 | 0.1480 | –0.3191 |
| Endo-borneol | 0.7311 | 0.0415 | –0.2848 |
| α-Copaene | 0.5641 | 0.9619 | 0.0111 |
| α-Pinene | 0.4805 | 0.5551 | –0.2401 |
| β-Myrcene | 0.4369 | 0.5644 | –0.1182 |
※: significant values with VIP > 1.0 for multivariate analysis and P < 0.05 for univariate analysis are denoted in bold; †: a negative Log2 fold change indicates a direction towards group of microclimate B
For each independent component, the differentiation between the two groups was also examined by means of univariate statistics. For this purpose, the same dataset was uploaded on MetaboAnalyst web-based platform (https://www.metaboanalyst.ca) to be submitted to Student’s t-test. In Table 4, the P-values of these tests are presented alongside the VIP values of the PLS-DA analysis.
To investigate the effect of forest microclimate on the resins, and subsequently on the phenolic content of Retsina wine, univariate statistical analysis was implemented in samples from different time points. Results from Student’s t-test (Table 5) showed that the location effect was significant only in case of samples from the early stage “a” of vinification (intermediate point). Polyphenols including gallocatechin, isorhamnetin and quercetin exhibited increased levels in must samples with resins from microclimate B.
Statistically significant phenolic compounds responsible for the differentiation of Retsina samples according to the three parameters under investigation
| Factor | Stageexamined | Compound | AUC of ROC※ | P-value(t-test) | Log2 fold change† |
|---|---|---|---|---|---|
| Altitude | Intermediate point (stage “a”) | Isorhamnetin | 0.89 | 5.71E-03 | –0.71 |
| Quercetin | 0.88 | 8.42E-03 | –0.68 | ||
| Gallocatechin | 0.77 | 3.82E-02 | –0.34 | ||
| Tapping method | Maturation and aging | Epicatechin | 0.73 | 1.76E-02 | –0.25 |
| Gallocatechin | 0.71 | 3.54E-02 | –0.18 | ||
| Caftaric acid | 0.70 | 5.46E-02 | –0.09 | ||
| Contact time | End of fermentation (stage “b”) | Glutathione | 1.00 | 8.02E-05 | –1.08 |
| Isorhamnetin | 0.89 | 4.93E-03 | –0.31 | ||
| Ethyl caffeate | 0.91 | 7.80E-03 | –0.54 | ||
| Quercetin | 0.91 | 1.32E-02 | –0.32 | ||
| Kaempferol | 0.84 | 3.03E-02 | –0.26 |
※: area under the curve (AUC) of receiver operating characteristic (ROC); †: a negative Log2 fold change indicates a direction towards group of microclimate A for altitude, short extraction time and conventional harvesting
To study the effect of resins obtained with different tapping methods on Retsina’s aroma, the 32 samples from the last stages of vinification (end of maturation, three months, and six months of aging) were taken into account. Resins utilized in protocols 1, 2, 5 and 6 had been obtained through the natural approach, while protocols 3, 4, 7 and 8 involved resins obtained through chemical stimulation.
The same 32 × 19 matrix was used as the input dataset for multivariate statistics. This time, samples were divided into two groups, according to the tapping method for the acquisition of resins (natural and conventional method). To project the data, a PLS-DA model with three significant components was constructed, after a zero-mean univariate transformation. The corresponding score plot is shown in Figure 6. R2Y, Q2Y (Table S4), CV-ANOVA diagnostics (Table S5, model 2) and permutation plots were used for validation of the model. The variables’ contribution to the PLS-DA model can be summarized by their VIP score, which are presented in Table 6 in descendent order.
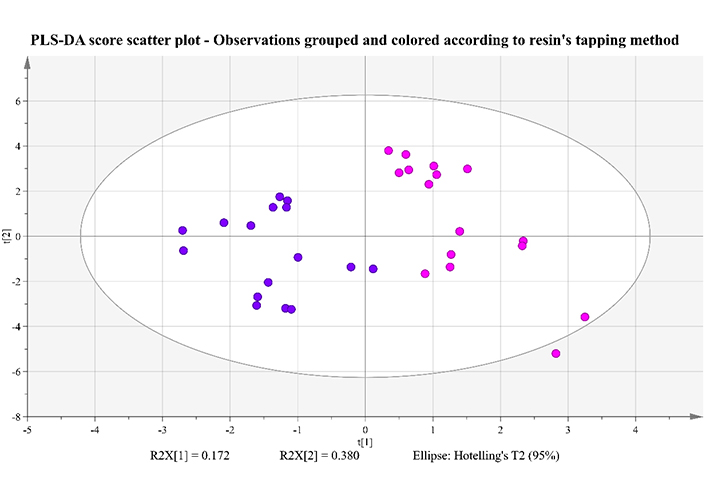
PLS-DA score scatter plot of two first principal components, for Retsina samples received after the maturation stage and grouped according to the tapping method used to obtain the resins. Samples with resins of the conventional method are pink-colored, while samples with resins of the natural method are purple-colored
Significance (※) of components when sample grouping is based on resins’ tapping method
| Compound | VIP (PLS-DA) | P-value (t-test) | Log2 fold change† |
|---|---|---|---|
| 1,4-Cineole | 1.9927 | 6.62E-06 | 2.4897 |
| Terpinen-4-ol | 1.7265 | 2.21E-04 | 1.3314 |
| Estragole | 1.4820 | 2.95E-03 | –0.7253 |
| p-Cymene | 1.3084 | 8.75E-03 | 0.3231 |
| 2-Nonanol | 1.1557 | 0.0296 | –0.3828 |
| α-Copaene | 1.0604 | 0.0360 | 0.4718 |
| γ-Terpinene | 0.8790 | 0.1125 | 0.4138 |
| Limonene | 0.8673 | 0.1324 | 0.2572 |
| Fenchol | 0.6971 | 0.3877 | –0.1622 |
| α-Pinene | 0.6893 | 0.3046 | –0.4170 |
| β-Myrcene | 0.6813 | 0.7898 | 0.0548 |
| Myrtenol | 0.6561 | 0.7157 | –0.0667 |
| α-Terpinolene | 0.6398 | 0.4267 | –0.2152 |
| α-Terpineol | 0.6238 | 0.4139 | –0.1925 |
| β-Caryophyllene | 0.6198 | 0.6455 | 0.1027 |
| Linalool | 0.5889 | 0.3217 | –0.2596 |
| 2-Nonanone | 0.5726 | 0.4197 | –0.1006 |
| Endo-borneol | 0.5575 | 0.3845 | 0.1247 |
| Camphene | 0.3621 | 0.9233 | –0.0230 |
※: significant values with VIP > 1.0 for multivariate analysis and P < 0.05 for univariate analysis are denoted in bold; †: a negative Log2 fold change indicates a direction towards resins of natural tapping
In this model, P-value from CV-ANOVA is 5.06E-10, pointing to a significant model with high values of R2Y (measure of goodness of fit) and Q2Y (measure of predictivity). More specifically, for the first principal component, R2Y = 0.761, for the first two R2Y = 0.851, while for the first three, cumulative R2Y = 0.930. In addition, Q2Y = 0.670 for the first principal component, Q2Y = 0.794 for the first two and Q2Y = 0.879 for the first three cumulatively. From the score plot of Figure 6, it is clear that there is no overlap between the two groups. A percentage of 17.2% of the total variance is explained by the first component, a percentage of 38.0% is attributed to the second component, while another 10.0% to the third principal component (not shown in this 2D plot).
Univariate statistics were also implemented to explore the independent effect of each constituent to the discrimination of the groups. Thus, the dataset was uploaded on MetaboAnalyst to be submitted to Student’s t-test. The P-values of these tests are displayed alongside the VIP values of the multivariate analysis, in Table 6.
Both multivariate and univariate statistics lead to the conclusion that there are six compounds presenting a statistical significance for the differentiation of Retsina samples based on the method used for resin extraction. Out of the six, 1,4-cineole, terpinen-4-ol, p-cymene, and α-copaene are characteristic constituents of the protocols utilizing resins from conventional stimulation, while estragole and 2-nonanol are more representatives of the natural resins. The boxplots of the two most dominant components for each group are presented on Figure 7.
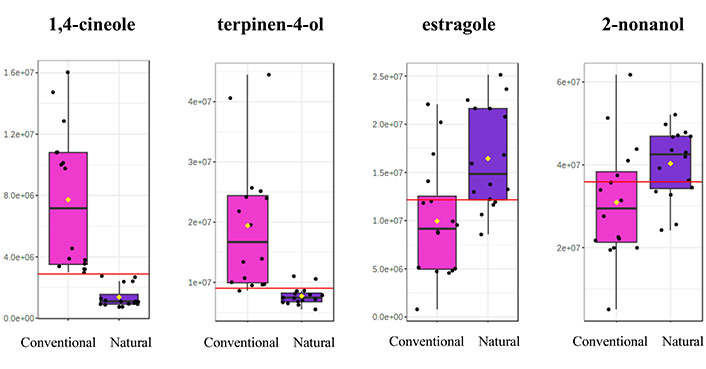
Boxplots of the two most significant constituents for each group of Retsina samples, differentiated according to resin tapping method (conventional vs. natural). The mean value is depicted with a yellow diamond
One of the objectives of the study is the inspection of the effect of resins obtained with different tapping methods on the phenolic content of the collected samples. As it was referred above, resins utilized in experimental protocols were obtained through the natural approach and chemical stimulation. Although resins did not significantly affect the studied polyphenols in the early stage of vinification, univariate analysis (Table 5) revealed significant changes in the concentrations of caftaric acid, epicatechin and gallocatechin in mature samples and in samples after three and six months of aging in the case of samples with conventionally harvested resins. The above-mentioned polyphenols were observed at increased levels with resins collected with chemical stimulation compared to natural (Figure 8).
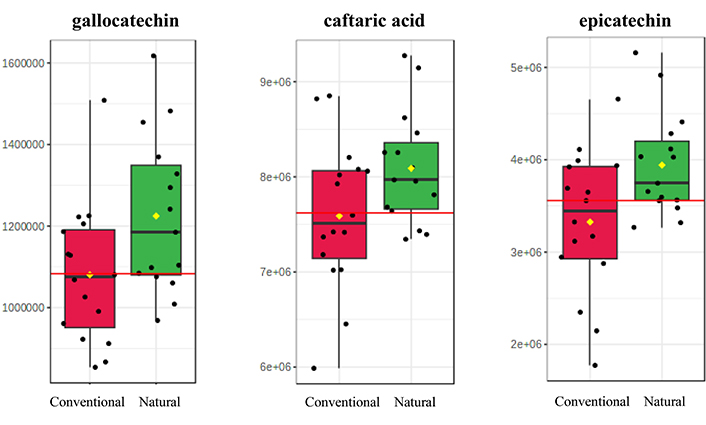
Boxplots of the three most statistically significant polyphenols for the differentiation of samples according to resin tapping method (conventional vs. natural). The mean value is depicted with a yellow diamond
To study the effect of resins obtained with different tapping methods on Retsina’s aroma, the 32 samples from the last stages of vinification (end of maturation, three months, and six months of aging) were once again examined. Resins utilized in protocols 1, 3, 5 and 7 were kept in contact with the must for a relatively short time, while resin in protocols 2, 4, 6 and 8 were kept in barrels for a longer period.
Initially, the 32 × 19 matrix was used as the input dataset for multivariate statistics, with samples being divided into two groups according to the duration of resin extraction. In an attempt to uncover possible patterns, a PLS-DA model with two significant components was constructed, after a zero-mean univariate transformation. The respective score plots are shown in Figure 9. R2Y, Q2Y (Table S4), CV-ANOVA diagnostics (Table S5, model 3) and permutation plots were used for validation of the model.
PLS-DA score scatter plots (two first principal components) for Retsina samples received after the maturation stage and grouped according to resin extraction time in the must. Samples that were in contact with resins for a shorter time are green-colored, while samples that were in contact with resin for a longer period, appear as orange circles. Segment (A) of the picture includes all 32 samples, while plot (B) involves only the 16 samples from the group of resins obtained through the natural method and section (C) the 16 samples of the conventional tapping method
Although P-value from CV-ANOVA is less than 0.05 (P = 0.00768), both reproducibility and predictivity are low (R2Y << 1.0 and Q2Y < 0.5). The groups’ overlapping is also apparent from the score plot of Figure 9A.
However, if two different models are constructed (with 16 observation each) by treating protocols with different types of resins (naturally vs. conventionally obtained) separately, then both models appear to be fairly strong (Table S4 and Table S5, models 4 and 5). More specifically, both P-values from CV-ANOVA are under 0.05, with high values of R2Y (measure of goodness of fit) and Q2Y (measure of predictivity). The cumulative R2Y for the most significant components are 0.839 and 0.936 for the models of natural and conventional tapping, respectively. Furthermore, for natural resins, cumulative Q2Y is equal to 0.660 for the two significant components, while Q2Y = 0.786 for the three significant components in the last model. In both cases, there is clear discrimination between the two groups, as shown in Figure 9B and 9C.
The variables’ contribution to the PLS-DA models can be summarized by their VIP score, which are presented in Table 7, alongside with the P-values from the univariate approach through the Student’s t-test.
Significance (※) of components when sampling grouping is based on resin extraction time (samples with resins obtained naturally are examined separately from those with conventionally obtained resins)
| Compound | VIP (PLS-DA) | P-value (t-test) | Log2 fold change† | |||
|---|---|---|---|---|---|---|
| N | C | N | C | N | C | |
| 2-Nonanone | 1.8572 | 1.1057 | 0.0136 | 0.0589 | 0.4583 | –0.2722 |
| 1,4-Cineole | 1.6265 | 0.8026 | 0.0134 | 0.4160 | –0.9115 | –0.3663 |
| α-Pinene | 1.2039 | 0.8319 | 0.0974 | 0.2956 | –0.9995 | –0.5578 |
| Estragole | 1.1668 | 1.0240 | 0.1048 | 0.6759 | –0.3820 | 0.1919 |
| β-Myrcene | 1.1416 | 1.1866 | 0.1100 | 0.1947 | –0.6123 | –0.2262 |
| β-Caryophyllene | 1.1261 | 1.7728 | 0.1137 | 8.03E-04 | –0.4416 | –1.0345 |
| Limonene | 0.9558 | 0.8518 | 0.3650 | 0.3900 | –0.1783 | –0.2329 |
| α-Terpineol | 0.9117 | 0.8886 | 0.7888 | 0.4768 | –0.0641 | –0.3160 |
| α-Terpinolene | 0.9007 | 0.9319 | 0.4711 | 0.9490 | –0.2490 | –0.0290 |
| Endo-borneol | 0.8390 | 1.3495 | 0.9198 | 0.0212 | 0.0157 | –0.5233 |
| Terpinen-4-ol | 0.8336 | 0.9068 | 0.6665 | 0.2568 | –0.0617 | –0.4837 |
| Fenchol | 0.8269 | 0.8566 | 0.9257 | 0.9511 | –0.0158 | 0.0225 |
| γ-Terpinene | 0.8072 | 1.0198 | 0.5739 | 0.5817 | –0.1490 | 0.2297 |
| Camphene | 0.7398 | 0.9006 | 0.6209 | 0.2391 | –0.1736 | –0.4076 |
| α-Copaene | 0.7351 | 0.8533 | 0.5420 | 0.1928 | 0.1493 | –0.4364 |
| Linalool | 0.6921 | 0.5125 | 0.3370 | 0.7632 | –0.2647 | –0.1480 |
| p-Cymene | 0.6786 | 0.7500 | 0.5792 | 0.3222 | –0.0967 | –0.1619 |
| 2-Nonanol | 0.4068 | 0.8026 | 0.9584 | 0.4950 | 0.0083 | –0.2355 |
| Myrtenol | 0.2016 | 1.0162 | 0.8387 | 0.0963 | 0.0589 | –0.3925 |
※: significant values with VIP > 1.0 for multivariate analysis and P < 0.05 for univariate analysis are denoted in bold; †: a negative Log2 fold change indicates a direction towards the group of longer extraction time; N: naturally obtained resins; C: conventionally obtained resins
In the case of naturally obtained resins, the compounds 2-nonanone and 1,4-cineole seem to be the most significant for the differentiation of samples based on extraction time. For resins obtained through chemical stimulation, the most significant components for the differentiation of samples based on contact time are the compounds β-caryophyllene and endo-borneol. The corresponding boxplots of these constituents are presented on Figure 10.
Boxplots of the significant constituents when Retsina samples are grouped based on resin extraction time (short time vs. long time). Samples with naturally obtained resins are examined separately from those that utilized resins obtained through chemical stimulation. The mean value is depicted with a yellow diamond
Must and wine samples from the last stages of vinification were examined to assess the correlation of resin extraction time with the phenolic profile of the samples. Results from negative ionization mode confirmed that extraction time is an important parameter for the quality of Retsina wines, only in case of musts (time points “b”). Extraction time was found to associate with the extraction of the antioxidant compounds from the resin, longer contact time resulted in higher levels of specific polyphenols, including caftaric acid, ethyl caffeate, glutathione, isorhamnetin, kaempferol and quercetin (Table 5 and Figure 11).
Boxplots of the six most statistically significant polyphenols for the differentiation of samples from stage “b” (end of fermentation process) according to resin extraction time (short vs. long). The mean value is depicted with a yellow diamond
The results of the sensory analysis are presented in radial diagrams in Figure 12 and in Figure S8, which clearly indicate the similarities and differences between the examined samples. The samples were explored by nose for their herbal, fresh pine, and oily aromas, and by palate for their tannins, in conjunction with their herbal, fresh pine and oily aromas. A wine fermented without the presence of resin (Protocol PR09) was used as a control sample.
Organoleptic differences in nose and palate between different extraction times (short vs. long) for resins harvested from pine forest A (A) naturally (PR01 vs. PR02), or (B) conventionally (PR03 vs. PR04)
The main purpose of the study was to examine the degree to which the method of pine resin extraction from the tree influences the quality features of the raw material and therefore the characteristics of the final wine in retsina production in the bottle. This is the first time that the use of naturally harvested pine resin was examined as a factor in the context of retsina production.
The final results of the organoleptic and instrumental analyses are summarized in the following paragraphs. It should be noted that the objective was to optimize the quality of the produced Retsina wine.
Resins from different altitudes, naturally harvested from Aleppo pine trees, showed different organoleptic characteristics, resulted in Retsina with different wine styles, both of high quality. Results showed that there is no influence by the oily and heavy aromas that resin can impart into the wine.
Both assessed altitudes (microclimates A and B) gave different expressions at the same level of quality, thus, we can assume that the complexity in the expression of naturally harvested resin from different pine forests is potentially limitless.
More specifically, the organoleptic tests showed that in the case of natural harvest, resin coming from pine forest A (microclimate A) exhibit prominent herbal character compared to those from pine forest B (microclimate B), in which the citrus fruit and fresh pine aromas are more pronounced, while the oily aromas are at low levels in both cases. From an organoleptic point of view, the wines produced with naturally harvested resin from the two different microclimates, reveal a similar to the nose aromatic character also on the palate, while additionally tannins were again at low levels.
In the case of conventional harvesting, the oily aromas are much more pronounced in the resin sourced from pine forest with microclimate B, both aromatically (nose) and in terms of taste (palate). This allows us to conclude that in the case of conventional resin harvesting, the choice of resin microclimate is an important quality factor in order to limit the oily character of the resin.
Multivariate statistical analysis using GC-MS data of all samples and time points did not confirm significant differences between resins originating from different pine forests. Interestingly, after bottling stage, we observed that samples produced with resin from pine forest B have a higher content of 1,4-cineole (camphor, eucalyptol) and terpinen-4-ol (woody, earthy, resinous), compounds with heavier aromas.
This is only observed in the case of conventional harvest. The above confirms one of the conclusions of the organoleptic tests, according to which the selection of the microclimate for the sourcing of resin must be done with care in the case of conventional harvest, in order to avoid imparting unpleasant oily aromas into the wine.
Regarding the effect of resins from different altitude on the phenolic content of Retsina, we observed a statistical significant difference between samples of stage “b”. Polyphenols including gallocatechin, isorhamnetin and quercetin show an increased trend during the fermentation process and seems to be constant during maturation and bottling of Retsina wine. In stage “b” the above-mentioned polyphenols were positively affected from resins originated from microclimate B. In addition, it is worth to mention that epicatechin is also a polyphenol with an increasing trend during fermentation.
According to the organoleptic tests on the produced wines, naturally harvested resin imparts much lower levels of oily aromas to the wine compared to conventionally harvested resin. At the same time, when naturally harvested resin is used, wines show intense fresh aromas of pine (mastic, lime, pine), floral and citrus fruits.
Therefore, the different harvesting method increases not only the quality of the raw material, but ultimately the quality of the produced wine. From an organoleptic point of view, it is certain that in the case of natural harvesting, the extraction time of the resin in the fermenting must is not critical for the qualitative differentiation of the produced wines. Therefore, when naturally harvested resin is used, the extraction time in the must is not a factor that needs to be optimized.
The multivariate statistical analyses of the GC-MS data confirm the results of the organoleptic tests as there is a clear separation between the different extraction times in the must of the two raw materials during the production process only in the case of conventionally harvested resins (use of sulfuric acid paste) and not significant separation in the case of naturally harvested resins. Compounds frequently found in wine when resin harvested with the aid of sulfuric acid paste and long extraction time was applied, included β-caryophyllene (woody, spicy, clove), endoborneol (camphor) and terpinen-4-ol (woody, resinous, earthy). The abundance of the above-mentioned aromatic compounds was enhanced especially in the case of resin originating from pine forest B.
Extraction time was found to associate with the extraction of polyphenols from the resin. Although caftaric acid is constant during vinification, in stage “b” we observed significantly higher levels when long extraction time was applied. Quercetin, which is the most abundant flavonol in wine, usually decreases smoothly during alcoholic fermentation. The addition of resin seemed to positively affect the concentration of quercetin, ethyl caffeate and isorhamnetin especially when long extraction time was applied during the production of Retsina wine. Finally, kaempferol is a polyphenol that was decreased during fermentation, although during stage “b” of fermentation process it was noticed that long extraction time enhances its extraction from the resins.
The organoleptic tests showed that the conventionally harvested resin has a strong oily character, an element that degrades the quality of the raw material. For this reason, this type of resin needs special treatment during winemaking. In this case, the extraction time of the resin in the fermenting must is critical.
More specifically, the GC-MS analyses confirm the results of the organoleptic tests, because the multivariate statistical analyses showed that the most important parameter for their separation is 1,4-cineole (camphor, eucalyptol), which is high in the case of conventionally harvested resin and absent in the case of natural harvest. In addition, the compounds terpinen-4-ol (woody, resinous, earthy), p-cymene (harsh chemical, woody and terpy-like odor) and copaborneol (camphor) are equally high in the case of conventional harvest.
This confirms the conclusion that only in the case of conventionally harvested resin attention is needed to both the microclimate and above all to the duration of resin extraction during the wine making process, in order to improve the wine produced. In the case of naturally harvested resin these are parameters that influence the style of the wine, but not its quality.
High-resolution mass spectrometry (HRMS) analysis underline differences in the phenolic content of Retsina wine samples that produced with resins from different tapping methods. Caftaric acid, epicatechin and gallocatechin showed a small increase in case of natural harvesting resins in mature samples and in samples after three and six months of aging in the case of samples with conventionally harvested resins.
To conclude, in the context of the research it was found that by optimizing the collection process of pine resin using the natural harvest method (absence of chemical stimulation), the extraction time in the wine must and the choice of the harvesting area of the resin do not constitute a factor of quality for the produced wine but a matter of style, in contrast to conventionally harvested resin (use of sulfuric acid to enhance flow) that there is a matter of quality. This is a very important finding from a winemaker’s point of view when the aim is to improve the quality of Retsina.
amu: atomic mass unit
ANOVA: analysis of variance
AUC: area under the curve
CV: coefficient of variation
DDA: data dependent acquisition
DVB/CAR/PDMS: divinylbenzene/carboxen/polydimethylsiloxane
EI: electron impact
ESI: electrospray ionization
GC-MS: gas chromatography-mass spectrometry
HRMS: high-resolution mass spectrometry
HS: headspace
LC-MS: liquid chromatography-mass spectrometry
log2FC: logarithm base two of fold change
MeOH: methanol
NaCl: sodium chloride
OPLS-DA: orthogonal projection to latent structures discriminant analysis
PCA: principal components analysis
PLS-DA: partial least squares-discriminant analysis
ppb: parts per billion
ppm: parts per million
PTFE: polytetrafluoroethylene
QC: quality control
RI: retention indices
ROC: receiver operating characteristic
RP-LC-TIMS-TOF MS: reversed-phase liquid chromatography-trapped ion mobility spectrometry-time-of-flight mass spectrometry
RS: reference standard
RT: retention time
SD: standard deviation
SPME: solid phase microextraction
Stage 3M: three months of aging
Stage 6M: six months of aging
Stage a: intermediate point of the fermentation process
Stage b: end of fermentation process
Stage c: end of maturation process
VIP: variable importance for the projection
The supplementary material for this article is available at: https://www.explorationpub.com/uploads/Article/file/101048_sup_1.pdf.
AN and CV: Investigation, Methodology, Formal analysis, Writing—original draft, Writing—review & editing. DS: Investigation, Methodology, Formal analysis, Writing—original draft. EK: Conceptualization, Methodology, Resources, Funding acquisition, Project administration. ANA: Resources, Funding acquisition, Project administration, Writing—review & editing, Supervision. All authors read and approved the submitted version.
The authors declare that they have no conflicts of interest.
Not applicable.
Not applicable.
Not applicable.
All GC-MS data are presented in the Supplementary file in form of peak integrations. All LC-MS integration data are provided in an excel file and can be found here: [https://www.explorationpub.com/uploads/LC-TIMS-TOF_MS_integrations.xls].
This research has been co‐financed by the European Union and Greek national funds through the Operational Program Competitiveness, Entrepreneurship and Innovation, under the call RESEARCH – CREATE – INNOVATE [T2EDK-03382]. The funders had no role in study design, data collection and analysis, decision to publish, or preparation of the manuscript.
© The Author(s) 2024.
Copyright: © The Author(s) 2024. This is an Open Access article licensed under a Creative Commons Attribution 4.0 International License (https://creativecommons.org/licenses/by/4.0/), which permits unrestricted use, sharing, adaptation, distribution and reproduction in any medium or format, for any purpose, even commercially, as long as you give appropriate credit to the original author(s) and the source, provide a link to the Creative Commons license, and indicate if changes were made.

Stella A. Ordoudi, Maria Z. Tsimidou
Nikolaos Nenadis, Maria Z. Tsimidou
David Heath ... Nives Ogrinc
Gabriel Mustatea, Elena L. Ungureanu
Florinda Artuso ... Fabio Pollastrone
Sandra Gueifão ... Inês Coelho
Despoina Langari, Fani Th. Mantzouridou
Eleni Zymvrakaki ... Urania Menkissoglu-Spiroudi
Arianna Latini ... Patrizia Galeffi
Aggeliki Kalogeropoulou ... Triantafyllos Albanis
Pierpaolo Di Bitonto ... Sabina Tangaro
Maria Z. Tsimidou ... Claudia Zoani
