 Original Article

Affiliation:
1Department of Biochemistry, Faculty of Science, The University of Bamenda, Bambili PO Box 39, Cameroon
Email: sahabrice@yahoo.fr
ORCID: https://orcid.org/0000-0002-0488-841X
Affiliation:
1Department of Biochemistry, Faculty of Science, The University of Bamenda, Bambili PO Box 39, Cameroon
ORCID: https://orcid.org/0000-0002-0962-3242
Affiliation:
2UNICEF Kenya Country Office, Nairobi 00100, Kenya
ORCID: https://orcid.org/0000-0002-6126-9148
Affiliation:
1Department of Biochemistry, Faculty of Science, The University of Bamenda, Bambili PO Box 39, Cameroon
Affiliation:
3Department of Biochemistry, Faculty of Science, University of Yaoundé I, Yaoundé PO Box 337, Cameroon
ORCID: https://orcid.org/0009-0002-8456-3515
Affiliation:
3Department of Biochemistry, Faculty of Science, University of Yaoundé I, Yaoundé PO Box 337, Cameroon
Affiliation:
3Department of Biochemistry, Faculty of Science, University of Yaoundé I, Yaoundé PO Box 337, Cameroon
Affiliation:
1Department of Biochemistry, Faculty of Science, The University of Bamenda, Bambili PO Box 39, Cameroon
ORCID: https://orcid.org/0000-0003-2982-8007
Explor Foods Foodomics. 2025;3:101076 DOI: https://doi.org/10.37349/eff.2025.101076
Received: December 18, 2024 Accepted: February 18, 2025 Published: March 06, 2025
Academic Editor: José Pinela, National Institute of Agrarian and Veterinary Research, Polytechnic Institute of Bragança, Portugal
The article belongs to the special issue The food (r)evolution towards food quality/security and human nutrition
Aim: The increasing prevalence of type 2 diabetes has heightened the demand for low glycemic index food products, leading to the exploration of alternative baking ingredients. This study assesses the effects of bran-enriched flour blends on the sensory, physical, nutritional, and antioxidant properties and glycemic control of high-fiber biscuits.
Methods: Wheat, corn, sorghum, and sweet potato were obtained from the market. Linear programming (LP) optimized fiber content to create four high-fiber flour blends assessed for functional properties [water absorption capacity (WAC), oil absorption capacity (OAC), foaming capacity (FC), and stability]. Four high-fiber biscuits were developed and evaluated for nutritional composition (ash, crude fibers, water, carbohydrates, proteins, fats, Zn, Fe, Mg, Na, Ca, and P), sensory attributes (color, aroma, texture, and taste), physical properties (thickness, diameter, weight, spread ratio, browning index; L, a, and b), antioxidant properties (DPPH and FRAP activities), glycemic response, and in vitro glucose-binding capacity.
Results: The formulated flours exhibited water and oil absorption capacities ranging from 1.95% to 2.70%, with the highest oil absorption in formulated flour 3. FC and stability varied significantly, with the control showing the highest values. Swelling power ranged from 1.27 cm3/g to 2.03 cm3/g. High-fiber biscuits had higher fiber (6.06–12.44%), protein (9.48–11.31%), Fe (3.01–4.55 ppm), and Mg (34.37–78.05 ppm) content, and lower carbohydrate (50.88–59.57%) contents compared to the control. They also demonstrated enhanced antioxidant properties with higher phenolic content (201.91–503.18 mg GAE/100 g) and DPPH-scavenging activity (0.07–0.27 µg/mL). Sensory evaluation indicated general acceptance. Biscuits 2 and 3 maintained steady blood glucose levels over 90 min, with biscuit 3 showing the highest in vitro glucose binding capacity (43.4 ± 4.3%).
Conclusions: Incorporating diverse bran and flour types improves biscuit quality, particularly in blends like F2 (wheat flour, corn bran, and sorghum bran) and F3 (wheat flour, corn bran, sweet potato flour, and sorghum bran), offering beneficial options for diabetics.
The growing epidemic of diet-related chronic diseases, particularly obesity, diabetes, and cardiovascular issues, underscores the urgent need for innovative dietary solutions that promote health without compromising sensory quality [1]. High-fiber diets are increasingly recognized for their potential to reduce the risk of these diseases by enhancing glycemic control, improving digestive health, and providing essential nutrients [2, 3]. The incorporation of fiber into food products not only aids in the prevention of health problems but also meets rising consumer demand for functional foods that have enhanced health benefits [1, 4]. In this context, using bran-enriched flour blends as key ingredients in food formulations presents an interesting avenue to explore.
Bran, the outer layer of cereal grains, is an excellent source of dietary fiber, vitamins, and minerals, significantly enhancing the nutritional profile of various food products [5]. There is an increasing exploration of alternative flour sources, including wheat, corn, sorghum, and sweet potato, to formulate high-fiber biscuits that could appeal to health-conscious consumers and the broader market [6–8]. Wheat flour has historically been the staple for biscuit production due to its gluten content and satisfactory textural properties [9]. However, the use of alternative cereal grains and root vegetables offers a unique opportunity to cater to diverse dietary needs, including gluten-free options and additional nutritional benefits [10]. Corn flour, rich in essential nutrients and possessing a unique flavor, serves to augment the sensory dimensions of baked goods, while sorghum flour provides gluten-free alternatives with health-enhancing properties [11, 12]. Moreover, sweet potato flour increases dietary fiber content and contributes natural sweetness and appealing color, improving consumer acceptance [13].
The sensory properties of food products, such as flavor, texture, and aroma, are critical factors influencing consumer preference and market success. In biscuits, texture plays a prominent role. Consumers typically favor products with a crunchy exterior and a tender bite [14]. Various scientific approaches can be employed to evaluate these sensory properties, including descriptive analysis, hedonic testing, and quantitative descriptive analysis (QDA) [15], ensuring a comprehensive understanding of how bran-enriched flour blends affect consumer perceptions. This study incorporates sensory evaluation methods to assess the acceptability of biscuits made with different flour blends, responding to the dual objective of enhancing nutritional value while maintaining an enjoyable eating experience.
In addition to sensory considerations, high-fiber biscuits’ physical properties are vital quality indicators. Key physical attributes, such as spread ratio, hardness, and color, can be affected by the type and ratio of flour used in the formulation [16, 17]. Understanding these properties allows for targeted adjustments in the manufacturing process to achieve the desired texture and appearance in the final product. For instance, the addition of bran in varying proportions may influence dough rheology and baking performance due to the effect of bran particles on dough structure and an increase in water absorption [18]. An in-depth exploration of the physical changes induced by different bran-enriched flour blends is essential for producing high-quality biscuits that meet consumer expectations.
The nutritional benefits of high-fiber biscuits also warrant significant attention. Dietary fiber promotes digestive health, regulates blood sugar levels, and enhances satiety, making it a critical dietary component [19]. By focusing on the nutritional composition of biscuits made with bran-enriched flour blends, this study aims to elucidate the health benefits these products can offer. In particular, analyzing macronutrient distribution, and mineral content will provide insights into the overall healthfulness of the biscuits and their potential impact on consumers’ diets.
Furthermore, the antioxidant properties of flour brans have garnered increasing interest due to their role in reducing oxidative stress [20]. Antioxidants may help counteract cellular damage caused by free radicals, hence playing a significant role in chronic disease mitigation [21].
Finally, the impact of bran-enriched biscuits on glycemic control presents a crucial aspect of this research. Dietary interventions that incorporate high-fiber foods can influence postprandial blood glucose levels, thereby aiding in the management of diabetes [19]. By conducting glycemic response assessments of the biscuits, this study will provide evidence of the efficacy of bran-enriched blends in promoting better blood sugar regulation, especially among individuals at risk for diabetes.
Thus, this study addresses the multifaceted contributions of bran-enriched flour blends to the sensory, physical, nutritional, antioxidant properties, and glycemic control of high-fiber biscuits. By bridging gaps between health, nutrition, and enjoyment, it aims to provide actionable insights for food manufacturers and health professionals, ultimately supporting public efforts toward improved dietary habits and health outcomes. The findings of this research are anticipated to align with current global trends favoring functional foods, paving the way for innovative and health-conscious snacking options in the marketplace.
The primary ingredients used in this study included a variety of flours and brans (wheat flour, sweet potato flour, red millet bran, corn bran, wheat bran, sorghum bran), sweeteners and additives (stevia sugar, milk powder, baking powder, salt), and refined vegetable oil derived from palm. Whole grains such as sorghum, wheat, and red millet were procured from Ngaoundéré in the Adamawa region of Cameroon. At the same time, all other ingredients were sourced from the local market in Yaoundé, Centre region. All chemicals used for the study were of analytical grades and were procured from Sigma-Aldrich (United Kingdom).
Twenty male Wistar rats, aged 8 weeks and weighing approximately 200 g, were bought and acclimatized at the Institute of Medical Research and Medicinal Plants Studies (IMPM). The animals were housed under controlled conditions at a temperature of 24°C, with a 12-h light/dark cycle, and had ad libitum access to a standard chow diet and clean water, maintained under good hygienic conditions.
The process described by Dapčević-Hadnađev et al. [22] was used with slight modifications. Cereal samples were manually cleaned of extraneous particles and spread on trays. The weight of each cereal type (wheat, millet, and sorghum) was measured and documented. Each cereal type was then soaked in separate vessels of water for 5 min, drained, and manually pounded in mortars for 10 min. The processed cereals were dried in an electric drier (Excalibur Dehydrators, Sacramento, CA, USA) at 50°C for 12 h and winnowed to isolate the pure bran. The isolated bran was subsequently ground in an electric blender (Vitamix Corporation, Olmsted Township, OH, USA) to produce bran flour. For corn bran, the corn was peeled using a grinding mill, and the separated bran was ground to produce corn bran flour. Sweet potato flour was prepared by purchasing, washing, and peeling yellow local sweet potatoes, which were then sliced and dried in an electric drier (Excalibur Dehydrators, Sacramento, CA, USA) for 24 h before being ground into powder. All brans were sealed and packaged for subsequent analysis.
Before optimization, a database for the nutritional composition of ingredients was established in an Microsoft Excel spreadsheet (Table 1). Food composition information for each ingredient was sourced from the USDA Food Data Central and the West Africa Food Composition Table [23, 24]. The spreadsheet documented the water, ash, and fiber content per 100 g, as well as the maximum allowable weight for each ingredient in the formulation.
Water, ash, and fiber content for 100 g of the ingredients used to develop the four formulated flours
| Ingredient | Water content (g) | Ash content (g) | Fiber content (g) |
|---|---|---|---|
| Wheat bran | 11.70 | 2.25 | 6.77 |
| Corn bran | 11.07 | 1.58 | 12.49 |
| Millet bran | 11.33 | 1.53 | 6.19 |
| Sorghum bran | 9.46 | 2.22 | 6.08 |
| White wheat flour | 10.69 | 0.50 | 5.00 |
| Sweet potato flour | 11.64 | 3.05 | 5.40 |
Nutritional constraints for the various blends were set based on the technical specifications for biscuit flour [25], with ash content targeted between 0.8% and 1.3%, and water content not exceeding 12%. Non-nutritional constraints included a final product weight of 49 g, representing the flour proportion (49%) in each formulated biscuit. Additional constraints on ingredients resulted in four bran-enriched flour blends:
Formula 1 (F1): white wheat flour and corn bran should be included;
Formula 2 (F2): white wheat flour, corn bran, and sorghum bran should be included;
Formula 3 (F3): white wheat flour, corn bran, and sweet potato flour, and sorghum bran should be included;
Formula 4 (F4): white wheat flour, corn bran, and sweet potato flour should be included.
The primary objective was to maximize the fiber content in the different flours using the following linear programming (LP) model:
Z = C1X1 + C2X2 + ... + CnXn
The optimization problem was formulated with Z representing the fiber content. The coefficients C1, C2,…, Cn correspond to the objective function (OF), while X1, X2,…, Xn denote the decision variables (DVs). Specifically, C is defined as the fiber content per 100 g, and X represents the weight of the food ingredients. Linear constraints were established to delimit the optimization process, ensuring the formulation adheres to all specified constraints without exceeding lower or upper bounds. Satisfying these constraints was essential for designing appropriate formulations.
Following the development of the LP model and the organization of data in a spreadsheet, optimization was conducted using the Microsoft Excel 365 Solver Add-in (Microsoft, Inc., Redmond, WA, USA). The OF, DVs, and constraints were inputted into the software. The Solver was configured to minimize the OF using its default settings, which include a maximum solving time of 100 s and 100 iterations. The calculation precision was set to 0.000001, with a tolerance of 5% and a convergence criterion of 0.0001.
Concerning water absorption capacity (WAC) and oil absorption capacity (OAC), following the methods of Lin et al. [26] and Tambo et al. [27], 1 g of sample was mixed with 10 mL of sunflower oil or distilled water and incubated at 30°C for 30 min. After centrifugation at 4,500 rpm for 15 min, the absorbed volume was measured to calculate WAC and OAC that were both expressed in terms of g/g.
Following Khattab et al. [28], a sample suspension in 100 mL of distilled water was homogenized for 5 min. The volume was recorded after 30 s in a 250 mL cylinder to determine foaming capacity (FC) as a percentage increase. Foaming stability (FS) was determined by measuring the change in foam volume after 60 min at room temperature.
Using the method of Takashi and Seib [29], 1 g of flour sample was mixed with 15 mL of distilled water and heated at 100°C for 1 h. After cooling, the mixture was centrifuged at 3,000 rpm for 30 min. The weight of the swollen sediment was measured to calculate the swelling power that was expressed in terms of cm3/g.
The water, fiber, and ash composition were determined using standard AOAC Official methods 990.19, 962.09, and 900.02 respectively [30]. A 5 g sample of each bran-enriched flour blend was individually weighed and oven-dried at 105°C for 2 h to determine the water content that was expressed in terms of percentage representing g per 100 g of wet matter. Ash content was quantified by incinerating 1 g samples at 550°C for 2 h in a muffle furnace, followed by gravimetric analysis. Crude fiber content was also determined gravimetrically. Fat-free samples (3 g) were digested with 0.26 N hot sulfuric acid for 30 min, followed by the addition of 0.23 N sodium hydroxide (NaOH). The mixtures were then filtered using Whatman paper, and the filtered samples were washed with acetone and oven-dried at 105°C for 8 h before incinerating at 550°C for 3 h. Ash content was subsequently calculated using the gravimetric method. Ash and fiber contents were expressed in terms of percentage representing g per 100 g of wet matter.
The production of biscuits was conducted at the Laboratory for Food Science and Metabolism (LabSAM), following a modified method based on Erukainure et al. [31]. After thorough cleaning of hands, equipment, and the environment, 2.6 g of sugar, 14 g of milk, and 14 g of butter were measured and combined. Subsequently, 0.2 g of baking powder and 0.2 g of salt were added and mixed. For each formulation, 49 g of the respective bran-enriched flour blends and 49 g of wheat flour (serving as the control) were measured and blended using an electric mixer, then transferred to separate bowls. To each mixture, 20 g of water was added, and the mixture was kneaded for 5 min until a smooth dough was achieved. The dough was then rolled out on a pastry board using a rolling pin and cut into various shapes using different biscuit cutters. The electric oven was preheated to 210°C, and the metal trays were greased with refined palm oil. The biscuits were carefully placed on the trays and baked in the preheated oven for 25 min. After baking, the biscuits were removed, air-dried, and allowed to cool before being sealed in aluminum paper and stored in a dry place for subsequent analysis. This process resulted in the following five high-fiber biscuit formulations for the flour blend used:
B1 was formulated using bran-enriched flour blend F1;
B2 was formulated using bran-enriched flour blend F2;
B3 was formulated using bran-enriched flour blend F3;
B4 was formulated using bran-enriched flour blend F4;
Control made from wheat flour only.
For the sensory evaluation of high-fiber biscuits, rigorous ethical guidelines were followed to ensure the reliability of findings and the well-being of panelists. Informed consent was obtained from all participants screened for allergies and instructed on reporting adverse reactions. Confidentiality and anonymity were maintained throughout the study. A diverse and representative panel was utilized to mitigate bias, and the evaluation process was standardized for consistency. Transparency and integrity were upheld in method documentation and result reporting, respecting cultural and dietary preferences.
A total of 60 panelists, comprising men and women over the age of 20, were randomly recruited to evaluate the acceptability of the biscuits (B1, B2, B3, B4, and control). Participants were screened to ensure good general health and the absence of allergies to the biscuit ingredients or digestive conditions that could be exacerbated by high-fiber intake. Individuals with gastrointestinal issues or sensory impairments were excluded, as were pregnant or breastfeeding women. This rigorous selection process aimed to minimize potential biases and ensure the reliability of the sensory evaluation data. A structured quantitative acceptance scoring test was employed, with panelists having fasted for at least 3 h before the assessment. The sensory descriptors evaluated were color, smell, taste, and texture. A 9-point rating scale was used, ranging from (1) extremely unpleasant to (9) extremely pleasant. Additionally, the general sensory acceptability was assessed using the same scale. Each panelist was presented with different biscuit samples and answer sheets to record their evaluations. To minimize taste interference, panelists were instructed to take a three-minute break and drink water between tastings. The biscuit samples were coded with 3-digit identifiers to ensure blind assessment.
The weight, thickness, and diameter of the biscuits were determined following the method described by Bala et al. [32]. The weight in g was measured using a digital electronic balance (A&D, HR-60, Japan) with an accuracy of 0.1 g. The thickness and diameter, both in cm, were measured using a Vernier caliper. The spread ratio was also determined by dividing diameter by thickness. Three rows of five well-formed biscuits were created, and their height was measured. Additionally, the biscuits were arranged horizontally from edge to edge, and the total diameter was measured. The spread ratio was calculated as the diameter in cm divided by the thickness in cm.
The color of the biscuits was assessed using a Minolta Chroma Meter CR-410 (Konica Minolta, Osaka, Japan) based on the CIE Lab* system [33]. The parameters L*, a*, and b* correspond to lightness/darkness, redness/greenness, and yellowness/blueness of the biscuits, respectively. The browning index was subsequently calculated using the following equation: Browning Index = [100(x – 0.31)]/0.17, where x = (a* + 1.75L*)/(5.645L* + a* – 0.3012b*).
Fiber and ash contents were determined as described above. Protein content was quantified using the Kjeldahl method [34] in combination with the procedure described by Devani et al. [35]. Initially, approximately 1 g of the sample was digested with 10 mL of concentrated sulfuric acid (H2SO4) and a catalyst mixture comprising 0.7 g potassium sulfate and 0.035 g copper sulfate to convert organic nitrogen into ammonium sulfate. Following digestion, the solution was distilled with 40 mL of NaOH to release ammonia (NH3), which was then absorbed in 25 mL of 0.1 N hydrochloric acid (HCl). For spectrophotometric analysis, a color reagent such as phenol disulfonic acid was added to develop a colored complex. The absorbance was measured at a wavelength of 410 nm and compared to a calibration curve (concentrations of 0, 1, 5, 10, 25, 50, and 100 mg/L of nitrogen) prepared with known standards. The nitrogen content was calculated, and the protein content was estimated by multiplying by a conversion factor of 6.25. Lipids were exhaustively extracted from the three porridge flours (2 g each) using hexane in a Soxhlet extractor at 65°C for 8 h and quantified gravimetrically [30]. Carbohydrate content was determined by subtracting the sum of moisture, ash, lipid, and protein contents from 100. All macronutrients were quantified as a percentage, representing g per 100 g of dry matter. Water content was similarly expressed as a percentage, representing g per 100 g of wet matter. Caloric content was calculated in kcal per 100 g using the following energy conversion factors: Caloric value = 4 × protein content + 9 × lipid content + 4 × (carbohydrate content − crude fiber content).
Mineral content was analyzed by incinerating the samples in a muffle furnace at 550°C for 6 h, followed by dissolution of the residue in concentrated HCl. Fe, Ca, Zn, and Mg were quantified by atomic absorption spectrophotometry (Perkin-Elmer Model 3300) at 248.3 nm, 422.7 nm, 213.9, and 285.2 nm, respectively. Na was determined by flame photometry (Micronal B260) at 589 nm, and phosphorus by visible spectrophotometry (Femto 600s) using the ammonium phosphovanadomolybdate method at 690 nm. All analyses were performed according to AOAC Official Methods 999.11, 927.02, 984.01, and 984.17 [30], with results expressed in parts per million (ppm).
The concentration of total phenols in the hydroalcoholic extracts (80% v/v methanol) from biscuits was determined using the Folin-Ciocalteu colorimetric method [36]. Briefly, 50 µL of each biscuit solution was mixed with 2 mL of 2 N Folin-Ciocalteu reagent. After agitation and a 5-min incubation, 2 mL of 10% Na carbonate solution was added, and the mixture was stirred. The samples were then incubated at room temperature in the dark for 15 min, diluted to 1/10, and vortexed to ensure homogeneity. Absorbance was measured at 765 nm against a blank. The phenolic compound content of each sample was determined using a calibration curve, with gallic acid serving as the standard. Gallic acid concentrations of 10, 20, 30, 40, and 50 μg/mL were used. The calibration curve was defined by the equation y = 0.0157x with a coefficient of determination of 0.9991, where y represents absorbance, and x denotes the concentration of gallic acid. Phenolic content was quantified and expressed as mg of gallic acid equivalents per 100 g (mg GAE/100 g).
The DPPH radical scavenging activity was determined following the procedure outlined by Braca et al. [37]. Briefly, 4.5 mL of a 0.002% alcoholic solution of DPPH was combined with 0.5 mL of various concentrations (250, 500, 1,000, and 2,000 μg/mL) of biscuit samples and standard solutions, resulting in final concentrations of 25–200 μg/mL. The mixtures were incubated at room temperature in the dark for 30 min, after which the absorbance was measured at 517 nm. The absorbance of the samples, control, and blank was compared against methanol. The IC50 value (μg/mL) was determined by plotting the percentage inhibition against the inhibitor concentration and using logit regression to interpolate the concentration at which 50% inhibition occurs.
The ferric-reducing antioxidant capacity of biscuit samples was evaluated using the method described by Yildirim et al. [38]. Briefly, dried extracts (125–1,000 μg) in 1 mL of the corresponding solvent were mixed with 2.5 mL of phosphate buffer (0.2 M, pH 6.6) and 2.5 mL of potassium ferricyanide [K3Fe(CN)6; 10 g/L]. The mixture was incubated at 50°C for 30 min. Post-incubation, 2.5 mL of trichloroacetic acid (100 g/L) was added, and the mixture was centrifuged at 1,650 g for 10 min. Subsequently, 2.5 mL of the supernatant was combined with 2.5 mL of distilled water and 0.5 mL of FeCl3 (1 g/L), and the absorbance was measured at 700 nm. The IC50 value (μg/mL) was determined by plotting the percentage inhibition against the inhibitor concentration and using logit regression to interpolate the concentration at which 50% inhibition occurs.
The glucose-binding capacity of the formulated powders was assessed using the method described by Sangnark and Noomhorm [39] with slight modification. Briefly, 1 mL of aqueous solutions of the powders at various concentrations (0, 20, 25, 30, and 40 mg/mL) were mixed with 1 mL of a 25 mM glucose solution. The mixtures were thoroughly homogenized and incubated in a shaking water bath at 37°C for 1 h. Control samples comprised 1 mL of glucose solution and 1 mL of distilled water. Following incubation, the remaining glucose was quantified using the glucose reagent according to the method of Trinder [40]. Absorbance was measured at 505 nm for each sample. The percentage of glucose capture was determined by calculating the difference between the glucose content in a solution containing only glucose and the glucose content in a solution containing both glucose and varying amounts of biscuits. This difference was then expressed as a percentage of the glucose content in the solution containing only glucose.
The glycemic response was conducted as described by Wolever et al. [41] with slight modifications. Before the experiment, Wistar rats were fasted for 12 h. At the start of the experiment, the Wistar rats were weighed using an electronic scale, and their blood glucose levels were measured using glucose test strips and a glucometer (OneTouch Ultra-Easy) via tail blood sampling with a sterile lancet. The Wistar rats were then divided into four groups of five, based on their average blood glucose levels (mg/dL). The treatment dose of biscuits was set at 2 g/kg body weight, aligned with reference glucose doses.
For biscuit sample preparation, biscuits were pulverized, and 2 g of the powdered biscuit was placed in a beaker with 100 mL of distilled water. The mixture was stirred to ensure complete dissolution and transferred to a clean container. The animal groups were assigned as follows:
Reference Group (Glucose): received water + glucose solution (2 g/kg);
Assay Group 1 (Control): received water + control biscuit solution (2 g/kg);
Assay Group 2 (B2): received water + B2 biscuit solution (2 g/kg);
Assay Group 3 (B3): received water + B3 biscuit solution (2 g/kg).
Initially (t0), the reference and test groups received their respective glucose or biscuit solutions. Blood glucose levels were measured every 30 min for 1 h and 30 min post-administration, and the results were recorded.
All rats were anesthetized via intraperitoneal injection in the right lower abdominal quadrant with a combination of ketamine (80 mg/kg) and xylazine (10 mg/kg) until loss of consciousness was achieved. Adequate anesthesia was rigorously confirmed before any procedural interventions. Euthanasia was subsequently performed by administering an overdose of Na pentobarbital (150 mg/kg) through intraperitoneal injection.
Results are presented as means ± standard error. The Shapiro-Wilk test was employed to assess the normality of the data, and Levene’s test was used to evaluate the homogeneity of variances across groups. One-way ANOVA, followed by Tukey’s post hoc test, was performed for multiple comparisons, with significance set at P < 0.05. Statistical analyses were conducted using IBM-SPSS 27.0 (IBM Corporation, Armonk, NY, USA) for Windows. Graphs were generated using GraphPad Prism 9.5.1 (GraphPad Software, San Diego, CA, USA).
Table 2 delineates the ingredient composition of various high-fiber flours derived from LP, adhering to specified nutritional constraints. The analysis revealed that Formulated flour 1 comprised 65.7% white wheat flour and 34.3% corn bran. Formulated flour 2 consisted of 64.7% white wheat flour, 34.3% corn bran, and 1.0% of sorghum bran. Formulated flour 3 comprised 55.3% white wheat flour, 34.3% corn bran, 9.4% sweet potato flour, and 1.0% sorghum bran. Lastly, formulated flour 4 contained 56.2% white wheat flour, 34.2% corn bran, and 9.6% sweet potato flour.
Proportion of ingredients of bran-enriched flour blends based on linear programming
| Ingredients | Control (%) | F1 (%) | F2 (%) | F3 (%) | F4 (%) |
|---|---|---|---|---|---|
| White wheat flour | 100.0 | 65.7 | 64.7 | 55.3 | 56.2 |
| Corn bran | - | 34.3 | 34.3 | 34.3 | 34.2 |
| Sweet potato flour | - | - | - | 9.4 | 9.6 |
| Sorghum bran | - | - | 1.0 | 1.0 | - |
F1: formulated flour 1; F2: formulated flour 2; F3: formulated flour 3; F4: formulated flour 4
The consistent inclusion of corn bran across all formulations by the LP suggests its significance in achieving high fiber content. The addition of sweet potato flour and sorghum bran in formulated flours 3 and 4 introduces diversity in nutrient profiles, potentially enhancing the overall nutritional value and functional properties of the flours. This strategic combination of ingredients aligns to create healthier, high-fiber flour options suitable for diabetic patients.
Table 3 presents the functional properties of the formulated flours. Formulation 1 consists of white wheat flour and corn bran; formulation 2 includes white wheat flour, corn bran, and sorghum bran; formulation 3 comprises white wheat flour, corn bran, sweet potato flour, and sorghum bran; formulation 4 contains white wheat flour, corn bran, and sweet potato flour; and the control is made solely of wheat flour.
Functional properties (WAC, OAC, FC, FS, and swelling power) of four formulated flours
| Samples | WAC (g/g) | OAC (g/g) | FC (%) | FS (%) | Swelling power (cm3/g) |
|---|---|---|---|---|---|
| F1 | 2.03 ± 0.03a | 2.41 ± 0.04ab | 9.52 ± 0.00b | 4.58 ± 0.41a | 1.87 ± 0.15ab |
| F2 | 1.95 ± 0.12a | 2.56 ± 0.21ab | 7.59 ± 0.64a | 4.28 ± 0.36a | 2.03 ± 0.21b |
| F3 | 2.06 ± 0.09a | 2.70 ± 0.10c | 9.52 ± 0.00b | 6.28 ± 0.41b | 1.27 ± 0.15a |
| F4 | 2.05 ± 0.07a | 2.37 ± 0.19ab | 9.52 ± 0.00b | 6.52 ± 0.00b | 1.63 ± 0.15a |
| Control | 1.88 ± 0.02a | 2.13 ± 0.24a | 19.04 ± 0.00c | 8.00 ± 0.00c | 1.50 ± 0.10a |
WAC: water absorption capacity; OAC: oil absorption capacity; FC: foaming capacity; FS: foaming stability; F1: white wheat flour, corn bran flour; F2: white wheat flour, corn bran, sorghum bran; F3: white wheat flour, corn bran, sweet potato flour, and sorghum bran; F4: white wheat flour, corn bran, sweet potato flour; Control: wheat flour. Values carrying different superscripts (a, b, c) in the same column are statistically significant (P < 0.05)
The WAC of the formulated flours ranges from 2.06% (formulation 3) to 1.95% (formulation 2). Statistical analysis indicates that all formulated flours exhibit water absorption capacities that are not significantly different from the control wheat flour (P ≥ 0.05). The OAC varies from 2.13% to 2.70%, with formulation 3 displaying the highest value and the control showing the lowest. Formulations 1, 2, and 4 exhibit oil absorption capacities similar to the control.
The FC ranges from 7.59% (Formulation 2) to 19.04% (control). Formulations 1, 3, and 4 have similar foaming capacities. Regarding FS, the values range from 4.28% (Formulation 2) to 8.00% (control). Formulations 1 and 2 exhibit the lowest FS, while formulations 3 and 4 show intermediate values.
The swelling power ranges from 1.27 cm3/g (formulation 3) to 2.03 cm3/g (formulation 2). The swelling power of the control is statistically similar to that of formulations 1, 3, and 4.
In summary, the functional properties of the formulated flours demonstrate variations in OAC, FC, FS, and swelling power. However, the WAC remains consistent across all formulations compared to the control. These findings suggest that the addition of different bran and flour types influences the functional properties of the formulated flours, with some formulations showing enhanced properties compared to the control.
The analysis of the formulated flours (F1–F4) reveals notable nutritional improvements compared to the control sample (Table 4). While the water content of the formulated flours varies slightly from 7.22% to 8.84%, these values are statistically similar to those of the control for most formulations (F1 and F4), indicating no significant change in moisture levels. However, all formulated flours exhibit a statistically higher ash content, ranging from 0.89% to 2.02%, compared to the control’s 0.67%, suggesting enhanced mineral content. Furthermore, the fiber content in the formulated flours is significantly higher, with values ranging from 7.49% to 9.56%, compared to the control’s 3.06%. This is particularly notable for formulation F3, which has more than triple the fiber content of the control. These findings demonstrate that the formulated flours possess superior nutritional qualities, with higher mineral and fiber contents, without substantially altering the moisture levels.
Water content, dry matter, ash, and fiber contents of the formulated flours
| Sample | Water content (%) | Ash content (%) | Fiber content (%) |
|---|---|---|---|
| F1 | 7.22 ± 0.26c | 0.97 ± 0.01c | 7.49 ± 0.07b |
| F2 | 8.84 ± 0.06e | 0.89 ± 0.01b | 8.71 ± 0.06d |
| F3 | 8.27 ± 0.49d | 1.14 ± 0.01d | 9.56 ± 0.04e |
| F4 | 8.09 ± 0.07cd | 2.02 ± 0.02e | 8.19 ± 0.02c |
| Control | 7.65 ± 0.18c | 0.67 ± 0.01a | 3.06 ± 0.05a |
F1: white wheat flour, and corn bran; F2: white wheat flour, corn bran, and sorghum bran; F3: white wheat flour, corn bran, and sweet potato flour, and sorghum bran; F4: white wheat flour, corn bran, and sweet potato flour; Control: wheat flour. Values carrying different superscripts (a, b, c, d, e) in the same column are statistically significant (P < 0.05)
The sensory evaluation of biscuits prepared from the formulated flours, as presented in Figure 1, reveals variations in panelists’ perceptions across different attributes, yet generally aligns with the control sample. Color perception was rated as “slightly pleasant” for all biscuit samples (P ≥ 0.05), with scores ranging from 5.4 (biscuit 4) to 5.8 (control). Aroma followed a similar trend, with all samples receiving “slightly pleasant” ratings, scoring between 5.7 (biscuit 1) and 6.0 (biscuit 4) (P ≥ 0.05). Texture perception was also deemed “slightly pleasant” across all samples (P ≥ 0.05), with scores from 5.5 (biscuit 2) to 6.1 (biscuit 1). Taste perception was statistically similar and “slightly pleasant” for all samples (P ≥ 0.05), with scores between 5.9 (biscuit 1) and 7.1 (biscuit 2). General acceptability was likewise statistically similar and “slightly pleasant” for all samples, with scores ranging from 6.0 (biscuit 2) to 6.6 (biscuit 4 and control) (P ≥ 0.05). Overall, the sensory evaluation indicates that biscuits made from the formulated flours are well-accepted and comparable to the control sample across all attributes.
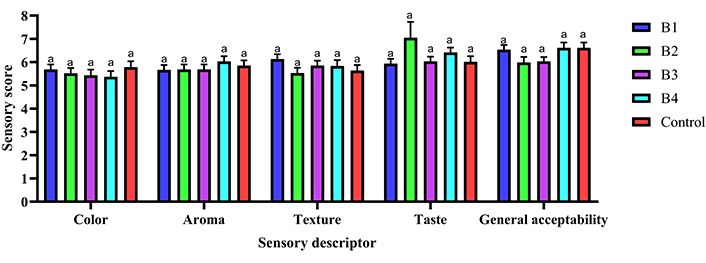
Hedonic attributes of high-fiber biscuits in terms of color, smell, texture, taste, and general acceptability. B1: biscuit made from formulated flour 1; B2: biscuit made from formulated flour 2; B3: biscuit made from formulated flour 3; B4: biscuit made from formulated flour 4; Control: biscuit made from wheat flour. Bars labeled with different superscripts (a) for the same sensory descriptor indicate statistically significant differences (P < 0.05)
Table 5 displays the physical properties (thickness, diameter, and weight) of the high-fiber biscuits, revealing that they generally align with the control sample in most aspects. The thickness varied from 0.32 cm (biscuit 1) to 0.47 cm (biscuit 4), with the control sample being statistically similar to all high-fiber biscuits (P ≥ 0.05). The diameter of the biscuits ranged from 4.67 cm (biscuit 1) to 5.47 cm (biscuit 3), with the control sample exhibiting statistically similar diameters to all high-fiber biscuits (P ≥ 0.05). In terms of weight, the range was from 6.20 g (control) to 7.97 g (biscuit 4), with the control sample being statistically similar to biscuits 1, 2, and 3. The spread ratio was found to vary from 10.70 (biscuit 4) to 15.02 (biscuit 1), with the control being statistically similar to all high-fiber biscuits (P ≥ 0.05). Overall, the physical properties (thickness, diameter, weight, and spread ratio) of the high-fiber biscuits were statistically similar to those of the control sample, indicating that the incorporation of high-fiber ingredients did not significantly alter these characteristics.
Thickness, diameter, and weight of the high-fiber biscuits
| Parameter | B1 | B2 | B3 | B4 | Control |
|---|---|---|---|---|---|
| Thickness (cm) | 0.32 ± 0.05a | 0.36 ± 0.02ab | 0.42 ± 0.02ab | 0.47 ± 0.02b | 0.35 ± 0.01ab |
| Diameter (cm) | 4.67 ± 0.12a | 5.17 ± 0.07ab | 5.47 ± 0.09b | 5.03 ± 0.07ab | 5.23 ± 0.22ab |
| Weight (g) | 6.87 ± 0.27ab | 7.13 ± 0.30ab | 7.03 ± 0.13ab | 7.97 ± 0.66b | 6.20 ± 0.17a |
| Spread ratio | 15.02 ± 1.99a | 14.36 ± 1.05a | 13.04 ± 0.38a | 10.70 ± 0.65a | 14.91 ± 1.19a |
| L* | 67.40 ± 5.02a | 66.17 ± 2.28a | 54.93 ± 4.11a | 64.73 ± 3.08a | 68.73 ± 6.54a |
| a* | 19.93 ± 5.71a | 18.03 ± 4.13a | 30.70 ± 3.99a | 15.97 ± 6.15a | 12.57 ± 1.57a |
| b* | 48.33 ± 4.41a | 39.87 ± 15.19a | 52.53 ± 2.12a | 51.37 ± 8.19a | 50.70 ± 3.17a |
| Browning index | 29.01 ± 8.98a | 25.57 ± 7.29a | 47.99 ± 7.13a | 25.61 ± 8.25a | 20.82 ± 2.83a |
B1: biscuit made from formulated flour 1; B2: biscuit made from formulated flour 2; B3: biscuit made from formulated flour 3; B4: biscuit made from formulated flour 4; Control: biscuit made from wheat flour; L*: lightness; a*: position of color in the green-red axis; b*: position of color in the blue-yellow axis. Values carrying different superscripts (a, b) in the same row are statistically significant (P < 0.05)
The color features and browning index of the formulated biscuits highlight notable differences from the control sample. The lightness (L*) of the high-fiber biscuits ranged from 54.93 (biscuit 3) to 68.73 (control), with the control being statistically similar to all high-fiber biscuits (P ≥ 0.05). The red-green component (a*) indicated that all biscuits exhibited a red color, with the control (12.57) showing similar red intensity to that of all high-fiber biscuits (P ≥ 0.05) and suggesting a similar intense red hue in all biscuits. Regarding the yellow-blue component (b*), all formulated biscuits and the control displayed statistically similar yellow intensity. Overall, all biscuits exhibit a reddish-yellow hue. The browning index was found to be similar in all biscuits. Overall, all biscuits exhibited a reddish-yellow hue, with a similar browning index across all samples.
Table 6 delineates the nutritional profile of high-fiber biscuits, highlighting significant disparities compared to the control sample. The energy content varied from 442.98 kcal (biscuit 1) to 478.56 kcal (biscuit 4), with the control sample exhibiting a lower energy content compared to biscuits 2, 3, and 4 (P < 0.05). Water content ranged from 1.22% (biscuit 3) to 2.51% (control), with the control sample displaying the highest water content (P < 0.05). Protein content spanned from 9.12% (control) to 11.31% (biscuit 1), with the control sample showing the lowest protein content (P < 0.05). Lipid content varied from 19.87% (control) to 24.10% (biscuit 4), with formulated biscuits 2, 3, and 4 exhibiting higher lipid content compared to the control (P < 0.05). Carbohydrate content ranged from 50.88% (biscuit 1) to 59.68% (control), with formulated biscuits 1, 2, and 4 having lower carbohydrate content compared to the control (P < 0.05). In contrast, the fiber content of the formulated biscuits 1 and 4 was statistically higher than that of the control (P < 0.05), ranging from 5.78% (control) to 12.44% (biscuit 1). Overall, the high-fiber biscuits exhibited significant nutritional differences compared to the control sample, including higher energy, protein, lipid, and fiber content, as well as lower water and carbohydrate content. These findings underscore the substantial impact of fiber incorporation on the nutritional profile of the biscuits.
Protein, lipid, carbohydrate, fiber, and energy contents of formulated biscuits
| Content | B1 | B2 | B3 | B4 | Control |
|---|---|---|---|---|---|
| Energy (kcal) | 442.98 ± 1.60a | 473.49 ± 2.88c | 473.22 ± 1.37c | 478.56 ± 0.34c | 453.98 ± 3.44b |
| Water (%) | 2.20 ± 0.07b | 2.20 ± 0.02b | 1.22 ± 0.09a | 1.49 ± 0.08a | 2.51 ± 0.25b |
| Protein (%) | 11.31 ± 0.04e | 10.70 ± 0.03d | 9.71 ± 0.03c | 9.48 ± 0.01b | 9.12 ± 0.02a |
| Lipid (%) | 21.58 ± 0.13ab | 23.09 ± 0.57bc | 21.79 ± 0.17b | 24.10 ± 0.12c | 19.87 ± 0.54a |
| Carbohydrates (%) | 50.88 ± 0.14a | 55.7 ± 0.57b | 59.57 ± 0.05c | 55.93 ± 0.22b | 59.68 ± 0.70c |
| Fiber (%) | 12.44 ± 0.17c | 6.06 ± 0.04a | 6.18 ± 0.06ab | 6.73 ± 0.05b | 5.78 ± 0.22a |
| Zn (ppm) | 3.37 ± 0.12ab | 3.68 ± 0.06b | 3.41 ± 0.06ab | 2.96 ± 0.05a | 3.79 ± 0.07b |
| Fe (ppm) | 4.55 ± 0.41c | 3.52 ± 0.21bc | 3.03 ± 0.02b | 3.01 ± 0.02b | 1.49 ± 0.07a |
| Mg (ppm) | 78.05 ± 0.08d | 34.37 ± 0.36b | 36.42 ± 0.22bc | 38.41 ± 0.35c | 28.14 ± 0.69a |
| Na (ppm) | 174.03 ± 0.03a | 205.13 ± 0.03d | 200.34 ± 0.24c | 262.04 ± 0.64e | 189.74 ± 0.50b |
| Ca (ppm) | 170.16 ± 0.17a | 223.63 ± 0.52d | 202.61 ± 0.53c | 204.09 ± 1.61c | 189.74 ± 0.50b |
| P (ppm) | 218.63 ± 0.13a | 281.49 ± 3.37c | 287.45 ± 0.03c | 257.11 ± 0.11b | 218.98 ± 4.13a |
B1: biscuit made from formulated flour 1; B2: biscuit made from formulated flour 2; B3: biscuit made from formulated flour 3; B4: biscuit made from formulated flour 4; Control: biscuit made from wheat flour; ppm: parts per million. Values carrying different superscripts (a, b, c, d, e) in the same row are statistically significant (P < 0.05)
The mineral content of the high-fiber biscuits highlights several notable differences compared to the control sample. The Zn content ranged from 2.96 ppm (biscuit 4) to 3.79 ppm (control), with the control and high-fiber biscuits 1, 2, and 3 exhibiting the highest Zn content compared to the biscuit 4 (P < 0.05). Fe content varied from 1.49 ppm (control) to 4.55 ppm (biscuit 1), with all high-fiber biscuits showing greater Fe content than the control (P < 0.05). Mg content ranged from 28.14 ppm (control) to 78.05 ppm (biscuit 1), with all high-fiber biscuits having greater Mg content than the control (P < 0.05). Na content varied from 174.03 ppm (biscuit 1) to 262.04 ppm (biscuit 4), with the control’s Mg content being significantly higher than that of biscuit 1 (P < 0.05). Calcium content ranged from 170.16 ppm (biscuit 1) to 223.63 ppm (biscuit 2), with the control’s calcium content being greater than only biscuit 1 (P < 0.05). Phosphorus content oscillated between 218.63 ppm (biscuit 1) and 287.45 ppm (biscuit 3), with the control and biscuit 1 having the lowest phosphorus content (P < 0.05). Overall, the formulated biscuits exhibit enhanced mineral profiles, particularly in terms of Fe and Mg content, compared to the control.
Table 7 summarizes the antioxidant properties and phenolic content of the high-fiber biscuits, highlighting notable differences compared to the control sample. The phenolic content ranged from 201.91 mg GAE/100 g (control) to 503.18 mg GAE/100 g (biscuit 3), with the control exhibiting the lowest phenolic content compared to the high-fiber biscuits (P < 0.05), indicating that the formulated biscuits are richer in phenolic compounds. The antiradical activity, as indicated by the DPPH scavenging activity, varied from 0.07 μg/mL (biscuits 3 and 4) to 0.27 μg/mL (Control). All high-fiber biscuits showed higher DPPH-scavenging activities compared to the control (P < 0.05), suggesting enhanced free radical scavenging capabilities. However, the Fe-reducing activity ranged from 6.43 μg/mL (control) to 39.05 μg/mL (biscuit 3). Notably, the control exhibited the highest Fe-reducing activity compared to all high-fiber biscuits. This indicates that, despite their higher phenolic content and DPPH-scavenging activity, the high-fiber biscuits have lower Fe-reducing capabilities compared to the control. Overall, while the high-fiber biscuits demonstrate improved antiradical activity and phenolic content, they lag behind the control in terms of Fe-reducing activity.
DPPH-scavenging and Fe-reducing activities and phenolic content of formulated biscuits
| Sample | Phenolic content (mg GAE/100 g) | DPPH IC50 (µg/mL) | FRAP IC50 (µg/mL) |
|---|---|---|---|
| B1 | 336.31 ± 1.10b | 0.12 ± 0.00c | 20.00 ± 0.41b |
| B2 | 444.59 ± 2.78c | 0.09 ± 0.00b | 24.76 ± 1.04c |
| B3 | 503.18 ± 2.78e | 0.07 ± 0.00a | 39.05 ± 0.86d |
| B4 | 457.96 ± 3.87d | 0.07 ± 0.00a | 23.57 ± 0.82c |
| Control | 201.91 ± 2.30a | 0.27 ± 0.01d | 6.43 ± 0.41a |
B1: biscuit made from formulated flour 1; B2: biscuit made from formulated flour 2; B3: biscuit made from formulated flour 3; B4: biscuit made from formulated flour 4; Control: biscuit made from wheat flour. Values carrying different superscripts (a, b, c, d, e) in the same column are statistically significant (P < 0.05)
Figure 2 shows the in vitro glucose binding reduction rate of the control biscuit and formulated biscuits (2 and 3), revealing notable differences in their glucose binding capacities. The reduction rate varies from 37.0% to 51.5% for formulated biscuit 2, from 32.1% to 52.4% for formulated biscuit 3, and from 16.8% to 37.5% for the control. On average, biscuit 3 has a statistically higher reduction rate (43.4 ± 4.3%) compared to the control (27.8 ± 4.3%) (P < 0.05), indicating superior glucose binding capacity. However, biscuit 2 has an average reduction rate (41.1 ± 3.1%) statistically similar to that of the control (P ≥ 0.05). Additionally, the findings indicate that the highest reduction rate is observed at a sample weight of 25 mg for biscuits 2 and 3, whereas the highest reduction rate for the control is observed at a sample weight of 30 mg. This suggests that the formulated biscuits, particularly biscuit 3, may have enhanced potential in managing glycemic responses compared to the control biscuit.
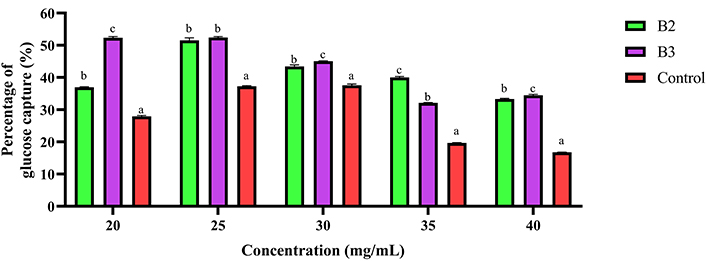
Reduction rate of the control, biscuits 2 and 3 at different concentrations of food samples. B2: biscuit made from formulated flour 2; B3: biscuit made from formulated flour 3; Control: biscuit made from wheat flour. Bars carrying different superscripts (a, b, c) for the same concentration are statistically significant (P < 0.05)
Biscuits 2 and 3 were chosen for the next steps because of their superior nutritional qualities, positive sensory evaluations, enhanced mineral content, and improved antioxidant properties. These biscuits not only meet but also exceed the standards set by the control sample, making them strong candidates for further investigation.
Figure 3 illustrates the glycemic response to glucose, control, and biscuits 2 and 3 over time, highlighting notable differences in their impacts on blood glucose levels. In response to glucose, glycemia significantly increased from 83.33 mg/dL to 109.67 mg/dL within the first 30 min (P = 0.047), after which it remained constant for the subsequent 60 min (P ≥ 0.05). For the control, glycemia remained constant from 0 to 60 min (P ≥ 0.05) but significantly decreased at 90 min compared to the initial level (P = 0.026). In contrast, the consumption of biscuit 2 resulted in statistically constant glycemia throughout the study period (0 to 90 min) (P ≥ 0.05). Similarly, for biscuit 3, glycemia remained statistically constant throughout the study period (0 to 90 min) (P ≥ 0.05). Thus, biscuits 2 and 3 demonstrate the ability to maintain steady blood glucose levels over the studied period, unlike the glucose solution and the control, which showed more fluctuation.
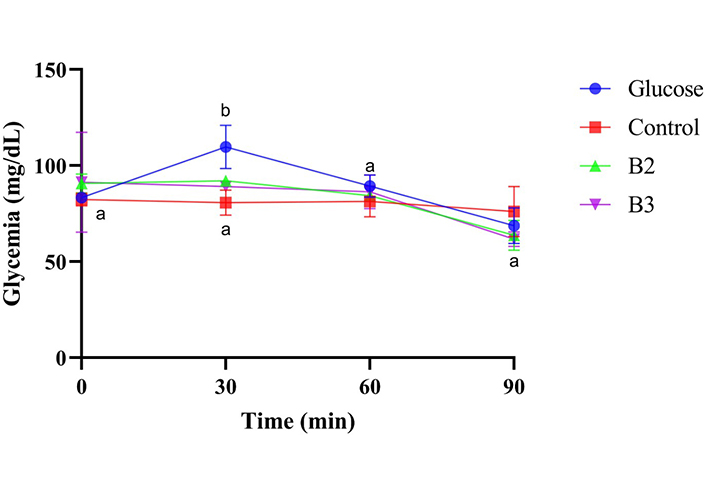
Postprandial glycaemic responses of different biscuits on normal male rats. B2: biscuit made from formulated flour 2; B3: biscuit made from formulated flour 3; Control: biscuit made from wheat flour. Points labeled with different superscripts (a, b) for the same sample (glucose, control, B2, or B3) indicate statistically significant differences (P < 0.05)
The results of the LP indicated that corn bran was included in all flour formulations. The inclusion of corn bran in flour formulations is increasingly recognized for its significant role in enhancing dietary fiber content, which is essential for promoting digestive health. Research indicates that maize bran-enriched flour contains substantially more dietary fiber compared to traditional wheat flour. For instance, total dietary fiber content in formulations with increasing levels of maize bran (5%, 10%, and 15%) showed marked increases from 3.38% in wheat flour to 15.41% in the highest maize bran formulation [42]. Moreover, the incorporation of sweet potato flour and sorghum bran in formulated flours 3 and 4 enriches the nutrient profile by providing essential vitamins and minerals, as well as phytochemicals with antioxidant properties [43, 44].
In this study, the functional properties of the formulated flours demonstrate variations in OAC, FC, FS, and swelling power. The enhanced OAC of flours is closely linked to their fiber and protein content, which significantly influences the mouthfeel and sensory characteristics of food products. Soluble fiber can absorb oil effectively due to its ability to form gels when mixed with liquids. Such gel formation not only enhances moisture retention but also contributes to a desirable texture in food products [45]. Certain proteins exhibit emulsifying properties that stabilize oil-in-water mixtures, leading to improved mouthfeel and texture in various food applications, such as sauces and batters [46]. Moreover, the enhancement of FC and stability suggests that the formulations can be optimized for applications requiring aeration, such as in baked goods, thereby potentially improving quality [47, 48]. Interestingly, the consistent WAC across all flour formulations compared to the control indicates that while bran and flour diversity can modify some functional attributes, they do not compromise the water retention qualities essential for dough and batter integrity. However, research has indicated that the addition of brans in flours is consistent with increased water absorption influenced by the methods used to incorporate the bran, the specific types, and the amount of bran used conditioning the compositions of fiber, protein, and other components that can affect water absorption [49, 50]. In this study, the fiber and ash contents were found to be greater than that of the control. Thus, it appears that while the addition of bran or other high-fiber ingredients enhanced the nutritional profile of the flours, it did not necessarily translate into higher water retention capabilities compared to the control wheat flour. This suggests that the specific types of bran or how they were incorporated might have influenced the water absorption properties differently than expected.
The water content of the formulated flours was found to range between 7.22% and 8.84%, the ash content was found to vary from 0.97% to 2.02%, and the fiber content fluctuated between 8.19% and 9.56%. All the formulated flours fell well within the technical specifications for biscuit flour concerning water content which should not exceed 12%. However, regarding ash content, only F1, F2, and F3 met the technical specifications for biscuit flour that the ash content should be between 0.8% and 1.3% [25]. This indicates that the flours are suitable for biscuit production in terms of moisture levels, ensuring that the dough will have the appropriate consistency and handling properties. Formulations with ash content outside the recommended range may not be ideal for biscuit production, as higher ash content can increase WAC due to the higher presence of bran, affecting dough consistency and handling properties [51]. This enhancement in fiber content can improve the nutritional value of the biscuits, contributing to better digestive health and potentially other health benefits. However, the impact of higher fiber content on the sensory properties of biscuits and the rheological properties of the dough needs to be considered, as excessive fiber could affect these properties [52].
The acceptance of biscuits made from bran-enriched flour blends, which were found to be comparable to control wheat-based biscuits across all evaluated attributes, highlights the potential of incorporating bran in improving the nutritional profile without compromising sensory quality. An acceptability study revealed that consumer preference is closely linked to flavor, texture, and overall palatability, which can be minimally modified through the strategic use of bran flours [53]. Thus, the sensory characteristics of the biscuits indicate that the incorporation of bran did not detract from the desirable properties typically associated with traditional wheat biscuits, suggesting a promising avenue for developing functional baked goods that cater to health-conscious consumers.
The statistical similarity in the physical properties (thickness, diameter, weight, and spread ratio) between high-fiber biscuits and control wheat-based biscuits indicates that integrating high-fiber ingredients does not adversely affect these essential characteristics. Additionally, the consistent reddish-yellow hue and comparable browning index across all samples suggest that the high-fiber formulations maintain the visual appeal typical of traditional biscuits, which is vital for consumer acceptance. These results are consistent with research demonstrating that manufacturers can successfully incorporate high-fiber ingredients while preserving both the structural integrity and aesthetic qualities consumers expect from conventional products [54, 55]. Overall, this research supports the feasibility of producing visually appealing and structurally sound high-fiber biscuits that align with consumer health trends.
The high-fiber biscuits demonstrated significant nutritional improvements over the control sample, showing increased levels of energy, protein, lipids, and fiber while having reduced water and carbohydrate content. Additionally, these formulated biscuits exhibited a superior mineral profile, particularly with elevated Fe and Mg levels, enhancing their nutritional value. The fiber content in the formulated biscuits satisfies between 42.8% and 85.7% of the dietary recommendations for children aged 24 months to 59 months [56]. The Fe content in these biscuits meets between 42.8% and 65.0% of the dietary recommendations for the same age group, while the Mg content fulfills between 43.0% and 97.5% of the dietary recommendations for children aged 1 year to 3 years [57]. This indicates that incorporating high-fiber ingredients not only boosts the overall nutritional content but also provides essential minerals, aligning with current dietary recommendations for increased fiber and mineral intake. The enhanced nutritional attributes of these biscuits suggest that they can effectively contribute to better health outcomes, making them a beneficial option for consumers seeking healthier snack alternatives.
The high-fiber biscuits exhibited enhanced antiradical activity and elevated phenolic content. Previous studies have shown that enriched biscuits possess higher polyphenol concentrations retained after intestinal digestion, endorsing its better antioxidant, and antiradical [58, 59]. This indicates the potential of high-fiber biscuits as beneficial snacks with antioxidant properties. However, they showed lower Fe-reducing activity compared to the control biscuits.
The high-fiber biscuits, B2 and B3, demonstrated significant in vitro glucose binding capacities and effectively maintained stable blood glucose levels in rats throughout the study period, indicating their potential for glycemic control. Both biscuits incorporated sorghum and corn brans. Previous studies have already established the enhanced glucose absorption capacity and in vitro hypoglycemic ability of corn bran and value-added nutritious biscuits [60–62], thereby supporting the observed glucose binding capacity and glycemic control properties of the studied biscuits. These findings indicate that the incorporation of high-fiber ingredients may help regulate blood sugar levels, presenting these biscuits as a beneficial option for individuals managing diabetes or seeking stable energy levels. Overall, the ability of these high-fiber biscuits to influence glucose metabolism highlights their relevance in developing functional foods tailored for better health outcomes, particularly concerning blood sugar management.
Future research should focus on clinical trials to validate the long-term effects of these biscuits on glycemic control and explore their potential in managing other metabolic disorders. Additionally, investigating the impact of different processing methods and the inclusion of other functional ingredients could further optimize the nutritional benefits of these biscuits.
To summarize, the study demonstrated that incorporating diverse bran and flour types in biscuit formulations significantly improved their nutritional and functional properties compared to the control sample. The formulated biscuits exhibited enhanced levels of fiber, ash, protein, and essential minerals while maintaining favorable sensory qualities and comparable physical attributes. Notably, biscuits 2 and 3 showed superior antioxidant properties and maintained stable blood glucose levels over 90 min, with biscuit 3 having the highest in vitro glucose binding capacity. These findings suggest that these high-fiber biscuits are promising alternatives for managing blood sugar levels, making them suitable for individuals with diabetes.
DVs: decision variables
FC: foaming capacity
FS: foaming stability
LP: linear programming
OAC: oil absorption capacity
OF: objective function
ppm: parts per million
WAC: water absorption capacity
The authors would like to express their gratitude to all the participants who took part in the sensory evaluation, whose valuable insights greatly contributed to the findings of this study.
BUFS: Conceptualization, Methodology, Formal analysis, Writing—original draft. ATC: Conceptualization, Methodology, Visualization. IT: Conceptualization, Formal analysis. NYJ: Methodology, Investigation, Data curation. GGMM: Methodology, Investigation, Data curation. NJKE: Methodology, Investigation, Data curation. ATD: Methodology, Investigation, Data curation. LKN: Supervision, Validation, Writing—review & editing. All authors read and approved the submitted version.
The authors declare that they have no conflicts of interest.
The study was approved by the Ethical Review Committee of the University of Bamenda, Cameroon (approval number: 2024/0163H/UBa/IRB) and complied with the Declaration of Helsinki. Animal management adhered to the guidelines set forth by the European Communities Council Directive 86/609/EEC for the care and use of experimental animals.
Voluntary agreement from individuals to taste and evaluate these biscuits was obtained. Participants were fully informed about the study’s purpose, the nature of the biscuits, any potential risks (such as allergens), and the evaluation process. They are assured of their right to withdraw at any time without consequence. Participants know their role and rights to maintain ethical standards in the research.
Not applicable.
The original data underpinning the conclusions presented in this manuscript will be accessible to any qualified researcher upon request, without any undue reservation from the authors.
Not applicable.
© The Author(s) 2025.
Open Exploration maintains a neutral stance on jurisdictional claims in published institutional affiliations and maps. All opinions expressed in this article are the personal views of the author(s) and do not represent the stance of the editorial team or the publisher.
Copyright: © The Author(s) 2025. This is an Open Access article licensed under a Creative Commons Attribution 4.0 International License (https://creativecommons.org/licenses/by/4.0/), which permits unrestricted use, sharing, adaptation, distribution and reproduction in any medium or format, for any purpose, even commercially, as long as you give appropriate credit to the original author(s) and the source, provide a link to the Creative Commons license, and indicate if changes were made.

Leonel Pereira
Micaela Antón ... Rafael Borneo
Rut Domínguez ... Manuel Domínguez
Eliseo Sánchez-Loredo ... Juan A. Ascacio-Valdés
Ayla Elmi Kashtiban ... Sayna Zahedinia
Shafa’atu Giwa Ibrahim, Roselina Karim
Olamide Akande ... Daniel Ajewole
Evans Ntim Amedor ... James Owusu-Kwarteng
Luís M.G. Castro ... Manuela Pintado
José Pinela, José Ignacio Alonso-Esteban
