Original Article

Affiliation:
Laboratory of Food Materials Science and Engineering, The United Graduate School of Agricultural Sciences of Iwate University, Constituent University, Hirosaki University, Hirosaki 036-8561, Japan
Email: yukisato@hirosaki-u.ac.jp
ORCID: https://orcid.org/0000-0001-5737-3498
Explor Foods Foodomics. 2025;3:101080 DOI: https://doi.org/10.37349/eff.2025.101080
Received: November 15, 2024 Accepted: March 06, 2025 Published: April 01, 2025
Academic Editor: Cem Erkmen, Istanbul Aydin University, Türkiye
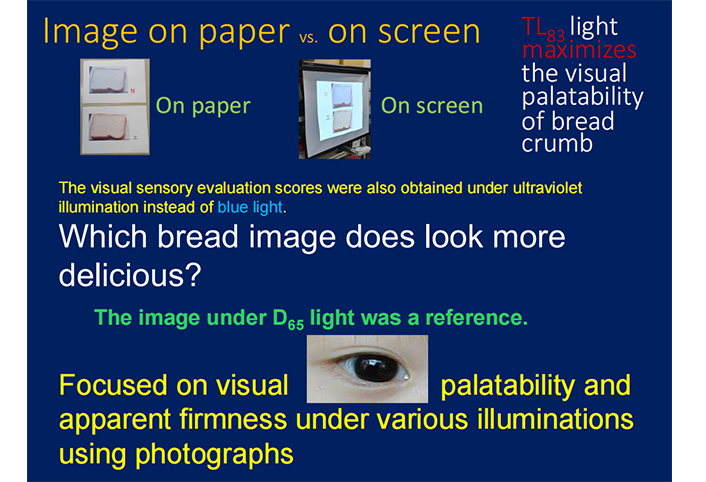
Aim: Single tests have been used for the sensory evaluation of food. Although food color is the first perception used to determine acceptability, this study was performed to enhance the reliability of evaluations of the visual palatability of the crumb of bread (bread crumb) by reducing ambiguity in the tests.
Methods: The optimal illumination color temperature to enhance the visual palatability of white bread crumb was determined by sensory evaluation using photographs with 13 participants in the main test and 27 participants in the retest, and correlations with visual palatability were assessed using coefficients of determination (R2).
Results: Illumination color temperature showed a linear relation with the visual palatability of photographs of the crumb, while the light source with the lowest color temperature was associated with lower palatability scores compared to those with a slightly higher color temperature, as shown by duplicate tests. Ultraviolet (UV) illumination was also added as a purple and blue light source, and the linear correlation between visual palatability and visual firmness showed a high R2. Sensory evaluation measurement using a projector, instead of paper-based measurement, was also examined as a simpler method without the need for paper. The correlations with sensory scores showed correspondence between these measurements.
Conclusions: High sensory scores for visual palatability were associated with lower visual firmness scores, even with the addition of data obtained under UV light. In addition, sensory evaluation measurement using a projector was confirmed to be useful. Finally, the optimal light source for the crumb of white bread was TL83. While warmer illumination has conventionally been preferred to enhance consumer food acceptance, the results presented here highlight the need for a detailed analysis of the effects of illumination color temperature on visual palatability.
The widespread use of single tests in the sensory evaluation of food reduces reliability [1]. The International Organization for Standardization (ISO) has developed ISO 8586 [2], which refers to agreement in food sensory evaluation tests based on repeatability and reproducibility. Nevertheless, the use of single tests in food sensory evaluations persists [1]. Despite efforts to enhance the reliability of sensory evaluation results by increasing the number of participants, with reports citing 7 [3], 10 [4–7], 20 [8], 30 [9, 10], and 44 [11] participants, the repeatability and reproducibility of sensory evaluation tests remains poor. Among nine selected papers describing the sensory evaluation of bread, only one mentioned appreciation of the color of the bread at first baking and crust color appreciation at second baking [10]. However, the illumination conditions were ambiguous, although it was concluded that the white color of the crumb of bread (bread crumb) is an important parameter guiding consumer preference [10].
In general, the physical condition of participants influences their sensory evaluation scores. Compared with the initial intake, food samples consumed later make participants feel fuller [1]. Notably, food purchase intention was not influenced by hunger status when sensory evaluation was conducted using different illumination sources without consumption [12]. Therefore, visual food sensory evaluation methods may be advantageous to avoid the hunger status of participants.
Sato [1] used five different light sources to investigate the effects of image illumination on the visual palatability and visual firmness of white bread crumbs. An Excel file that could convert RGB (red-green-blue) color values to L*a*b* (lightness, green-red axis, blue-yellow axis) space was established to compare the RGB color of the crumb on a computer screen with the results obtained using printed photographs distributed to participants. Brosnan et al. [13] described that the appearance of baked products is an important quality attribute, and features of appearance were evaluated using computer vision. However, to date, few reports on the visual palatability of white bread crumb have been published, especially in the case of using images projected on a screen. In this study, to confirm the repeatability and reproducibility of this visual bread sensory evaluation test, sensory scores obtained under ultraviolet (UV) illumination instead of blue light as used by Cho et al. [14], were obtained. Moreover, a novel sensory evaluation method was proposed using crumb images presented on a screen via a commercial projector.
The bread was made using a formulation described previously [1, 15]. Briefly, bread made using 250 g of commercial wheat flour (Camellia; Nisshin Foods, Manufacturer No. 2623798, Lot No. D, Tokyo, Japan) as the basic ingredient (100%) consisted of butter (4%), sugar (6.8%), salt (2%), water (72%), and dried yeast (1.12%) [1]. To avoid variation in individual kneading styles, the bread was made using an automatic bread-making machine (SD-RBM; Panasonic, Osaka, Japan) set to mode number 11 [1]. At 2 h after baking [15, 16] (to allow the bread to cool to room temperature), a 25-mm-thick slice of bread was cut using a commercial breadknife (AC-0059; Kaijirushi, Tokyo, Japan).
The same crumb was illuminated with five different light sources (F, TL83, TL84, CWF, D65) in a color assessment cabinet (P60; Huanyu, Shenzhen, China) (5,400 mm × 7,100 mm × 5,500 mm) [1]. A UV light source was added, and the visual palatability and visual firmness of the crumb were compared under different illuminations. The UV light source emits purple light and a faint blue glow, although the main wavelength is not in the visible light spectrum. The color temperatures (K) of the five light sources were: F, 2,731; TL83, 3,056; TL84, 4,057; CWF, 4,126; and D65, 6,529 [1]. The illumination intensities (lx) were: F, 612; TL83, 1,771; TL84, 2,395; CWF, 1,221; and D65, 2,575 [1].
A commercial digital camera with a GR lens (focal length = 18.3 mm, equivalent focal length approximately 28–35 mm; GRIII; RICOH, Tokyo, Japan) was used to generate approximately 24.24 million-pixel images as dng files [1]. The identity of the white bread photographs distributed to participants was confirmed statistically.
Sensory evaluation of the visual palatability and visual firmness of the crumb of white bread was performed using printed images of the crumb of bread baked with the typical formulation outlined above [1]. The visual palatability and visual firmness of the crumb were assessed using images in dng format under six illuminations, including UV light. The images of the crumb of the bread were printed using a commercial laser printer (LBP-841C; Canon, Tokyo, Japan). Twenty-seven participants with a mean ± standard deviation age of 20.2 ± 0.4 years were recruited from among students at Hirosaki University. Palatability and firmness were scored on a seven-point scale (−3, −2, −1, 0, +1, +2, +3) [1, 15] using an image of white bread taken under D65 illumination as a reference [1]. Higher scores indicated greater palatability or greater visual firmness. Based on randomization principles, only untrained participants were recruited for the visual sensory evaluations [15, 17]. The arithmetic means of the visual palatability and visual firmness scores were calculated. The experimental procedure was explained thoroughly to all participants, and they all provided written informed consent.
This study was performed to enhance the reliability of evaluations of the visual palatability of bread crumb images by using duplicate tests.
A method for sensory evaluation of the visual palatability and visual firmness of white bread was developed using images presented on a screen with a projector (EB-W06; Seiko Epson, Suwa, Japan). This measurement method was based on a procedure using printed images of the crumb of the bread taken under various illumination light sources, including UV light, but instead used images projected on a screen. The participants assessed images of white bread crumb presented simultaneously on the screen. The image slide consisted of an image of the crumb of white bread photographed under illumination with the D65 light source on the upper side and the “experimental crumb image” on the lower side. All participants assessed visual palatability and visual firmness using the seven-point scale outlined above. This procedure was also explained to all participants, and they all provided written informed consent.
The reliability of the evaluations of the visual palatability of bread crumb using images presented on a screen was confirmed using duplicate tests.
One-way analysis of variance (ANOVA) with Tukey’s post hoc test was conducted using KaleidaGraph (ver. 5.04, Synergy Software, Reading, PA, USA) to compare the scores among the bread samples photographed under various illumination conditions. In all analyses, P < 0.05 was taken to indicate statistical significance.
Due to the lack of color temperature data for the UV light source, only the effects of the other five light sources on visual palatability are plotted in Figure 1. Sato [1] investigated the correlation between color temperature and apparent palatability scores, and reported a linear regression line with a coefficient of determination (R2) of 0.730, while R2 for the 27 participants in this study was 0.764. Compared with previous results [1], only two plot positions—between CWF and TL84—were changed. Visual palatability scores were lower under the F light source than under the TL83 light source. The highest palatability score was for the crumb of bread photographed under TL83, and the lowest was for the bread crumb photographed under D65; this result was reproduced in at least two experiments.
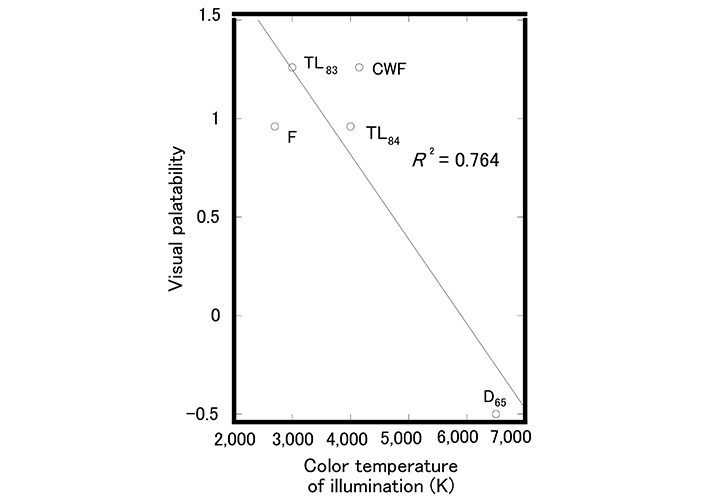
Relation between the visual palatability scores of 27 participants and light source color temperature
To analyze factors affecting the visual palatability of white bread crumb, the correlation between the palatability and visual firmness of the crumb under illumination with various light sources, including UV light as a blue and purple color light, are shown in Figure 2. The linear regression line had an R2 value of 0.865, indicating high reproducibility of the relation between visual palatability and visual firmness even with the addition of scores for sensory attributes assessed under the UV light source. A linear relation between the visual palatability and visual firmness of the crumb of white bread was seen (R2 = 0.813) on the omission of the visual sensory scores under the UV light source [1]. As stated above, visual sensory scores were obtained for the crumb illuminated under illumination with six light sources, including UV light, and the number of participants was increased to 27 untrained students in the retest. Indeed, a better relation between these sensory attribute scores was obtained with the addition of the scores obtained under the UV light source. The participants selected the softer bread even when looking only at the surface of the crumb.
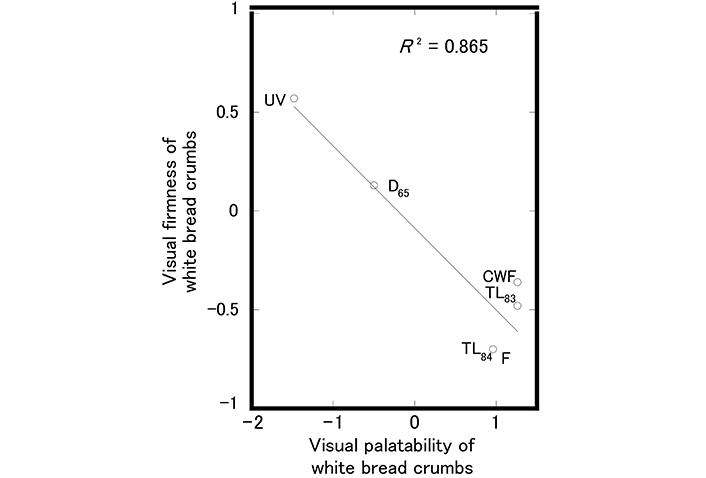
Correlation between the visual palatability and visual firmness of the crumb of white bread illuminated with various light sources, as evaluated by 27 participants
The visual palatability scores of the crumb for the 13 participants in the first test were consistent with the sensory results of the 27 participants in the retest (Figure 3). The linear regression line had an R2 value of 0.954.
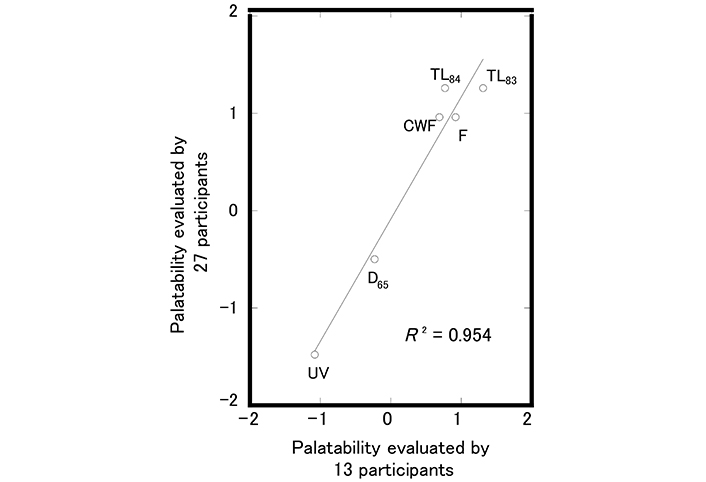
Correlation between the visual palatability scores of the 13 initial participants and those of the 27 participants in the retest
The palatability scores for printed photographs corresponded to those of images presented on a screen using a projector, and the linear regression line had an R2 value of 0.905 (Figure 4). The correlation between visual palatability and visual firmness had an R2 value of 0.813 when the UV light source was excluded [1], but R2 = 0.917 when using a projector and with the addition of the UV light source as a blue and purple light source (Figure 5).
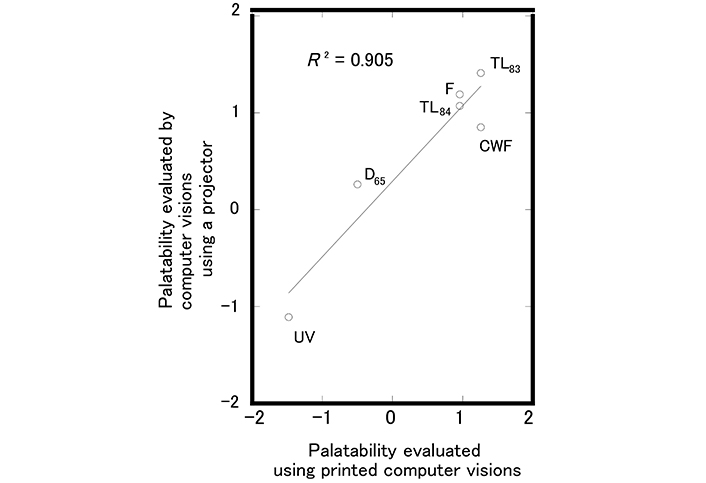
Images of the crumb of white bread illuminated with various light sources: comparison of visual palatability between printed and projected images
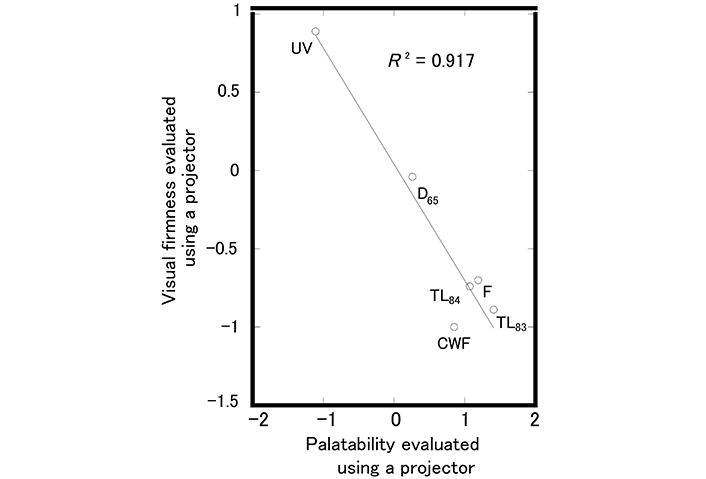
Correlation between the visual palatability and visual firmness of the crumb of white bread illuminated with various light sources presented on a screen using a projector
To ensure that the photographs distributed to participants were identical, a color analysis of five photographs selected at random was conducted. Copies of photographs of the crumb taken under the D65 light source were compared after printing, and the L*a*b* space values were analyzed using a color reader (CR-13; Konica Minolta, Tokyo, Japan) (Table 1). Although there were no significant differences in L* and a*, the b* values of the crumb photographs were significantly different for the second image. A retest of this color analysis for the second image yielded the same result. The lower b* values in the second image may have been due to insufficient yellow ink. Practically, a difference of 1–2 points in scores reflects almost the same visual assessment. Based on general sensory evaluation theory, food samples distributed to participants should be identical, with the same qualities, as stated above. Thus, the identity of the white bread photographs distributed to five participants was confirmed in this study. In addition, the sensory evaluation scores for the photograph taken under all light sources were acquired in a blinded manner. Only the image under the D65 light source was compared to itself. Therefore, a photograph of the crumb acquired under the D65 light source may have a visual sensory palatability score of 0, even if taken in a blinded manner. The plots of the crumb photographed under the D65 light source showed sensory palatability scores of around 0 (Figures 1–3), indicating the reliability of this sensory evaluation method. The sensory evaluation scores—i.e., the palatability and visual firmness scores—may vary within about ± 1 points, and the variation in color among printed images might influence the sensory evaluation results.
Identity of the crumb of white bread photographs taken under D65 light source (n = 10)
| Space values | 1st | 2nd | 3rd | 4th | 5th |
|---|---|---|---|---|---|
| L* | 76.6 ± 2.3 | 78.2 ± 2.1 | 78.1 ± 1.5 | 77.8 ± 1.2 | 78.5 ± 1.8 |
| a* | –2.2 ± 0.2 | –2.2 ± 0.4 | –2.2 ± 0.5 | –2.4 ± 0.4 | –2.3 ± 0.5 |
| b* | –11.2 ± 0.7 | –9.7** ± 0.7 | –10.6 ± 0.5 | –10.7 ± 0.9 | –10.8 ± 0.6 |
The values represent average ± standard deviation; **: significantly different (P < 0.05) by one-way-ANOVA with Tukey’s post hoc test. L*: lightness; a*: green-red axis; b*: blue-yellow axis
While warmer illumination has conventionally been preferred to enhance food acceptance [14, 18, 19], the F light source has a lower color temperature than TL83, implying a warmer color than TL83, while the visual palatability of the crumb under the F light source was lower than that under the TL83 light source.
Chen et al. [12] compared the purchase intentions for various “dressed” breads and cakes illuminated under various light sources with different color temperatures and showed that the optimal light source color temperature was 3,300 K. As the best light source for the crumb of white bread in this study and a previous study [1] was TL83, which has a color temperature of 3,000 K, the close correspondence in the optimal illumination color temperatures for bread and cakes between the studies may have been due to the sample foods used: the crusts in the study by Chen et al. [12] and the crumb in this study.
Cho et al. [14] reported that light colors can modulate the motivation to consume food and the amount of food consumed. They concluded that blue lighting decreased the hedonic appeal of ham and cheese omelets and mini pancakes under illumination with light-emitting diodes (LEDs); blue and green light have negative effects [18]. Despite the lack of color temperature data for the UV light source, quantitative analysis was conducted (Figures 2 and 5), and the R2 values showed good correspondence. This confirmed that visual palatability reflects “visual firmness” for both printed photographs and images displayed on a screen. Therefore, to conserve paper, a novel sensory evaluation method using images presented on a screen, instead of distributing printed photographs to the participants, was used. In addition, printed photographs distributed to participants should be identical, which is not the case for images presented on the same screen.
Finally, numerous studies have used single sensory evaluation tests, leading to the low reliability of this method [1]. Although ISO measures agreement in assessments based on repeatability, few studies have confirmed the repeatability and reproducibility of this method. In this study, a more reliable sensory evaluation of the visual palatability of bread was conducted. There are many ambiguities in food sensory evaluation methods, and efforts are required to increase the reliability of sensory evaluation results. Although there is usually some error variance around an obtained value for sensory tests, the sensory evaluation scores will not always be exactly the same in repeated testing; precision is an important concept in the behavioral sciences [20]. This study focused on the reproducibility of visual bread palatability evaluations. In addition, it was important to confirm the identicality of the food samples distributed to participants before starting the sensory evaluation.
Because the effects of food visual, auditory, olfactory, gustatory, and tactile sensations are involved in assessing the palatability of food based on indirect consumer psychological factors [21], the results of this study highlight the need for more detailed analysis of the palatability of white bread.
In conclusion, the reproducibility of visual sensory evaluations of the palatability of the crumb of white bread was confirmed, and the results indicated that TL83 was the optimal light source to enhance visual palatability. The visual palatability of the crumb reflected the color temperature of the illumination light source. However, illumination with the light source with the lowest temperature, F yielded lower mean visual palatability scores than illumination with TL83. These observations highlight the need for detailed analysis of the effects of illumination color temperature on the visual palatability of the crumb. In this study, visual palatability reflected the visual firmness of the crumb, with bread appearing firmer under blue illumination using a UV light source. A novel sensory evaluation method was proposed using images presented on a screen with a projector to assess the visual palatability and visual firmness of bread.
ISO: International Organization for Standardization
L*a*b*: lightness, green-red axis, blue-yellow axis
RGB: red-green-blue
UV: ultraviolet
The author would like to thank the staff of the Public Foundation of Elizabeth Arnold-Fujii for encouragement in this study.
YS: Conceptualization, Investigation, Writing—original draft, Writing—review & editing, Validation.
The author declares that there are no conflicts of interest.
This experimental study was approved by the ethics review committee of the Faculty of Agriculture and Life Science, Hirosaki University (approval number: 2023001).
The informed consent to participate in the study was obtained from the participants.
The material for the eye in the Graphical abstract received publication consent from the individual and her guardian.
Data will be made available on request.
This work was supported by the Public Foundation of Elizabeth Arnold-Fujii [grant numbers 29, 2023]. The funder had no role in study design, data collection and analysis, decision to publish, or preparation of the manuscript.
© The Author(s) 2025.
Open Exploration maintains a neutral stance on jurisdictional claims in published institutional affiliations and maps. All opinions expressed in this article are the personal views of the author(s) and do not represent the stance of the editorial team or the publisher.
Copyright: © The Author(s) 2025. This is an Open Access article licensed under a Creative Commons Attribution 4.0 International License (https://creativecommons.org/licenses/by/4.0/), which permits unrestricted use, sharing, adaptation, distribution and reproduction in any medium or format, for any purpose, even commercially, as long as you give appropriate credit to the original author(s) and the source, provide a link to the Creative Commons license, and indicate if changes were made.