Abstract
Aim:
The aim of this study is to apply untargeted proton nuclear magnetic resonance (1H NMR) and chemometric analysis to obtain the cacao pod husk (CPH) fingerprint and evaluate the effect of dehydration in the CPH metabolome.
Methods:
Phosphate buffer extracts (pH 6.5) were obtained and measured using a one-dimension (1D) 1H NMR spectrometry. The 1D 1H NMR spectra were recorded without spinning and using the presaturation (PRESAT) pulse sequence to suppress the residual H2O signal. The 3-(trimethylsilyl) propionic-2,2,3,3-d4 acid sodium salt (TSP) was used as an internal reference. Analysis of processed data, applying an orthogonal projection on latent structure-discriminant analysis (OPLS-DA) model was used to highlight significant differences between the three dehydration treatments. Signal assignment of CPH metabolites was carried out based on the coupling constant, software simulation prediction, published data comparison, and metabolomics databases.
Results:
A total of 25 compounds were detected by 1H NMR, methylxanthines, sugars, some amino acids, fatty acids, and organic acids were found among the identified compounds. The fingerprint spectra of the three dehydration methods were clustered separately discriminating the metabolome profile of each of the dehydration treatments, finding that metabolome remarkably differed in theanine, myristic acid, fumaric acid, and aspartic acid composition.
Conclusions:
An untargeted metabolomics to obtain the fingerprint of CPH was successfully established. A 1H NMR spectra with a detailed signal assignment aided to identify 25 metabolites present in CPH fresh and dried by different methods. The results complement the information about CPH composition and how it is affected by the temperature used during the dehydration process. The multivariate analysis points out that freeze drying (FD) preserves the metabolites better than microwave drying (MWD) or hot air drying (HAD). FD and MWD are similar in composition maintaining most of the compounds after drying.
Keywords
Cacao pod husk fingerprint, proton nuclear magnetic resonance metabolomics, myristic acid, fumaric acid, theanineIntroduction
The research of food science is an important field that includes aspects related to food quality, food traceability, food analysis, as well as the relationship between food components and their effect on health. Therefore, the integration of different metabolomic-based technologies together with chemometrics allows the whole evaluation of complex biological systems and matrices [1]. The metabolomic-based approach for biological materials has been evaluated by using different analytical methods, mass spectrometry (MS) and nuclear magnetic resonance (NMR) spectroscopy are the most used to identify and quantify different metabolites of wide organic matrices such as coffee, black tea, green tea, garlic, honey, meat, mango juice, daily flowers, and wine among others [2–7].
Proton NMR (1H NMR) spectroscopy is widely recognized as a high-throughput analytical tool since, is a rapid and reproducible technic that avoids complicated preparation steps helping to preserve the integrity of all metabolites in the matrix, so is highly effective to identify simultaneously the type, number and the proportions of different compounds using the relative frequencies (chemical shifts) in the matrix without analytical standards [8–10].
The cacao tree (Theobroma cacao) is one of the most important commercial crops worldwide because its seeds are used not only in chocolate manufacturing but also in cosmetics and pharmaceutical products with high market demands [11, 12]. However, during the manufacturing of chocolate and derived products, vast amounts of fresh pod husk are generated (about 9–10 t for each ton of beans). Cacao pod husk (CPH) has been used as an alternative dietary supplement for animals, as potash for soap manufacture, and as a green solid base catalyst for trans-esterification for oils [13–16].
It has been reported that CPH has a high content of polyphenolic compounds (epicatechin, catechin) and polysaccharides (pectin) with antioxidant, antimicrobial, vasodilator, analgesic, and anti-inflammatory properties for technological and biological uses, characteristics that confer CPH an added value as a functional ingredient [17]. Unfortunately, CPH has a high moisture content which makes it perishable with low shelf life, therefore, dehydration is the best option to extend shelf life and prevent spoilage by moisture reduction. Previous studies of CPH showed that dehydration by different methods [hot air drying (HAD), microwave drying (MWD), and freeze drying (FD)] increase the phenolic content and the antioxidant activity of CPH. Phenolic compounds such as catechin, quercetin, (-)-epicatechin, gallic acid, coumaric acid, and protocatechuic acid were identified, suggesting that dried CPH is an alternative raw material rich in polyphenols that can exert antioxidant activity [18].
To date, the available information about cacao seeds metabolomics, proteomics, and genomics is mostly related to the origin of cacao and to the changes in beans during fruit ripening, fermentation, roasting, and drying processes for chocolate manufacturing, in which different reactions occur producing a distinct chocolate flavor and therefore a desire commercial product [19]. Regarding polyphenols, it has been reported that carbon-13 NMR (13C NMR) spectrum of purified polyphenols from husk is rich in tannin-like materials composed of catechol units different from the typical condensed tannins [20]. In addition, Li et al. [21] reported the color variation in CPH is particularly due to anthocyanins which are up-accumulated in the mauve phenotype.
However, according to the reference, the effect of different dehydration treatments on CPH by-products has not been yet reported. Therefore, the aim of this study was to apply 1H NMR method coupled with multivariate statistical analysis to i) obtain comprehensive information regarding metabolomic fingerprint of dehydrated CPH, ii) assess the similarities and differences in metabolome profiles of CPH dehydrated by three different methods (HAD, MWD, and FD), and iii) select the best method to dehydrate the CPH according to the obtained fingerprint.
Materials and methods
All chemical reagents were of analytical grade. The standard reagents Sigma Aldrich (product number: C3878-250MG, T4500-25G, T1633-50G, C0750-5G; St. Louis, MO, USA), deuterium oxide (D2O, 99% 2H; product number: DLM-4-PK) were purchased from Cambridge Isotope Laboratories.
Raw CPH
CPH (Theobroma cacao L.) samples were purchased in Ejido Hidalgo located in Tapachula Chiapas, Mexico (14°54’00” N92°16’00”O), in May 2014. Fresh CPH was triturated into a paste using a semi-industrial blender (Crypto Peerless K55, Birmingham, England), and kept at −20°C until use.
Sample preparation
CPH paste was taken out of the freezer and immediately dried by three different methods as was described in a previous work [18].
Drying treatments
All drying methods were previously assessed and reported by our group of investigation and all the conditions were replicated for the obtention of the samples analyzed in the present investigation [18].
HAD: four hundred fifty g were dried with air at a temperature of 60°C, air velocity of 0.1 ms−1 during 24 h and the maximum internal temperature reached by the sample was 50°C. MWD: one hundred 50 g of CPH paste was spread uniformly into a glass plate in a single layer that was about 1–3 mm thick and then dried at 595 W for 11.5 min in a Panasonic inverter microwave oven (NN-SN968, 2,450 MHz, Shanghai, China). FD: 450 g of CPH paste was spread uniformly on the metal trays in a single layer of 1–3 mm thick at an absolute pressure of 20–40 Pa, with a chamber temperature of 20°C and a condenser temperature of −60°C for 24 h. All the drying processes were carried on until the sample moisture content was between 4–8%.
NMR sample preparation for 1H NMR analyses
Five hundred mg of fresh or dry CPH (dry base) were extracted with 10 mL of sodium phosphate buffer (pH 6.5, 0.2 mol/L) in a centrifuge tube. All samples were stirred at 400 rpm for 60 min at room temperature. The extracts were centrifuged at 7,250 g for 30 min at 4°C (Hermle Z326K, Wehingen, Germany). Extracts were filtered and dissolved in 40 µL of phosphate buffer pH 6.5 ± 0.05 (0.2 mol/L) and 60 µL of D2O (99.9% deuterated, Cambridge Isotope Laboratories), containing 10 mmol/L of 3-(trimethylsilyl) propionic-2,2,3,3-d4 acid sodium salt (TSP), 98% atom deuterium and transferred in a 5 mm NMR sample tube. TSP was used as internal standard for chemical shift referencing (δ = 0 ppm). To avoid degradation of chemical compounds, the sample analyses were completed within 12 h after extraction.
1H NMR acquisition
One-dimensional (1D) 1H NMR spectra were acquired at 500 MHz on a Varian NMR System 500 spectrometer (Agilent Technologies, Inc., Santa Clara, CA) operating at 11.7 T and equipped with a 5 mm simple resonance inverse probe (ONENMR). The experiments were carried out without spinning and with water suppression by presaturation (PRESAT) pulse sequence. All the spectra were acquired at 32 K complex points (np), 128 transients with a spectral width of 6,510.4 Hz, acquisition time of 1.5 s, and a relaxation delay of 3 s. All data spectra were Fourier transformed (FT) with FT size of 64 K. To assure good stability and repeatability of the system three groups of samples and three replicates of each group were randomly measured to guarantee a standardized extract giving a total of 9 NMR spectra per sample.
The full NMR spectra were manually phased, baseline corrected, and referenced to TSP. The spectra were transferred to Chenomx NMR suite 8.0.1 software (Chenomx® Inc., Canada), and reduced into spectral binning at 0.004 ppm in a chemical shift range from 0.66 ppm to 9.49 ppm after the residual water region was removed from the bucketing (4.75–4.95 ppm), all the spectra and the integrals were normalized to the total area.
For compounds assignments Chenomx NMR and MestreNova 10.0 software (Mestrelab Research, Santiago de Compostela, Spain) were used. The integration and identification of the metabolites were carried out based on the coupling constant and chemical shifting of each compound; as described by Villalón-López et al. [4] as well as available literature data [22–32].
1H NMR data processing and multivariate statistical analysis
The complete data sets were imported into SIMCA-P13 software (v. 13.0; Umetrics, Umeå, Sweden) for statistical analysis. An unsupervised principal component analysis (PCA) was initially executed to explore the data, Hotelling’s T2 and DModX tests for outlier detection at 95% confidence interval were used. A supervised pattern recognition using an orthogonal projection on latent structure-discriminant analysis (OPLS-DA) [30]; was used to assess the main metabolite changes in CPH samples.
To facilitate the OPLS-DA model interpretation, S-plots were obtained employing the color-coded value of the predictive component loading of the OPLS-DA with two classes. The statistically significant changes in the signals were identified based on the visual inspection of the pool 1H NMR normalized spectra.
Results
Identification of metabolites in dehydrated CPH extracts by 1H NMR analysis
A 1H NMR spectra of fresh and the three different dried CPH samples with 10x zoom are shown in Figure 1A, while HAD-CPH, MWD-CPH, and FD-CPH in Figure 1B, 1C, and 1D, respectively. The principal resonances of the spectrum were assigned according to FooDB database and literature [33], and database chemical shift data [22–31]. The results are summarized in Table 1. Even though the signals are broad and show a certain degree of overlap, the spectral contributions and the chemical shifts of some organic acids, carbohydrates, and methylxanthines could be clearly recognized. It is important to highlight that to obtain the fingerprint the amount and extraction process was standardized. It can be appreciated that the presence of many metabolites is consistent in the three drying methods with different relative intensities (Figure S1). According to the chemical shifts of their 1H NMR spectra, 25 compounds were identified in fresh and dehydrated CPH (Figure 1). To confirm some signal assignments 2D NMR experiments were also performed (data not shown).
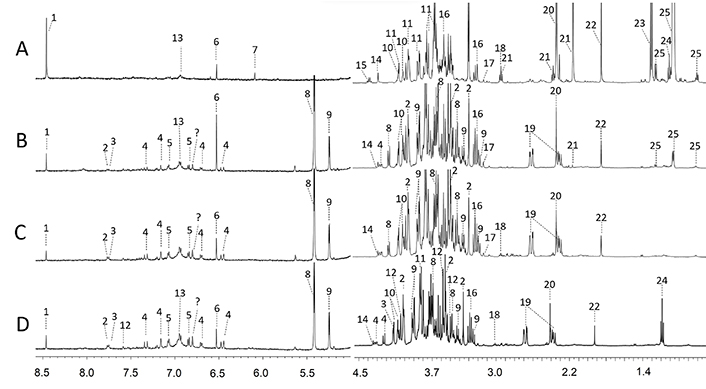
1H NMR spectra (500 MHz, 25°C) of fresh and dehydrated CPH extracts with the following signal assignments. (A) Fresh; (B) HAD; (C) MWD; (D) FD; 1: formic acid; 2: theophylline; 3: theobromine; 4: chlorogenic acid; 5: tyrosine; 6: fumaric acid; 7: maleic acid; 8: sucrose; 9: glucose; 10: gluconic acid; 11: fructose; 12: caffeine; 13: gallic acid; 14: tartaric acid; 15: acetoine; 16: myo-inositol; 17: choline; 18: γ-aminobutyric acid (GABA); 19: aspartic acid; 20: succinic acid; 21: levulinic acid; 22: acetic acid; 23: lactic acid; 24: theanine; 25: myristic acid
Summary of the identified metabolites in 500 MHz 1H NMR spectra of dried CPH phosphate extracts
| Number | Compound | δ (ppm), J (Hz) |
|---|---|---|
| 1 | Formic acid | 8.446 (s) |
| 2 | Theophylline | 7.748 (s) |
| 3 | Theobromine | 7.734 (s) |
| 4 | Chlorogenic acid | 7.33 (d, 15.8), 7.16 (d, 2.1), 6.46 (d, 15.9) |
| 5 | Tyrosine | 7.07 (d), 6.828 (d, 8.07) |
| 6 | Fumaric acid | 6.512 (s) |
| 7 | Maleic acid | 5.618 (s) |
| 8 | Sucrose | 5.401 (d), 4.211 (d), 3.689 (m) |
| 9 | Glucose | 5.229 (d), 4.641 (d), 3.239 (m) |
| 10 | Gluconic acid | 4.109 (d) |
| 11 | Fructose | 4.12-4.095 (m), 4.010-3.985 (m), 3.698 (s), 3.595 (s), 3.555 (d) |
| 12 | Caffeine | 7.749 (s), 3.345 (s) |
| 13 | Gallic acid | 6.951 (s) |
| 14 | Tartaric acid | 4.331 (s) |
| 15 | Acetoine | 4.44 (q, 7.1) |
| 16 | Myo-inositol | 4.061 (m), 3.618 (m), 3.892 (dd), 3.793 (d), 3.710 (d), 3.699 (dd), 3.556 (d) |
| 17 | Choline | 3.345 (s) |
| 18 | GABA | 3.01 (m), 2.3 (t, 7.1) |
| 19 | Aspartic acid | 2.667 (d), 2.368 (dd) |
| 20 | Succinic acid | 2.399 (s) |
| 21 | Levulinic acid | 2.222 (s) |
| 22 | Acetic acid | 1.912 (s) |
| 23 | Lactic acid | 1.321 (d, 6.9) |
| 24 | Theanine | 1.19 (t, 7.2) |
| 25 | Myristic acid | 1.33 (p, 7.4), 1.17-1.12 (m) 0.89 (t, 6.3) |
Chemical shifts are reported with respect to TSP (δ = 0.000 ppm)
Regarding cacao by-products there is little information about their composition; in addition, the use of phosphate buffer instead of organic solvents for extraction is worth noticing since it is an environmentally friendly alternative. In the present study, some compounds such as gallic acid (polyphenolic acids), glucose, and some amino acids like tyrosine and aspartic acid were successfully identified (Figure 1). To the best of our knowledge, it is the first time that theanine is identified in cacao by-products. Therefore, it is necessary for further analysis to know more about this compound which possesses important health-related benefits promoting relaxation and improving concentration and learning ability [34]. Glucose and fructose have been found in cacao beans during fermentation and roasting [35], as well as during pectin extraction from CPH [36, 37].
In all spectra the chemical shifts of acetic acid and lactic acid were found, these two molecules are characteristic compounds formed during cacao beans fermentation [38]. The intensity of the signal decrease in different levels and this might be related to the conditions of each drying method. GABA signal was detected in both MWD and FD and did not appear in HAD.
Multivariate analysis in CPH components resulting from dehydration treatment
A principal component analysis (PCA) was carried out supported with multivariate analysis using an inconspicuous variation, showing that both the PC-1 and PC-2 explain 96.9% of the total variance with a Q2 of 55.5% (Figure 2A), where is clearly revealed a difference in CPH composition between fresh and drying methods (Figure S2). On the other hand, Figure 2B shows a PCA that explains 96% of the total variance with a Q2 of 50.3%, indicating similarities between FD and MWD.
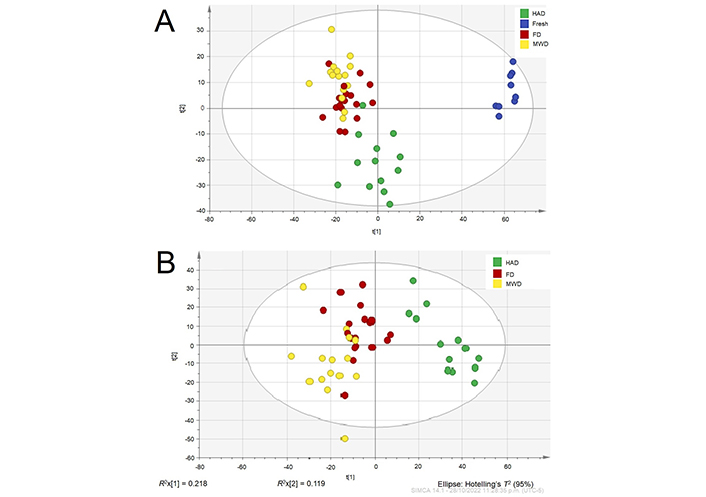
PCA model of the two principal components score plot of CPH. (A) PCA including fresh and dehydrated CPH; (B) PCA of dehydrated CPH (HAD, MWD, and FD)
A supervised model OPLS-DA was performed (Figure 3), as well as, an OPLS/O2PLS overview plot for describing the predictive variation between X and Y loadings and scores (Figure S3). The results show a well-separated cluster for the three samples, indicating that the metabolome profile of CPH is clearly different among the drying methods (HAD, MWD, and FD). Also, the scatter plot of the scores of PC1 versus PC2 as evidenced in Figure 3, imply the variations generated by storage conditions, extraction conditions, and dehydration method that together explain 90% of the total system variance; a permutation analysis plotting was carried out for R2 and Q2 from 100 permutation test to validate the OPLS-DA model (Figure S4) and shows the correlation coefficient on the permuted and observed data. The OPLS-DA model clearly classified the dehydration treatments into three different clusters explaining 98.23% of the system variance; and showing that all the NMR signals are highly imported for the fingerprint differentiation, also those that are unidentified.
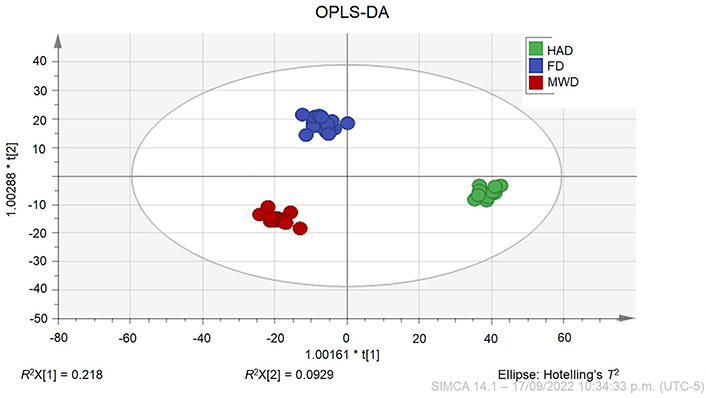
OPLS-DA score plot of CPH with different dehydration treatments. The OPLS-DA model with goodness of fit (R2X) was 0.984 and the goodness of predictability was indicated by a Q2 value of 0.957
Variations in CPH components resulting from dehydration treatment
For multivariate analysis of CPH, the entire set of identified metabolites was considered. However, henceforth, only the metabolites that have high relative abundance and significant differences among the drying methods are relevant for further discussion.
Therefore, only the metabolites on which overall differences and similarities among the samples are shown in Figure 4. A clear distinction between HAD and MWD is observed (Figure 4A) indicating different 1H NMR profiles (Figure 4B). The differences between HAD and MWD treatments were primarily observed in sugar and organic acids content. The analysis showed that fumaric acid, aspartic acid, succinic acid, acetic acid, and myristic acid content differ in HAD and MWD (Figure 4C). The organic acids could be present in dehydrated CPH due to an early stage of fermentation. In addition, the acetoin, lactic acid, and theanine (glutamic acid analogue) signals intensity disappeared in comparison to the signal intensity observed in the fresh sample (Figure 1A). While the signal of GABA spectra disappeared only in HAD treatment and is maintained in MWD treatment. These results cannot be explained exclusively by biochemical reactions that occurred during the drying process, nor by prolonged exposure to applied temperature in HAD treatment.
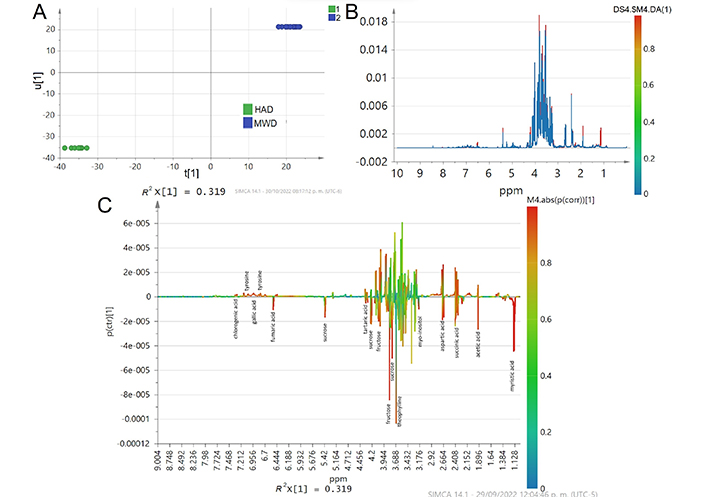
A comparison between HAD and MWD treatments with OPLS-DA score plot. It is calculated from the binning of the NMR data showing (A) Inner relation plot of the score vectors from the same component, R2X(cum) = 0.471, R2Y(cum) = 0.994, Q2(cum) = 0.977, type scaling UV (unit variance); (B) the average of line spectra color colored according to the differences in the loading plots of OPLS-DA; (C) the overlay of S-line scores, color colored according the predictive component loading
Differences between HAD and MWD treatments were mainly observed in sugar, organic acids, theophylline, myo-inositol, and choline intensity signals. HAD loses acetoine, GABA, and theanine signals, while FD did not show choline, levulinic acid, or myristic acid (Figure 5).
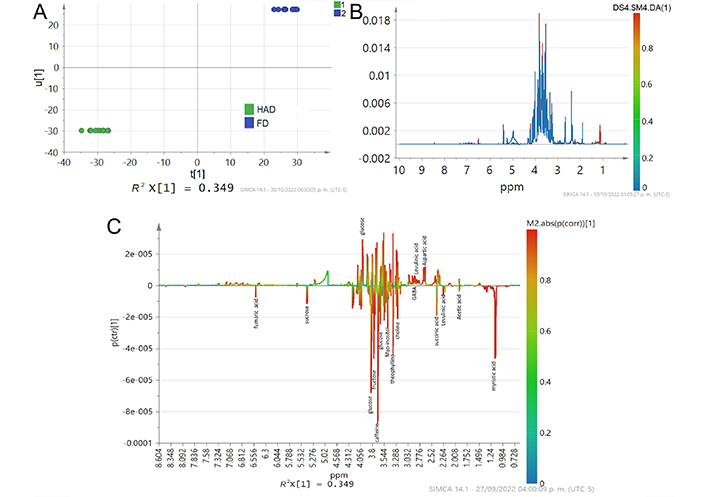
A comparison metabolites fingerprint signals between HAD and MWD treatments with OPLS-DA score plot calculated from the binning of the NMR data showing R2X(cum) = 0.471, R2Y(cum) = 0.994, Q2(cum) = 0.977, type scaling UV. (A) Inner relation plot of the score vectors from the same component; (B) line spectra color colored according to the differences in the loading plots of OPLS-DA; (C) S-line scores, color colored according to the predictive component loading
MWD and FD showed similar metabolite profiles mainly on sugars and some organic acids, indicating that both MWD and FD may be less destructive dehydration treatments for CPH, preventing the loss of functional metabolites. FD preserves gallic acid contrary to MWD that did not show this signal; these results are contradictory to those found in a previous work in which more polyphenolics compounds were found [18]; these discrepancies may be due to the selected solvent which has neutral pH, in addition since the extractant is an aqueous solution it may not allow extraction of other polar compounds. FD clearly shows a higher concentration of theanine which suggests that this molecule is negatively affected by temperatures up to 50°C and is best preserved at low temperatures, therefore it was not found in HAD (60°C) and MWD (~90°C, Figure 6).
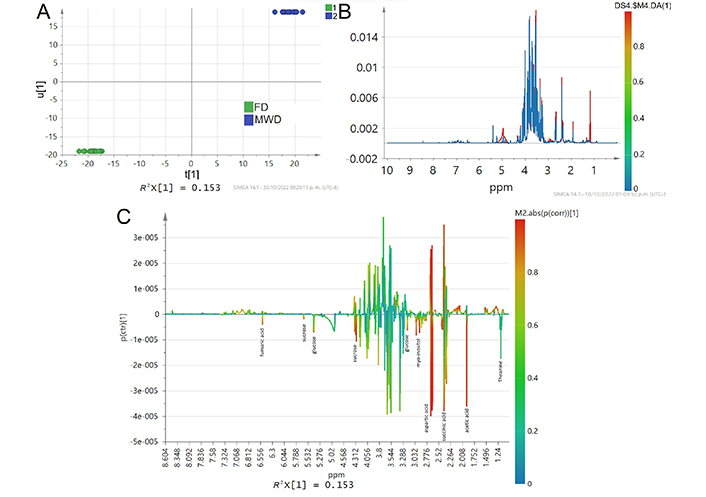
A comparison of metabolites fingerprint signals between MWD and FD treatments with OPLS-DA score plot calculated from the binning of the NMR data showing R2X(cum) = 0.381, R2Y(cum) = 0.996, Q2(cum) = 0.977, type scaling UV. (A) Inner relation plot of the score vectors from the same component; (B) line spectra color colored according to the differences in the loading plots of OPLS-DA; (C) S-line scores, color colored according to the predictive component loading
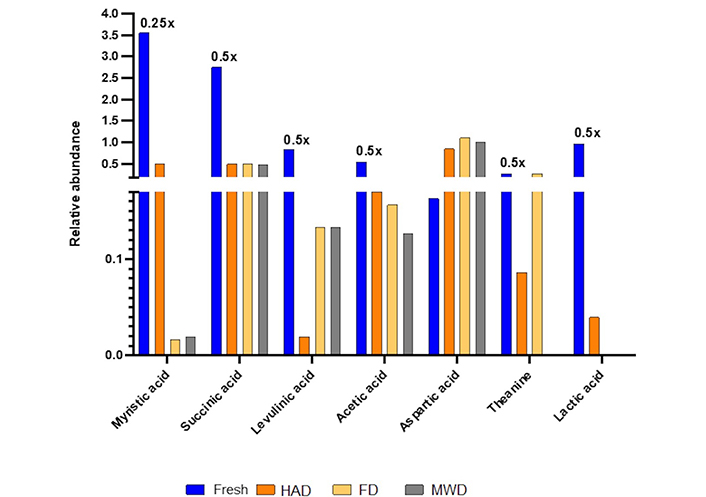
Some metabolites clearly observable and not overlapped with the S-line plot were selected to determine their relative abundance by comparison with internal standard (TSP; Figure 7). The identified metabolites that generated the main differences between fresh and dehydrated samples are displayed in Figure 7, as mentioned the relative abundance was referred to TSP standard.
Fresh CPH has clearly a higher relative abundance of acetic, succinic, and lactic acid, as well as levulinic acid; it may be due to the presence of some bacteria in an early stage of fermentation in fresh CPH. On the other hand, aspartic acid is less affected by temperature, even with an increase in its abundance after the dehydration process. While theanine is more affected by MWD than HAD, it is better preserved by FD method. Myristic acid content must be highlighted since there is little information about its presence in any part of cacao.
Discussion
About 600 different compounds such as alcohols, carboxylic acids, aldehydes, ketones, esters, and pyrazines among others have been identified as the responsible molecules for the characteristic odor-flavor of cacao and cacao-derived products [39–41]. Among these metabolites we identified, methylxanthines such as caffeine, theophylline, and theobromine; free sugars such as sucrose, glucose, fructose, and inositol/myo-insoitol; ketones like acetoine; and polyphenolic acids like chlorogenic acid.
Some of the polyphenolics and sugars identified in this work have been previously identified in CPH by high performance liquid chromatography (HPLC) and gas-liquid chromatography (GLC) [35–37, 42, 43].
In general, exposure to temperature for a long time may affect negatively most of the polyphenols; producing epimerization or condensation reactions that change or even degrade some polyphenols. Chlorogenic acid is one of the most thermolabile polyphenols, therefore, in HAD and MWD, its signal was not observed, possibly because of the high-temperature application. Similar behavior has been observed in coffee beans in which quinic acid is generated during heating [44]. However, most of the volatile compounds are outside the NMR detection range.
Meanwhile, tyrosine and aspartic acid have been previously reported in cacao bean hull by ninhydrin method [20] and by 1H NMR in cacao beans [28, 45]. The presence of acetic and lactic acid may indicate that the sample could have been in an early fermentation stage when it was processed [38].
Kiani et al. [46] have reported inositol and myo-inositol indistinctly as part of the cacao metabolome. Both compounds are stereoisomers, however, only myo-inositol possesses health-related properties such as signal transduction, metabolic flux, insulin signal, and regulation of ion channel permeability [46]. According to the chemical shift of the signal, myo-inositol was identified in this work. However, to have an accurate identification is necessary for further complementation of the NMR analysis with other analytic techniques.
GABA metabolite was previously reported by Marseglia et al. [47] in fermented and dried cacao beans from different geographical origins (Africa, Central/South America, Asia, and Oceania). As same as myo-inositol, GABA possesses important health-related properties not only acting as inhibitory neurotransmitters of the central nervous system with calming effects but also lowering the blood pressure of mildly hypertensive [47].
Myristic acid presence in cacao cell suspension culture at 15°C has been reported by Leathers and Scragg [48] suggesting that fatty acid composition is a function of the cell genotype in cultured plants cell.
Some authors have reported that levulinic acid may be produced from glucose, fructose, sugars identified in this work in fresh and dehydrated CPH, starch, and lignocellulosic residues [49, 50], in addition to the biosynthesis from some bacteria of the Pseudomonas genus that are also present during cacao beans fermentation [49]. Therefore, its presence may be due to the early fermentation stage of the fresh sample. The differences in levulinic acid in dehydrated samples may be related to the applied temperature for each one that stops the fermentation and levulinic acid production.
Conclusions
A 1H NMR untargeted metabolomics to obtain the fingerprint of CPH fresh or dehydrated has been successfully established in this study. Both the extraction procedure and NMR parameters were optimized to obtain a fingerprint spectrum, despite the fresh sample having a slightly early fermentation stage (for future studies will be necessary a better control of temperature and storage conditions as far as possible). The use of chemometrics tools to analyze the obtained data allows us to identify 25 metabolites, most of these metabolites belong to methylxanthines, sugars, some amino acids, fatty acids, and organic acids. Multivariate analysis is a method that allowed us to differentiate the CPH composition of fresh samples compared to those obtained by different dehydration processes. Our results highlight that FD and MWD methods are similar in composition maintaining most of the compounds after drying.
Therefore, MWD may be a suitable commercial method to dehydrate CPH to preserve important health-related metabolites. Moreover, the results provide complementary information about CPH composition and how it is affected by the dehydration method selected and the temperature used during this process. Nevertheless, further studies are needed to evaluate i) different solvents in order to identify more possible metabolites present in CPH, and ii) the real content of the distinctive metabolites by their quantification.
Abbreviations
| 1D: |
one-dimensional |
| 1H NMR: |
proton nuclear magnetic resonance |
| CPH: |
cacao pod husk |
| FD: |
freeze drying |
| GABA: |
γ-aminobutyric acid |
| HAD: |
hot air drying |
| MWD: |
microwave drying |
| NMR: |
nuclear magnetic resonance |
| OPLS-DA: |
orthogonal projection on latent structure-discriminant analysis |
| PCA: |
principal component analysis |
| TSP: |
3-(trimethylsilyl) propionic-2,2,3,3-d4 acid sodium salt |
Supplementary materials
The supplementary material for this article is available at: https://www.explorationpub.com/uploads/Article/file/10109_sup_1.pdf.
Declarations
Author contributions
NDVL: Methodology, Formal analysis, Data curation, Writing—original draft, Writing—review & editing. MHO: Writing—review & editing. AOM: Conceptualization, Investigation, Supervision. GC: Investigation, Resources, Project administration, Supervision. GZV: Conceptualization, Investigation, Resources, Project administration, Supervision. LVC: Methodology, Writing—original draft, Writing—review & editing. All authors read and approved the submitted version.
Conflicts of interest
The authors declare that they have no conflicts of interest.
Ethical approval
Not applicable.
Consent to participate
Not applicable.
Consent to publication
Not applicable.
Availability of data and materials
Not applicable.
Funding
The authors gratefully acknowledge the financial support provided by the
Copyright
© The Author(s) 2023.
