
Abstract
Aim:
Plasma cell disorders (PCD), a group of B-cell neoplasms, have undefined etiology. Mast cells (MC) have been found to promote the proliferation and differentiation of B cells in several B cell lymphoproliferative disorders; however, their role in PCD is unclear. The study therefore aims to evaluate bone marrow MC (BM-MC) in the context of PCD.
Methods:
Thirty patients with PCD and 20 control subjects were selected. The BM sample was collected and mononuclear cells were isolated to identify the MC percentage among mononuclear cells using flow cytometry. A 24-hour BM culture was also performed and tryptase levels in the culture supernatant were measured by an enzyme immunoassay.
Results:
In the patient group, the median of MC was 0.04% compared to 0.002% in the control group (p = 0.00001). Median BM-MC tryptase levels were also high in patients (10.1 ng/mL) against the control levels of 7.0 ng/mL (p = 0.011). While 50% of patients were found to have raised tryptase levels, only 10% of controls had tryptase levels beyond the cutoff levels of (p = 0.003).
Conclusions:
BM-MC number and tryptase levels are increased in PCD, suggesting their role in disease pathogenesis.
Keywords
Plasma cell disorders, bone marrow mast cells, mast cell tryptase, multiple myeloma, plasma cell leukemiaIntroduction
Plasma cell disorders (PCD) are a group of B-cell neoplasms characterized by the clonal expansion of plasma cells (PC) and the secretion of monoclonal immunoglobulin, detectable as an M-band on electrophoresis [1]. Although first described in 1844, the etiopathogenesis of PCD remains unclear. However, it has been associated with genomic alterations, environmental exposures, radiation, infections, and inflammation [2]. Despite extensive research and novel treatment approaches, these highly morbid disorders still carry a high fatality rate. PCD range in severity from indolent, incidentally discovered monoclonal gammopathies of undetermined significance (MGUS) to aggressive diseases like multiple myeloma (MM) or plasma cell leukemia (PCL) with end-organ dysfunctions [1, 2]. Ongoing research to uncover the exact etiology of PCD is crucial for successful treatment.
Mast cells (MC) are bone marrow (BM) derived cells that act as the first line of defense against infectious or tumorigenic agents strategically located in various tissues. Recent discoveries on the pathophysiology of MC in tumours have highlighted their role in different cancer types, including glioblastoma, hepatocellular carcinoma, melanoma, breast cancer, etc. [3–9]. However, their status and contribution to disease progression in PCD are not well studied [3, 10]. MC play a crucial role in innate and acquired anti-tumour immunity, influenced by surface receptors such as Toll-like receptors. These receptors affect the tumour microenvironment through various mediators like serine proteases, matrix metalloproteinases, and vasculogenic factors. These molecules facilitate the breakdown of the extracellular matrix, activate endothelial cells to form vascular tubes, and stimulate angiogenesis in tumours [11]. A tumour’s survival largely depends on its trophic requirements, which MC support through angiogenesis.
Tryptase-positive MC are significant in the progression and spread of colon adenocarcinoma, activating protease-activated receptor-2, which also plays a role in breast cancer metastasis [3]. MC have been implicated in bronchial lining, smooth muscle, and stromal proliferation [9]. Studies on the role of MC in PCD have shown various microenvironment changes, including alterations in stroma, lymphocytes, vasculogenic cytokines, chemokines, metalloproteinases, and local parameters of the osteolytic process [2, 9]. These findings have prompted further exploration of the relationship between MC numbers and tryptase levels in BM with the clinical, biochemical, and radiological parameters of PCD, including disease stage and therapeutic response. This case-control study aims to determine whether BM-MC are altered in PCD.
Materials and methods
Participants and study design
We recruited 30 clinically suspected, diagnosed, and untreated cases of PCD with M-band positivity in serum or urine electrophoresis, along with 20 age- and sex-matched controls with non-malignant conditions requiring bone marrow aspiration (BMA). Patients were excluded if they had immunodeficiency, were organ transplant recipients, had autoimmune disorders, renal or liver insufficiency, were undergoing disease-specific or immunosuppressive treatment or taking anti-inflammatory drugs, were unwilling to participate, or provided insufficient or hemolyzed samples. Written informed consent was obtained from all participants, and the study commenced after receiving approval from the institute’s ethics committee (No: INT/IEC/2019/000143).
BM samples were collected from all participants during their routine diagnostic BMA procedure. Briefly, an autoclaved Sahli’s 16G needle was used to penetrate the posterior superior iliac spine, and 1–2 mL of BM was aspirated using a 15 mL syringe and collected into an EDTA vial. The BM particles were disaggregated by passing the samples through a 25-gauge needle several times. The sample was immediately transported to the laboratory, where BM mononuclear cells were isolated using the standard density-gradient (Ficoll) separation method.
Flow cytometric analysis of BM-MC
A diluted 200 µL BM sample containing 106 nucleated cells was taken into two Falcon tubes: one serving as the control tube labeled “cells only”, and the other mixed with 10 µL each of PerCyp-CD45, APC-CD117, and PE-CD34 antibodies (BD Pharmingen, USA). Both tubes were incubated for 20 minutes at room temperature (RT). Subsequently, a 10-minute incubation was performed with 1 mL of FACS lysing solution (BD Pharmingen, USA). The cells were then centrifuged at 1,800 rpm and washed twice in phosphate-buffered saline (PBS) containing 0.2% bovine serum albumin and 0.1% sodium azide. The supernatant was discarded, and sheath fluid was added to the remaining cell pellet. Data acquisition was carried out on an LSR Fortessa multicolor flow cytometer (Becton Dickinson, USA) using the Diva 8.01 software program, and the percentage of MC in the BM was calculated using the following formula:
MC tryptase enzyme immunoassay
Freshly isolated BM mononuclear cells were suspended at a density of 5.0 × 10⁶ cells/mL in RPMI medium supplemented with 10% fetal calf serum and 1% penicillin-streptomycin solution. The cells were seeded onto a 24-well culture plate (5.0 × 10⁶ cells per well) and incubated at 37°C in a 5% CO2 atmosphere. After 24 hours, the total number of viable cells was counted using a Neubauer chamber following staining with 0.4% trypan blue solution. The supernatant was collected to assess MC activity by measuring MC tryptase levels. The analysis was performed using ready-to-use kits compatible with an automated immunoassay analyzer (PHADIA-100, ThermoFisher Scientific, Sweden) according to the manufacturer’s instructions. A cutoff value below 9.5 ng/mL was used for comparison between patient and control groups.
BM-MC number and MC tryptase values were correlated with the clinical stage of the disease, hematological parameters, biochemical parameters, radiological stage, treatment response (after 6 months of diagnosis), PC infiltration in BM, and CRAB features (calcium elevation, renal failure, anemia, and bone lesions).
Statistical analysis
Statistical analysis was performed using IBM SPSS software (Version 22.0) for Windows. Results were expressed as median and interquartile range (IQR). A parametric student t-test was used for group comparison, while nonparametric tests were used, such as Kruskal-Wallis, chi-square, Fischer exact test, Z test, and asymptotic signature test. For correlation within the patient group between MC and tryptase versus other parameters like BM infiltration of BM, CRAB features, M-band quantification, κ/λ ratio, prognostic parameters of the disease β2 microglobulin, albumin, ISS score, hematological parameters Hb/TLC/platelet count, treatment and radiological stage, parametric test Pearson coefficient and Signature 2-tailed test were used. Nonparametric tests utilized were Spearman Rho with correlation coefficient and Signature 2-tailed test. A p-value < 0.05 was considered significant.
Results
Age and sex distribution
The age range in the patient group was 41 to 65 years, with a median age of 58. The control group’s age ranged from 31 to 65, with a median age of 42. The participants were grouped on age basis in both patient and control groups (Table 1).
Age distribution in patient and control groups
| Age (in years) | Sample size | Median (IQR)(in years) | Range(in years) | Number of males(%) | Number of females(%) | Male:female ratio |
|---|---|---|---|---|---|---|
| Patient group | 30 | 58 (49.3–63.3) | 41–65 | 19 (63%) | 11 (37%) | 1.7:1 |
| 41–50 | 8 | |||||
| 51–60 | 13 | |||||
| 61–65 | 9 | |||||
| Control group | 20 | 42 (35.5–60.8) | 31–65 | 12 (60%) | 8 (40%) | 1.5:1 |
| 31–50 | 10 | |||||
| 51–60 | 5 | |||||
| 61–65 | 5 |
IQR: interquartile range
Disease distribution in patients and controls
In the patient group, PCD was diagnosed as MM in 23 (77%) patients, followed by MGUS in 4 (13%) cases, and single case (3%) each of amyloidosis, PCL, and κ-light chain disease (κ-LCD). The patients presented with symptoms like backache (27%), shortness of breath/dyspnoea (20%), bone and joint pain (10%), loss of appetite (7%), frothy urine (7%), compression fracture (7%), angina, priapism, and penile and digital gangrene in 3%.
The control group had 6 (30%) cases with idiopathic thrombocytopenic purpura (ITP), 5 cases (25%) of nutritional anemia, 2 cases (10%) of drug-induced myelosuppression and 1 (5%) case each of chronic idiopathic demyelinating neuropathy, megaloblastic crisis, end-stage renal disease, diabetes mellitus type 2 with nephropathy and acute interstitial nephritis.
BM-MC
MC were enumerated in patients and controls using CD45+, CD117+ as positive markers and CD34– as a negative marker by flowcytometry. BM-MC percentage was significantly higher in patients, with 20% of patients having BM-MC more than the defined cutoff value of 0.08%, while none of the controls exceeded this (Figure 1). The median MC percentage was 0.04% (IQR = 0.015–0.074) in the patient group, while in the controls, the median value was 0.002% (IQR = 0.001–0.006) with a p-value of 0.00001. The patient group had at least twenty times more MC than the control group (Figure 2A and 2B).
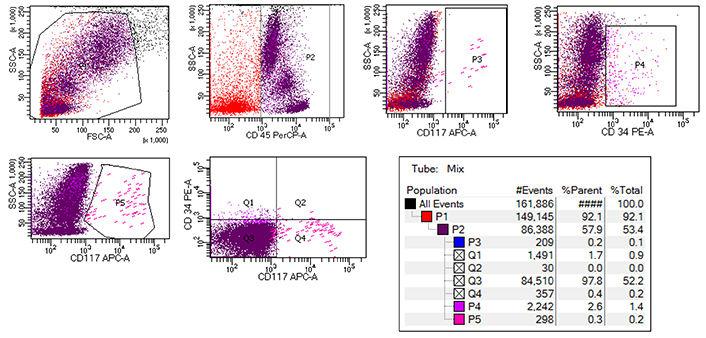
Flow cytometric analysis of BM-MC showing initial gating of CD45+ cells followed by CD34– and CD117+ MC selection. BM: bone marrow; MC: mast cells
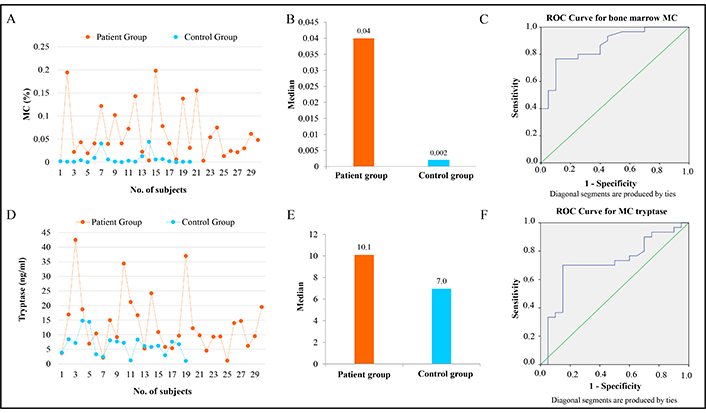
BM-MC percentage and tryptase level comparison in the study groups. (A) Line diagram showing BM-MC percentage in each patient and control. (B) Bar chart to show the difference in BM-MC percentage as observed in flow cytometry. (C) ROC curve for BM-MC in the participants. (D) Line diagram showing tryptase levels in each patient and control. (E) Bar chart and (F) ROC curve to show the difference in tryptase levels in the participants. BM-MC: bone marrow mast cells; ROC: receiver operating characteristic
The receiver operating characteristic (ROC) curve was plotted to analyze the performance of MC in distinguishing between the two groups. The area under the curve was 0.866, indicating good discrimination ability. Further analysis using ROC curves showed that measuring MC could be valuable in distinguishing between the two groups, especially when the values were toward the left side of the diagonal line (Figure 2C). The asymptotic signature test further confirmed the significance of this result with a p-value of 0.001. The sensitivity for MC was 77%, with a specificity of 90% and an accuracy of 82%. The sensitivity and specificity values suggest that MC measurement is reasonably reliable for identifying positive and negative cases, with an overall accuracy of 82%.
The study compared the levels of tryptase, a protein associated with allergic reactions, between a patient and a control group. In the patient group, tryptase levels ranged from 1.1 ng/mL to 42.5 ng/mL with a median value of 10.1 ng/mL, while in the control group, the levels varied from 1.0 ng/mL to 15.4 ng/mL, with a lower median value of 7.0 ng/mL (Figure 2D and 2E). The statistical analysis revealed a significant difference between the groups, with a p-value of 0.011 using a nonparametric test, indicating that the differences in tryptase levels were unlikely due to chance (Table 2). Further analysis showed that in the patient group, 15 cases had tryptase levels above the cutoff value of 10 ng/mL, whereas in the control group, only 2 cases exceeded this cutoff. This difference was statistically significant, with a p-value of 0.003 using the chi-square test (Table 2). The ROC curve for the tryptase parameter to deduce its sensitivity and specificity was also plotted, and the area found was 0.714 with a p-value of 0.011 (Figure 2F).
Depicting median MC percentage and tryptase levels in study groups
| Parameter | Group | Number | Median [in % (IQR)] | p-value | |
|---|---|---|---|---|---|
| Mast cell(in %) | Patient | 30 | 0.04 (0.015–0.074) | 0.00001 | |
| Control | 20 | 0.002 (0.001–0.006) | |||
| Tryptase(in ng/mL) | Patient | 30 | 10.1 (6.4–16.9) | 0.011 | |
| Control | 20 | 7.0 (3.7–8.1) | |||
| Group | Number | Positive | Negative | p-value | |
| Patient | 30 | 15 | 15 | 0.003 | |
| Control | 20 | 2 | 18 | ||
In the patient group, 4/30 (13%) individuals had increased MC percentage and raised BM tryptase. On the other hand, none of the controls showed a combined increase. However, the Fischer exact test remained nonsignificant (p-value of 0.14).
Correlation of MC tryptase levels with BM infiltration and CRAB features
When correlated with BM infiltration across different PCD, we found that the mean MC percentage was highest among the MM group at 0.072%, with a corresponding PC percentage of 51%. The mean MC percentage was lowest in PCL at 0.003%, with a corresponding 49% for PC compared to controls, with a mean MC percentage of 0.007%. The lowest tryptase levels (6.9 ng/mL) were observed in patients with κ-LCD who had only 6% of PC in their marrow, while the highest levels (24.2 ng/mL) were noted in PCL who had 49% or more number of PC. Although there were variations between patients and controls, all these comparisons in statistical evaluation remained insignificant.
Among the CRAB features, all characters were seen in 4/30 (13%); 8/30 (26%) had bone lesions and anemia; and 4/30 (13%) patients each had renal involvement and anemia; only bone lesion; and no CRAB characters. Anaemia only was noticed in 3/30 (10%), and 1 case each (3%) had hypercalcemia and anemia, bone lesion only, and hypercalcemia only. Patients with CRAB features exhibited higher mean MC percentage and tryptase levels, though the difference could not achieve statistical significance. Similarly, no significant difference could be seen when correlated with radiological findings or standard therapies like cyclophosphamide, bortezomib, dexamethasone, or with some modifications in the form of lenalidomide, thalidomide, radiotherapy, and in acute cases with plasmapheresis.
Discussion
BM-derived MC are prevalent in the respiratory, genitourinary, and gastrointestinal tracts and play a role in the carcinogenesis of these organs. Reciprocal stimulation between MC and tumour cells induces MC to release many mediators, including cytokines, chemokines, arachidonic acid derivatives, and serine proteases such as chymase and tryptase. These mediators significantly influence the tumour microenvironment [3]. These alterations fulfill tumour cells’ trophic requirements by angiogenesis and rekindle tumour survival, facilitate metastasis, and affect prognosis [10]. An important biochemical marker for MC out of many is tryptase. This enzyme is also raised in many tumours and has been reliably used as an MC marker in hepatocellular, pancreatic, lung, and prostatic carcinoma [11].
MC have been analyzed by various methods, e.g., flow cytometry, immunohistochemistry (IHC), and cell cultures with special staining [11, 12]. Previous studies mostly relied on IHC on BM biopsies for tryptase and have evaluated MC density (MCD). Since flow cytometry on BMA can provide rapid results with easy MC evaluation, we used this method and enzyme immunoassay. Using CD45 and CD117 as positive markers and CD34 as a negative marker, we found significantly elevated MC (p = 0.00001).
Research by various scientists has demonstrated a strong link between MCD and solid tumours. Cinel et al. [5] found that increased MCD is proportional to myometrial invasion in stage 1C endometrial cancer. Roy et al. [6] showed a linear correlation between MCD and glioblastoma through the glycoprotein serglycin. Fukushima et al. [7] identified a significant correlation between MCD, vasculogenesis, and non-Hodgkin lymphoma, particularly the angioimmunoblastic type. Stoyanov et al. [8] observed that mitotic activity in non-small cell lung carcinoma cell lines increased significantly with higher MCD. He et al. [4] demonstrated that breast carcinoma growth and metastatic potential are reduced in the absence of MC. Gudiseva et al. [13] noted that increased MCD and vasculogenesis are linked to oral squamous cell carcinoma and submucous fibrosis. Additionally, a few authors have associated mastocytosis with a spectrum of PCD, highlighting abnormal MC morphology, clustering, markers (CD2 and CD25), KIT codon 816 mutation, and elevated tryptase levels (> 20 ng/mL) [9, 14, 15].
Unfortunately, very few studies show correlations between MCD and various factors related to PCD. Nico et al. and Nakayama et al. [16, 17] elucidated factors contributing to increased MCD, MM, and vasculogenesis. Pappa et al. [18] found a significant positive correlation (p < 0.001) between vasculogenic chemokines-epithelial neutrophilic activating protein-78 (ENA-78), growth-related oncogene-α, and vascular endothelial growth factor (VEGF) with MCD in MM. Vyzoukaki et al. [19] reported that MCD, through various mediators, impacts the osteolytic process, evidenced by elevated levels of matrix metalloproteinase-9, receptor activator of nuclear factor κB ligand (RANKL), and urine N-terminal propeptide of procollagen type I, all of which showed a significant positive linear association with MM stage. Pappa et al. [20] also found a significant positive correlation between the Ki-67 proliferation index of MGUS and active MM with MCD and neovasculogenesis. Devetzoglou et al. [10] demonstrated significant linear positive relationships between MCD, MM, and disease activity factors, including IL-6, β2-microglobulin, C reactive protein (CRP), BM-PC infiltration, and immunoglobulin levels. Vyzoukaki et al. [21] also assessed the proportionality of MCD in MM patients with vasculogenic cytokines e.g., angiopoietin-1 (Ang-1), angiogenin, and matrix metalloproteins finding significant positive correlations with MCD and MM stages. These studies collectively suggest that MCD is significantly related to both PCD and solid tumours [22]. Our study further confirmed this, showing a significant correlation between MC percentage and PCD. We compared positive values of both MC and tryptase (with cutoffs of 0.08% for MC and 10 ng/mL for tryptase) in patient and control groups. MC was elevated in six patient cases but none in the control group. Tryptase levels were elevated in 15 patients and 2 control cases, with a chi-square test showing significance at a p-value of 0.003. When considering both MC and tryptase together, elevations were found in four patient cases and none in the control group, with a Fisher exact test p-value of 0.14, likely due to the small number of positive cases.
We also attempted to correlate MC number with subcategories of PCD, finding that relapsed MM had the highest concentration of MC at 0.119%, while PCL had the lowest at 0.003%. No significant link was seen, even though MC numbers were supported by BM penetration as indicated by PC percentage. This contrasts with Devetzoglou et al. [10] who found a significant positive correlation, likely due to their larger sample size. Paolino et al. [23] studied the serum tryptase levels in melanoma patients as a clinicopathological study and found a significant correlation in early stages with malignant melanoma.
When mean MC percentages were juxtaposed with CRAB features, patients with CRAB features exhibited higher mean MC numbers than those without. However, various parametric and nonparametric tests could draw no significant association. Further comparisons of mean MC percentage with other disease activity parameters, including albumin, hematological parameters (Hb, TLC, platelet count), M-band quantification, κ/λ ratio, and radiological assessments, did not reveal any significant relationships. Although Devetzoglou et al. [10] found substantial associations with M-band quantification and radiological parameters, radiological data were unavailable for all our study cases.
Paolino et al. [23] studied serum tryptase levels in melanoma patients, finding a significant correlation in the early stages of malignant melanoma. Devetzoglou et al. [10] also observed high densities of tryptase-positive MC, showing a significant correlation of MCD with PCD. These studies and ours suggest a significant correlation between tryptase values and PCD. When plotting mean tryptase values against PCD subcategories, the highest value was in PCL at 24.2 ng/mL, and the lowest was 6.9 ng/mL for κ-LCD. Higher tryptase values might be associated with extravasation and metastasis.
Although the literature on the potential tumorigenic role of MC in PCD is limited, it has been observed that inflammatory MC, in addition to releasing tryptase and histamine, secrete a variety of cytokines, such as IL-1, IL-2, and IL-6, which significantly modulate the tumor microenvironment. These mediators promote the proliferation of PC and facilitate extravasation and metastasis [11]. Malignant PC, in turn, recruit additional MC, which elevate local levels of angiogenic factors, such as Ang-1, and matrix-degrading enzymes, all under the influence of the malignant cells [24–28]. Tryptase, in particular, promotes the formation of vascular tubes in vitro, stimulates endothelial cell proliferation, and activates proteases that degrade the extracellular matrix, releasing pro-angiogenic factors like VEGF and fibroblast growth factor 2 (FGF-2). Furthermore, MC contribute to immune system suppression by producing tissue necrosis factor α (TNFα) and IL-10, which are essential for fostering immune tolerance through regulatory T cells and promoting tumour growth [26].
Inflammatory markers can evidence this relationship between PCD and MC. Although our study found a somewhat linear relationship between inflammatory markers and MC, there are certain limitations. The sample size of 30 patients and 20 controls is relatively small, which may limit the generalizability of the findings. Larger, more diverse cohorts therefore are needed to confirm these findings. Also, the lack of cytokine analysis, use of a limited set of markers in flow cytometry, and single MC molecule (tryptase) prevent us from drawing definitive conclusions. The study therefore confirms the association but does not establish causality. Longitudinal studies are needed to determine whether elevated MC and tryptase levels precede the development of PCD or are a consequence of the disease. Once established, it may be interesting to know the effects of agents targeting MC proliferation like kinase inhibitors, MC stabilizers, or those blocking downstream signaling pathways [29].
In summary, this preliminary study reveals an alteration in MC numbers and MC tryptase levels in PCD, and MC might be contributing to the pathogenesis of PCD. Also, flow cytometry proves to be a valuable tool for enumerating MC in the context of PCD. Therefore, a large study with a better-defined cohort and analysis of tumour-MC interactions is required to elucidate the relationship between MC and PCD.
Abbreviations
| κ-LCD: | κ-light chain disease |
| Ang-1: | angiopoietin-1 |
| BM: | bone marrow |
| BMA: | bone marrow aspiration |
| IHC: | immunohistochemistry |
| IQR: | interquartile range |
| MC: | mast cells |
| MCD: | mast cell density |
| MGUS: | monoclonal gammopathies of undetermined significance |
| MM: | multiple myeloma |
| PC: | plasma cells |
| PCD: | plasma cell disorders |
| PCL: | plasma cell leukemia |
| ROC: | receiver operating characteristic |
| VEGF: | vascular endothelial growth factor |
Declarations
Author contributions
RY: Writing—original draft, Writing—review & editing. RT: Investigation, Data curation, Formal analysis, Writing—original draft. RWM: Writing—review & editing, Supervision. PM: Data curation. YK: Conceptualization, Data curation, Formal analysis, Writing—review & editing. All authors have read and approved the manuscript.
Conflicts of interest
None of the authors has any conflict of interest to disclose.
Ethical approval
The study was approved by the Institute Ethics Committee (IEC), PGIMER, Chandigarh, 160012, India (No: INT/IEC/2019/000143).
Consent to participate
Informed consent to participate in the study was obtained from all participants.
Consent to publication
Not applicable.
Availability of data and materials
The raw data supporting the conclusions of this manuscript will be made available by the authors, without undue reservation, to any qualified researcher.
Funding
The work has been supported by the Post Graduate Institute of Medical Education & Research, Chandigarh, India, Grant No. [71/8-Edu-15/1734]. The funders had no role in study design, data collection and analysis, decision to publish, or preparation of the manuscript.
Copyright
© The Author(s) 2025.
Publisher’s note
Open Exploration maintains a neutral stance on jurisdictional claims in published institutional affiliations and maps. All opinions expressed in this article are the personal views of the author(s) and do not represent the stance of the editorial team or the publisher.