Affiliation:
1Department of Biological Sciences-Microbiology Section, Faculty of Science, Jeddah University, Jeddah 21959, Saudi Arabia
ORCID: https://orcid.org/0000-0001-6741-9779
Affiliation:
1Department of Biological Sciences-Microbiology Section, Faculty of Science, Jeddah University, Jeddah 21959, Saudi Arabia
ORCID: https://orcid.org/0000-0003-3041-4573
Affiliation:
2Department of Obstetrics and Gynecology, King Abdullah Medical Complex, Ministry of Health, Jeddah 23816, Saudi Arabia
ORCID: https://orcid.org/0000-0003-1409-8187
Affiliation:
1Department of Biological Sciences-Microbiology Section, Faculty of Science, Jeddah University, Jeddah 21959, Saudi Arabia
Email: aaaljudaibi@uj.edu.sa
ORCID: https://orcid.org/0000-0002-5960-164X
Explor Med. 2023;4:612–624 DOI: https://doi.org/10.37349/emed.2023.00164
Received: December 31, 2022 Accepted: May 22, 2023 Published: September 04, 2023
Academic Editor: Feng Tian, Shandong Provincial Hospital Affiliated to Shandong University, Shandong Provincial Hospital Affiliated to Shandong First Medical University, China
The article belongs to the special issue The Role of Gut Microbiota and its Metabolites in Gastrointestinal Diseases
Aim: Childhood obesity is a global health concern that affects the daily life of children. It has a complex pathogenesis that involves genetic and nutritional factors among others. Moreover, the dysbiosis of gut microbiota has been recently associated with the development and progression of obesity.
Methods: A total of 43 faecal samples were collected from Saudi children; among them, 26 were normal and 17 were obese. Whole genomic DNA was extracted from their faecal samples and sequenced using an Illumina Sequencing platform.
Results: The gut microbiota was dominated by Phyla Firmicutes (69.00%) and Bacteroidetes (20.00%), followed by Actinobacteria (8.50%). In children with obesity, the abundance of Firmicutes was decreased, while Bacteroidetes was relatively enriched. Verrucomicrobia and Proteobacteria were not detected in the obese group, but they were found in low abundance in the control group. Phylum Firmicutes was dominated by the families Ruminococcaceae (17.86%) and Lachnospiraceae (41.20%). Less Ruminococcaceae was found in the obese group. Phylum Bacteroidetes was dominated by families Bacteroidaceae (12.98%) and Prevotellaceae (4.10%), which were enriched in the obese group. Genus Blautia (14.29%) was highly abundant, followed by Bacteroides (12.98%), Faecalibacterium (10.08%), Bifidobacterium (7.96%), and Prevotella (5.04%). Ruminococcus_g2 and _g4, Subdoligranulum, Roseburia, Fusicatenibacter, Anaerostipes, and Faecalibacterium were decreased (P > 0.05) in the obese group, while Streptococcus, Agathobacter, Prevotella, Bacteroides, and Bifidobacterium were increased (P > 0.05).
Conclusions: In conclusion, a diverse bacterial community was profiled in Saudi preschool children, and changes in bacterial community composition were observed between obese- and normal-weight children.
Childhood obesity is one of the most serious global health issues in children, and its pervasiveness has increased at an alarming rate [1]. According to the World Health Organization [2], childhood obesity is defined as an abnormal or excessive fat accumulation that may damage health. This puts them at an increased risk for multiple obesity-related health problems. Studies found that there is a strong relationship between obesity and non-communicable diseases (NCDs), such as heart disease, high blood pressure, various cancer types, type 2 diabetes mellitus (T2DM), osteoarthritis, and respiratory problems [3, 4].
The global prevalence of childhood obesity has increased at a disturbing rate, and it is presently one of the major public health threats [2]. Although it is still at a high level, childhood obesity levels appear to have stabilised in some high-income countries. However, it has an increasing predominance in children in numerous low- and middle-income countries [5].
According to the Global Burden of Disease Study 2013, 24% of boys and 23% of girls were overweight in 2013 from 17% and 16% in 1980, respectively [5]. Some studies established that overweight children and adolescents are more likely to be overweight or obese during adulthood [6, 7]. Obesity results in problems in their general health and well-being, and they suffer from obesity-related complications [7]. It is associated with a higher risk of developing NCDs at a young age and premature adult death, which depends in part on the age of onset and duration of obesity [8].
Obesity is a growing global health problem that increases the risk of several NCDs, including cardiovascular disease, diabetes, and cancer, in developed and developing countries [9]. NCDs, including cardiovascular disease, cancer, and diabetes, account for more than 70% of premature deaths worldwide and are the leading cause of premature death and disability, obesity is also associated with approximately 5–20 years of life lost depending on its severity and comorbidities, and it significantly increases the risk of metabolic diseases (e.g., T2DM and fatty liver disease), cardiovascular disease (hypertension, myocardial infarction, and stroke), musculoskeletal disease (osteoarthritis), Alzheimer’s disease, depression, and certain types of cancer (e.g., breast, ovarian, prostate, liver, kidney, and colon) [10].
Many comorbidities seen in young adults with obesity, including T2DM, dyslipidaemia, obstructive sleep apnoea, and steatohepatitis, were previously considered ‘adult’ diseases. The severity of these comorbidities usually increases with the severity of obesity [11].
Obesity has also been related to an increased risk of several types of cancer [12]. The second most avoidable cause of cancer in Britain is overweight and obesity; in more than 20 cancer cases, excess weight causes more than 1 in 20; the more weight a person gains and the longer they are overweight, the higher the risk [13]. It is associated with oesophageal, colon, rectal, and kidney cancer [5, 14].
The intestinal microbiome is composed of diverse bacterial species found in the gastrointestinal (GI) system. The gut microbiota of obese people is aberrant (dysbiosis). Obesity and T2DM are exacerbated by gut dysbiosis [9]. However, these processes may be disturbed due to changes in microbial composition, a condition known as dysbiosis [15]. The human GI tract is one of the biggest interfaces (250–400 m2) in the human body between the host, environmental variables, and antigens. It is home to a diverse and ever-changing community of bacteria known as the gut microbiota, and it is a collection of bacteria, archaea, and eukarya that co-evolved with the host over thousands of years to establish a complicated and mutually beneficial relationship. The number of microorganisms inhabiting the GI tract was estimated to reach 1014, which includes about 10 times more bacterial cells than human cells and more than 100 times the quantity of genetic material (microbiome) in the human genome [15].
The host and gut microbiota have developed a tight symbiotic relationship. This is not limited to the interchange of materials and information but also includes participation in the host’s nutrition, metabolism, excretion, and metabolite conversion. Host metabolism is a product of the body’s DNA and gut microbial genome [16].
The relationship between the gut microbiota and human health is becoming more well-acknowledged. It is now well-established that healthy gut microbiota is primarily responsible for the host’s general health. The bacteria in human gut play a crucial part in indigestion, and they may also play a role in whether the human become obese or not [17, 18]. A study concluded that the strong relationship between microbiome changes and obesity that is observed in mice does not apply to humans, because no significant differences in the Bacteroidetes/Firmicutes ratio were observed between obese and non-obese individuals [19]. Firmicutes and Bacteroidetes are two predominant bacteria in the gut microbiota, whose quantity is impacted by diet and body fat content. It was observed that Megamonas spp., Enterococcus, and Blautia, a Firmicutes bacteria was at least 2-fold more significantly abundant in obese children than in normal-weight [16, 20]. The abundance of Akkermansia from the phylum Verrucmiobia, an intestinal microflora, was increased in successful weight loss patients, whereas obese children revealed a significantly lower abundance in Akkermansia muciniphila and A. muciphilia-like bacteria [16, 21, 22].
This study aimed to investigate the relationship between the types of food consumed and obesity in preschool children and the reflection of these factors on the composition of their microbiota.
The Ethics Committee of Institutional Review Board of Ministry of Health approved the study protocols (approval number: A01436) on September 11, 2022.
A survey was done to parents of 79 children; 43 were included in this study and 14 were excluded for non-compliance with the criteria (https://forms.gle/47aFU3wrdAJLzQ4B6).
Faecal samples were collected from the children, placed in sterilised containers, and stored at 4℃. The children who were treated with antibiotics in the last 6 months and those who have diabetes and chronic disease like eczema, allergy, etc., were excluded.
Age and gender were recorded, and body mass index (BMI) was calculated. BMI Z-scores (Z-score Calculator) were derived according to the World Health Organization (WHO) Body mass index-for-age (BMI-for-age) child growth standards for children younger than 5 years [23].
The bacterial DNA was extracted using the Qiagen DNA extraction kit (QIAGEN, Germany), according to the manufacturer’s instructions [24]. The extracted DNA was stored at −20℃.
The 16S gene was amplified by PCR illumina (Macrogen, Korean), using primer sets 518F (5’-CCAGCAGCCGCGGTAATACG-3’) and 800R (5’-TACCAGGGTATCTAATCC-3’), which were based on sequences of conserved regions [25]. The Infection Disease Unit of King Fahad Medical Centre for Research, King Abdulaziz University sequenced the extracted DNA on February 15, 2020. The sequenced data were analysed using BLAST-NCBI [Available online: http://blast.ncbi.nlm.nih.gov/Blast.cgi (accessed on March 7, 2020)]. A phylogenetic tree was made using MEGA [Available online: http://www.megasoftware.net (accessed on August 21, 2021)].
After sequencing, FastQC program was used for quality control in evaluating the results, amounts of data, read qualities, GC distributions, kmer distributions, and possible adapter contamination for each sample [26]. Reads with poor read quality (Phred Score < Q20, 30 bp window range) were removed from all data, and chimeric sequences with possible adapter contaminants using the Trimmomatic tool [27]. Taxonomic profiling was performed using the Kraken2 [28], with the database of Silva 2020 serving SILVA-Database Commons (arb-silva.de) as a reference dataset [29]. The operational taxonomic unit (OTU) groups in each sample were determined after alignment. R scripts were used in data reporting, statistical analysis, and data visualization (https://www.R-project.org/).
In this study, the children included were 23 (53.49%) male and 20 (46.51%) female (Figure 1a), there ages include 23 (53.49%) were 2–3 years old, 8 (18.61%) were 3–4 years old, 6 (13.95%) were 4–5, and 6 (13.95%) were 5–6 years old (Figure 1b). In addition, 26 (60.47%) had a normal BMI, and 17 (39.53%) were obese. Moreover, 27 (62.79%) did not use antibiotics during the year of the study, while 13 (30.23%) used 1–2 antibiotics, and 3 (6.98%) used 3–4 and more than 5 antibiotics 6 months before collecting the faecal sample (Figure 2a and b).
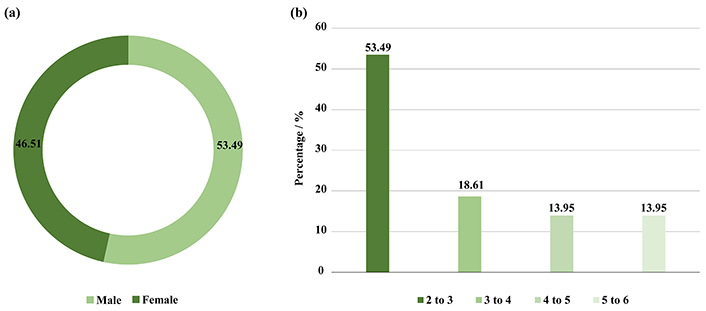
Illustrated (a) number of genders included in this study, (b) a percentage of age categories in the study groups
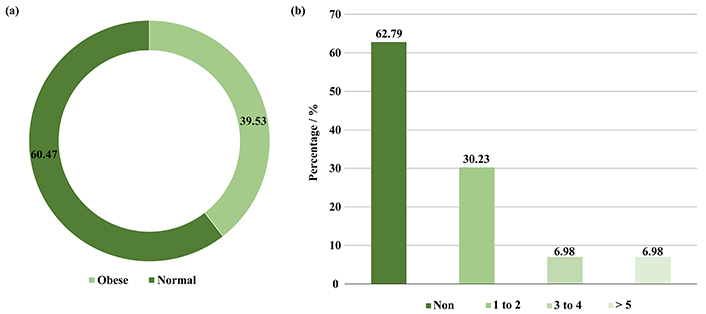
Depicted (a) BMI of preschool children, (b) number of antibiotics used by preschool children during the study year
According to the survey results (Figure 3), 38 (88.37%) of the children were eating breakfast, while 5 (11.63%) were not eating breakfast. Moreover, 31 (72.09%) of the children have eaten snacks between their meals, while 12 (27.91%) did not have snacks between their meals. As eating habits, 32 (74.42%) were eating in front of the television, while 11 (25.58%) were not eating in front of the television (Figure 3a). The consumption of fast-food and soft drinks showed 21 (48.84%) have eaten fast-food once a week, 12 (27.91%) were eating fast-food daily, while 10 (23.25%) never eat fast-food (Figure 3b). In terms of food type, the highest number of children who consume fruits and vegetables was up to 23 (53.49%), and children who consume nuts and chips with juice were 22 (51.16%), while the total number of children who consume sugar was 21 (48.84%). Moreover, the children who depend on only sugar were 7 (16.28%), and 9 (20.93%) rely only on juices, while 12 (27.91%) rely on fruits, vegetables, nuts, or chips (Figure 3c). On the other hand, the children’s meal depends on type of nutrient showing 15 (34.88%) of the children were eating carbohydrates, 5 (11.63%) were eating protein, and 11 (25.58%) were eating dairy and its derivatives, and the same number [11 (25.58%)] of children were eating all nutrient equally (Figure 3d).
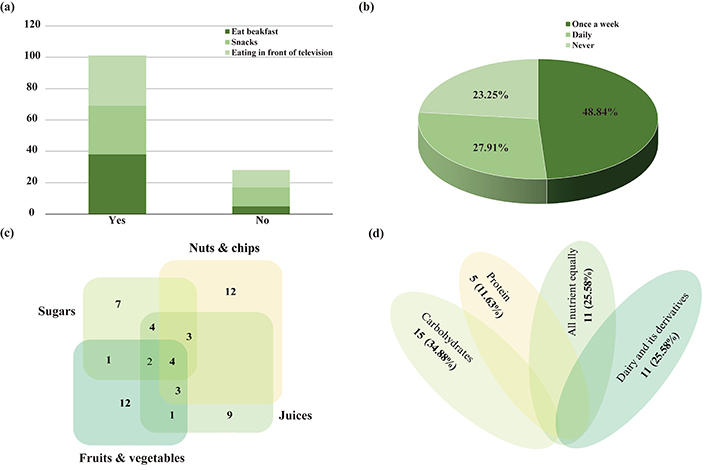
Eating habits and nutrition consumption of children under the study. (a) Diet habits; (b) consumption of fast-food and soft drinks; (c) types of snacks; (d) types of nutrition composition
To investigate the bacterial community, Illumina MiSeq sequencing was conducted, and 2,294,429 valid sequence reads and 12,368 OTUs were obtained from 43 normal and obese preschool children. The samples from normal children contained 47.7–69.7 thousand reads and 162–451 OTUs, while those from obese children had 42.6–60.7 thousand sequence reads and 162–418 OTUs (Table 1). The rarefaction curves constructed from OTUs reached saturation, showing that the obtained sequence reads were enough to represent the bacterial diversity in obese and normal subjects (Figure 4).
Microbial community richness and diversity indices of 16S rRNA sequences for clustering at 97% sequence similarity from 43 different preschool children
| Sample name | Target reads | OTUs | ACE | Chao | Jackknife | NPShannon | Shannon | Simpson | Phy. diversity | Good’s coverage of library (%) |
|---|---|---|---|---|---|---|---|---|---|---|
| Control_1_1 | 69,780 | 259 | 297.5 | 284.07 | 307.00 | 3.15 | 3.14 | 0.10 | 409 | 99.93 |
| Control_2_1 | 61,784 | 162 | 193.0 | 187.62 | 199.00 | 2.83 | 2.83 | 0.10 | 281 | 99.94 |
| Control_3_1 | 53,552 | 236 | 281.7 | 269.60 | 285.00 | 3.22 | 3.21 | 0.09 | 388 | 99.91 |
| Control_4_1 | 60,470 | 377 | 451.9 | 429.68 | 455.00 | 4.08 | 4.07 | 0.03 | 569 | 99.87 |
| Control_5_1 | 50,717 | 360 | 406.9 | 386.52 | 421.00 | 3.88 | 3.87 | 0.04 | 556 | 99.88 |
| Control_6_1 | 52,779 | 256 | 302.6 | 289.15 | 308.00 | 3.25 | 3.25 | 0.09 | 414 | 99.90 |
| Control_7_1 | 49,700 | 327 | 375.9 | 370.98 | 389.06 | 3.95 | 3.94 | 0.03 | 518 | 99.88 |
| Control_8_1 | 48,105 | 303 | 361.1 | 343.20 | 370.00 | 3.67 | 3.66 | 0.04 | 471 | 99.86 |
| Control_9_1 | 51,099 | 259 | 311.1 | 298.33 | 319.00 | 3.33 | 3.32 | 0.07 | 416 | 99.88 |
| Control_10_1 | 65,091 | 301 | 350.9 | 334.73 | 359.00 | 3.45 | 3.44 | 0.07 | 464 | 99.91 |
| Control_11_1 | 51,644 | 360 | 414.7 | 400.68 | 428.00 | 3.61 | 3.60 | 0.05 | 572 | 99.87 |
| Control_12_1 | 52,558 | 216 | 277.6 | 269.00 | 273.13 | 3.26 | 3.25 | 0.08 | 371 | 99.90 |
| Control_13_1 | 57,434 | 320 | 371.4 | 352.00 | 385.00 | 3.71 | 3.70 | 0.04 | 472 | 99.89 |
| Control_14_1 | 50,603 | 243 | 271.3 | 261.57 | 283.00 | 3.08 | 3.08 | 0.08 | 347 | 99.92 |
| Control_15_1 | 55,417 | 325 | 388.3 | 380.86 | 397.82 | 3.60 | 3.60 | 0.07 | 531 | 99.88 |
| Control_16_1 | 45,546 | 296 | 351.0 | 341.03 | 355.76 | 4.08 | 4.07 | 0.02 | 491 | 99.87 |
| Control_17_1 | 49,059 | 331 | 411.1 | 389.52 | 411.61 | 3.58 | 3.57 | 0.05 | 540 | 99.84 |
| Control_18_1 | 49,636 | 376 | 435.9 | 425.29 | 446.17 | 4.15 | 4.15 | 0.03 | 590 | 99.86 |
| Control_19_1 | 56,985 | 189 | 221.0 | 208.50 | 228.00 | 2.88 | 2.87 | 0.09 | 310 | 99.93 |
| Control_20_1 | 50,416 | 218 | 255.0 | 241.92 | 260.00 | 3.14 | 3.13 | 0.10 | 370 | 99.92 |
| Control_21_1 | 53,712 | 316 | 356.6 | 342.55 | 372.00 | 3.56 | 3.55 | 0.06 | 449 | 99.90 |
| Control_22_1 | 52,163 | 451 | 517.9 | 494.01 | 536.00 | 3.92 | 3.91 | 0.05 | 656 | 99.84 |
| Control_23_1 | 52,515 | 219 | 244.9 | 231.75 | 253.00 | 3.29 | 3.29 | 0.07 | 346 | 99.94 |
| Control_24_1 | 56,110 | 393 | 445.2 | 433.45 | 462.00 | 4.03 | 4.02 | 0.03 | 579 | 99.88 |
| Control_25_1 | 47,746 | 365 | 448.0 | 422.15 | 449.10 | 3.55 | 3.54 | 0.06 | 583 | 99.82 |
| Control_26_1 | 58,904 | 421 | 492.6 | 473.21 | 507.00 | 3.95 | 3.94 | 0.04 | 652 | 99.85 |
| Obese_27_1 | 60,744 | 232 | 272.4 | 263.53 | 276.00 | 2.99 | 2.98 | 0.13 | 389 | 99.93 |
| Obese_28_1 | 42,660 | 162 | 186.9 | 177.54 | 192.00 | 2.70 | 2.69 | 0.12 | 265 | 99.93 |
| Obese_29_1 | 59,831 | 203 | 234.1 | 222.59 | 240.00 | 2.85 | 2.85 | 0.11 | 318 | 99.94 |
| Obese_30_1 | 49,395 | 418 | 504.0 | 473.56 | 511.00 | 4.11 | 4.10 | 0.03 | 632 | 99.81 |
| Obese_31_1 | 58,618 | 261 | 299.6 | 284.06 | 310.00 | 3.38 | 3.37 | 0.07 | 414 | 99.92 |
| Obese_32_1 | 45,830 | 286 | 330.7 | 312.52 | 338.00 | 3.56 | 3.55 | 0.05 | 451 | 99.89 |
| Obese_33_1 | 56,615 | 186 | 233.2 | 217.36 | 232.00 | 2.70 | 2.69 | 0.11 | 312 | 99.92 |
| Obese_34_1 | 56,719 | 381 | 441.3 | 420.76 | 450.00 | 4.19 | 4.18 | 0.03 | 588 | 99.88 |
| Obese_35_1 | 43,701 | 385 | 448.0 | 439.81 | 461.73 | 4.08 | 4.07 | 0.04 | 613 | 99.83 |
| Obese_36_1 | 46,505 | 343 | 401.1 | 394.12 | 415.27 | 3.75 | 3.74 | 0.05 | 543 | 99.85 |
| Obese_37_1 | 53,604 | 286 | 328.4 | 317.32 | 339.00 | 3.14 | 3.13 | 0.09 | 446 | 99.90 |
| Obese_38_1 | 46,660 | 252 | 300.2 | 283.57 | 304.00 | 3.48 | 3.47 | 0.05 | 405 | 99.89 |
| Obese_39_1 | 55,664 | 220 | 282.4 | 269.68 | 279.45 | 2.93 | 2.92 | 0.09 | 349 | 99.90 |
| Obese_40_1 | 59,483 | 160 | 218.8 | 197.63 | 203.96 | 2.67 | 2.67 | 0.13 | 277 | 99.93 |
| Obese_41_1 | 50,994 | 189 | 227.5 | 216.44 | 228.00 | 3.09 | 3.09 | 0.09 | 307 | 99.92 |
| Obese_42_1 | 54,983 | 343 | 411.6 | 383.43 | 416.00 | 3.40 | 3.39 | 0.09 | 505 | 99.87 |
| Obese_43_1 | 46,898 | 182 | 214.8 | 199.00 | 216.00 | 2.87 | 2.87 | 0.11 | 298 | 99.93 |
ACE: alpha diversity index; Chao: chao1 index; Phy. diversity: phylogenetic diversity
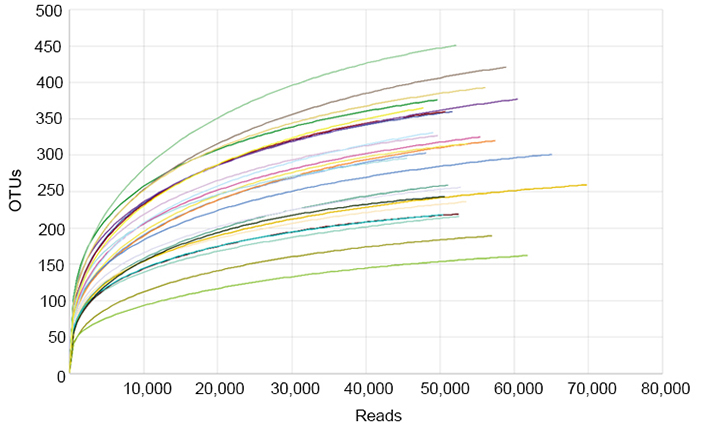
Rarefaction analysis of different samples. Rarefaction curves of OTUs clustered at 97% sequence identity for different samples
The bacterial community composition of the obese compared with the normal weight of preschool children is shown in Figure 5. As presented in Figure 5a, the bacterial communities were dominated by Firmicutes (69.17%) and Bacteroidetes (20.39%), followed by Actinobacteria (8.60%). Variations in bacterial community compositions were detected between the study groups. The level of Firmicutes was decreased while Bacteroidetes was increased (P > 0.05) in children with obesity, compared with that in preschool children with normal weight. Verrucomicrobia and Proteobacteria were also not detected in obese children, but these were detected in 1.19% and 1.00%, respectively, in the control group (Figure 5a).
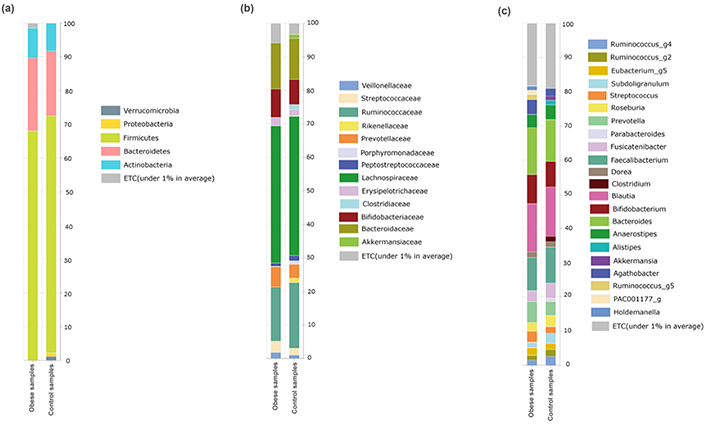
Relative abundance at different taxonomic rankings. (a) Relative abundance of phyla between the studied groups; (b) the abundance of families between obese and control groups relatively; (c) the abundant of genera detected in the studied groups
In the control group, the Phylum Firmicutes was mainly composed of Lachnospiraceae (41.20%), Ruminococcaceae (17.86%), Streptococcaceae (2.70%), Erysipelotrichaceae (2.24%), Veillonellaceae (1.42%), Peptostreptococcaceae (1.38%), and Clostridiaceae (0.77%). Additionally, families Bacteroidaceae (12.98%) and Prevotellaceae (4.10%) dominated phylum Bacteroidetes. Bifidobacteriaceae (7.45%) and Akkermansiaceae (1.19%) of phylum Actinomycetes and Verrucomicrobia, respectively, were detected in this study (Figure 5b). Families Bifidobacteriaceae, Bacteroidaceae, Prevotellaceae, Streptococcaceae, and Erysipelotrichaceae were relatively increased (P > 0.05) in the obese group, while Veillonellaceae, Peptostreptococcaceae, and Ruminococcaceae were found in relatively low abundance in the obese group. In addition, Rikenellaceae, Porphyromonadaceae, and Clostridiaceae were not detected in the obese group, but these were found in low abundance in the control group (Figure 5b).
The abundance of bacterial genera in the obese and control groups was studied. Blautia (14.29%) was highly abundant, followed by Bacteroides (12.98%), Faecalibacterium (10.08%), Bifidobacterium (7.96%), and Prevotella (5.04%). Some genera, such as Ruminococcus_g2 and _g4, Subdoligranulum, Roseburia, Fusicatenibacter, Anaerostipes, and Faecalibacterium, were relatively decreased (P > 0.05), while other genera like Streptococcus, Agathobacter, Prevotella, Bacteroides, and Bifidobacterium were relatively increased (P > 0.05) in the obese group. Moreover, Akkermansia and Clostridium were not detected in the obese group, while Ruminococcus_g5 and Holdemanella were detected in the obese group but not in the control group (Figure 5c).
Bacteroides sp. 2_1_22, Flammevirga yaeyamensis, Chlamydia psittaci, Bifidobacterium breve, and Erysipeiotrichaceae bacterium 3_1_53 was not detected in the control group, but these were considerably abundant in the obese group. Salmonella enterica was recorded in relatively low abundance (P > 0.05) in the obese group compared with that in the control group (Figure 6).
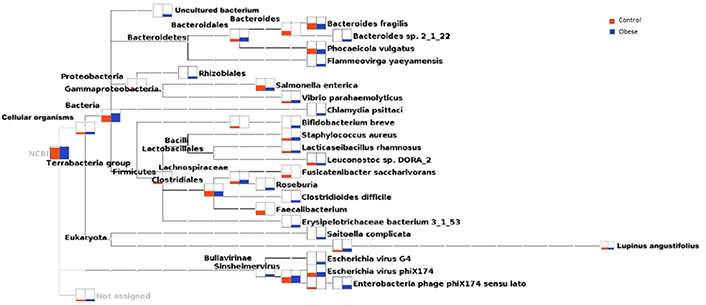
Phylogenetic relationship of cellular organisms, including bacteria, and the relative abundance of various organisms in the obese and control groups
The gut microbial community has a critical role in the regulation of energy metabolism and fat storage, and it is strongly associated with the incidence and progression of obesity [30–33]. Previous studies established the changes in the composition and decrease in diversity of the gut microbiota in obese people and rats [34]. The present study is the first to compare the gut bacterial community composition changes between Saudi’s healthy and obese preschool children. In this study, the bacterial diversity in 26 normal and 17 obese children was systematically analysed using next-generation sequencing technology. The microbial community composition was altered between the study groups.
There is a direct relationship between the type of food and habits during eating food and obesity; the presence of high percentage of children who depend on carbohydrates and dairy and its derivatives for their nutrition, fast food and eating these foods in front of television maybe one of the causes of obesity in the children under study, and this is consistent with many studies investigated the relationship between the type of food and obesity in preschool children and childhood [35–39].
A healthy human GI tract is inhabited by six bacterial phyla: Firmicutes, Bacteroidetes, Proteobacteria, Actinobacteria, Fusobacteria, and Verrucomicrobia [40, 41]. Firmicutes and Bacteroidetes account for > 90%. Herein, Firmicutes, Bacteroidetes, Actinobacteria, Verrucomicrobia, and Proteobacteria were detected; among these, Firmicutes and Bacteroidetes dominated (about 90%). Different findings were reported regarding the changes in Firmicutes and Bacteroidetes. Some studies reported that Firmicutes increased in obese children, while Bacteroidetes was decreased [42–44], whereas the findings of other studies showed an increase in both Firmicutes and Bacteroidetes in obese children [45]. The present study revealed a relative decrease in Firmicutes and an increase in Bacteroidetes communities in children with obesity compared to that in preschool children with normal weight. In a healthy gut, Bacteroidetes have a critical role in plant polysaccharide degradation, which cannot be absorbed by the human body; it also helps in nutrient metabolism, together with other bacteria. The Bacteroidetes community is reduced by a long-term high-fat diet, affecting the absorption of polysaccharides and proteins, and resulting in the development of obesity [46].
Our study revealed that Ruminococcus was reduced in obese children, similar to the findings of a Chinese study [7]. Ruminicoccus is an important genus contained in sclerenchyma along with other bacteria; this performs fermentation functions, degrades food fibers that cannot be digested by the human body into absorbable short-chain fatty acids (acetic acid, propionic acid, butyric acid, and lactic acid), and increases energy intake through intestinal absorption [47]. In this study, Bifidobacterium was found in relatively high abundance in obese children than in normal weight children; this finding was in contrast to previous studies in which reduced Bifidobacterium was found [48, 49]. The contrasting findings may be due to variations in lifestyle and diet adopted by the study subjects. Some genera, particularly Streptococcus, were found in relatively high abundance in obese preschool children. Our findings are in consistent with a previous study conducted in China on the association of gut microbiota alteration with childhood obesity [7]. Some studies previously confirmed that Streptococcus is closely related to Crohn’s disease (CD), and Streptococcus is significant in the inflammatory mucosal section of patients with CD [50]. However, only a few studies associated genera like Streptococcus with obesity; hence, further research is needed. Our findings also support that genera like Streptococcus are associated with childhood obesity. The results indicating an association of Akkermansia, Clostridium, Sutterella, and Ruminococc in the obese children are in line with the results found by Reyna et al. [51]. The association of these genera after one year old was found ether by [52–54].
In our study, numerous limitations should be considered. This is a cross-sectional study, and the casual effects of gut microbes on obesity could not be established. The sample size was also not enough to investigate the association of preschool children’s gut microbiota with obesity. The selected subjects also represented the gut microbial community of a specific area. Despite our inclusion and exclusion criteria, the results were strongly influenced by various factors of sampled individuals. In this study, the samples were collected at a certain time, but long-term observations would be more appropriate to investigate the changes in GI tract microbial communities.
BMI: body mass index
GI: gastrointestinal
NCDs: non-communicable diseases
OTU: operational taxonomic unit
T2DM: type 2 diabetes mellitus
The authors thank the participants in this research, their contribution in our study gave the results of this research. Also, we like to thank the Saudi Digital Library (SDL) for access to the publications for free.
SMAJ: Investigation, Writing—original draft. EAAJ: Conceptualization, Investigation. YAAG: Validation, Conceptualization. AAAJ: Writing—review & editing, Supervision. All authors read and approved the submitted version.
The authors declare that they have no conflicts of interest.
The Ethics Committee of Institutional Review Board of Ministry of Health approved the study protocols (approval number: A01436) on September 11, 2022.
The informed consent to participate in the study was obtained from all participants, including parents and/or guardians.
Not applicable.
The datasets of parents’ survey for this study can be found in the questionnaire of the health and nutritional condition of children (https://forms.gle/47aFU3wrdAJLzQ4B6). Data of parents’ consent statement is available upon request.
Not applicable.
© The Author(s) 2023.
Copyright: © The Author(s) 2023. This is an Open Access article licensed under a Creative Commons Attribution 4.0 International License (https://creativecommons.org/licenses/by/4.0/), which permits unrestricted use, sharing, adaptation, distribution and reproduction in any medium or format, for any purpose, even commercially, as long as you give appropriate credit to the original author(s) and the source, provide a link to the Creative Commons license, and indicate if changes were made.
View: 3204
Download: 64
Times Cited: 0
Giuseppe Merra ... Marco Marchetti
Maciej Chichlowski ... Neeraj Pandey
Yuka Ikeda ... Satoru Matsuda
Kevin V. Houston ... David A. Johnson
Lindsey B. Cundra ... David A. Johnson
Byung Soo Yoo ... David A. Johnson
