 Original Article

Affiliation:
1CereHealth Corporation, Littleton, CO 80120, USA
Email: LQuandt@ceremetrix.io
ORCID: https://orcid.org/0000-0002-4061-3309
Affiliation:
2Mallinckrodt Institute of Radiology, Washington University in St. Louis, St. Louis, MO 63110, USA
ORCID: https://orcid.org/0000-0002-9086-0105
Explor Med. 2020;1:331–354 DOI: https://doi.org/10.37349/emed.2020.00022
Received: April 23, 2020 Accepted: September 20, 2020 Published: October 30, 2020
Academic Editor: Rhoda Au, Boston University School of Medicine, USA
The article belongs to the special issue Digital Biomarkers: The New Frontier for Medicine and Research
Aim: Quantitative analysis of brain single photon emission computed tomography (SPECT) perfusion imaging is dependent on normative datasets that are challenging to produce. This study investigated the combination of SPECT neuroimaging from a large clinical population rather than small numbers of controls. The authors hypothesized this “population template” would demonstrate noninferiority to a control dataset, providing a viable alternative for quantifying perfusion abnormalities in SPECT neuroimaging.
Methods: A total of 2, 068 clinical SPECT scans were averaged to form the “population template”. Validation was three-fold. First, the template was imported into SPECT brain analysis software, MIMneuro®, and compared against its control dataset of 90 individuals through its region and cluster analysis tools. Second, a cohort of 100 cognitively impaired subjects was evaluated against both the population template and MIMneuro®’s normative dataset to compute region-based metrics. Concordance and intraclass correlation coefficients, mean square deviations, total deviation indices, and limits of agreement were derived from these data to measure agreement and test for noninferiority. Finally, the same patients were clinically read in CereMetrix® to confirm that expected perfusion patterns appeared after comparison to the template.
Results: MIMneuro®’s default threshold for normality is ± 1.65 z-score and this served as our noninferiority margin. Direct comparison of the template to controls produced no regions that exceeded this threshold and all clusters identified were far from statistically significant. Agreement measures revealed consistency between the softwares and that CereMetrix® results were noninferior to MIMneuro®, albeit with proportional bias. Visual analysis also confirmed that expected perfusion patterns appeared when individual scans were compared to the population template within CereMetrix®.
Conclusions: The authors demonstrated a population template was noninferior to a smaller control dataset despite inclusion of abnormal scans. This suggests that our patient-based population template can serve as an alternative for identifying and quantifying perfusion abnormalities in brain SPECT.
The application of functional neuroimaging, specifically with neuronuclear single photon emission computed tomography (SPECT), presents a number of advantages for brain diagnostics. First, brain SPECT demonstrates perfusion abnormalities (hypo or hyperperfusion) in disorders such as Alzheimer’s disease (AD) [1] and traumatic brain injury (TBI) [2] that may not be evident in conventional structural imaging. Second, brain SPECT is more freely available in the office setting compared to the alternative neuronuclear modality, positron emission tomography (PET). Unlike PET, SPECT studies do not require close proximity to a cyclotron, thus improving patient access. Third, brain SPECT studies are cheaper than PET scans by at least half the cost [3]. These characteristics make SPECT an attractive modality for diagnostics of aberrant brain function.
Evaluation of any diagnostic imaging study begins with visual observations of what is different from normal. This approach proves challenging in SPECT since perfusion levels naturally vary in different regions of the brain and among different people [4, 5]. Thus, purely visual interpretation of such scans risks negative impacts of subjectivity and interobserver variability.
The concept of quantitative analysis of brain SPECT scans has been well established for decades [6–9] but clinical grade software programs are relatively recent by comparison. Such programs are important for maximizing the utility of SPECT in clinical practice. Tools now incorporate analyses that quantify the magnitude of deviation from normal perfusion [10–13], reducing subjectivity and improving consistency and speed. The American College of Radiology (ACR) guidelines for brain SPECT reflect this shift by recommending quantitative assessment and comparison to normative datasets [5], although it is widely recognized that true values of physiologic properties like normal perfusion are impossible to measure with absolute certainty [14–16]. Normative datasets serve, at best, as surrogates for an already ambiguous truth.
SPECT normative datasets are challenging to produce [17]. Brain SPECT scans are only recommended for certain medical conditions [5] and would unnecessarily expose healthy individuals to radioactivity [18]. Other barriers include difficulty accessing a large representative sample of control subjects and the potentially prohibitive financial burden of data collection. For these reasons, companies and research groups that have invested in their own normative datasets are often reluctant to share with others who seek to quantitatively evaluate SPECT brain data. This keeps the size of commercial FDA-cleared normative datasets rather small, ranging from only 35 to 90 subjects [13, 19–21], and limits competition from other groups seeking to improve SPECT quantitative tools.
We propose an alternative to traditional normative datasets by creating a “population template” that combines SPECT brain scans from a large number of clinical patients instead of a small number of healthy individuals. The outgoing impressions for these patients included TBI, toxic exposure, neuropsychiatric disorders, and others, resulting in a large heterogeneous dataset with no single defining perfusion pattern. We hypothesized that this template would prove noninferior to a smaller control dataset and therefore provide a viable substitute for use in identifying and quantifying brain perfusion abnormalities in SPECT scans.
All retrospective data analysis was done in accordance with Institutional Review Board approval (IntegReview IRB Certificate CHDB112019). In partnership with CereHealth Corporation, a total of 3, 047 of their most recent patients were assessed for inclusion in either the population template or a dataset for template validation. At the time of this study, this convenience sample was the full extent of data available for retrospective research purposes.
All scans were acquired between the years of 2006 and 2019 from individuals across the United States and were processed according to protocols set forth by the ACR and the supervising imaging clinic, CereScan. Subjects were excluded if they had not consented their scan to be used in research (n = 424), if their scan data was missing ( n = 188), if they did not complete a baseline scan ( n = 26), if their scan was of questionable quality ( n = 10), or if they had broken protocol ( n = 4).
CereScan had labelled each scan with one or more outgoing diagnostic impressions derived from the reading radiologist’s report. These classifications were not ground truth but permitted useful grouping of subjects. These labels were utilized to identify a dataset for template validation.
Given the existing literature on SPECT in the differential diagnosis of dementias [22–24], subjects were filtered for the following labels assigned to their scan’s outgoing impressions: dementia, AD, frontotemporal dementia (FTD), cognitive impairment, and neurodegenerative processes. Subjects also had these labels if such processes could not be ruled out during the read.
The filtered dataset contained 200 scans with five duplicates. We verified each subject’s inclusion by reviewing their clinical data, if available, for signs of cognitive impairment in their reported symptoms, history, and cognitive assessment scores. Due to changes in data collection over time, we found that recent patient records were consistently more complete. For this reason and resource constraints for radiologist reads, only 100 of the most recently acquired scans were chosen for inclusion in this cognitively impaired cohort (43 females and 57 males, mean age ± SD, 63.83 ± 11.98 years, Table 1). No duplicates were included.
Summary characteristics about the subjects contained in MIMneuro®’s control dataset, the population template, and the cognitively impaired cohort. While the age range, mean, and standard deviation of MIMneuro®’s controls were reported in [13], the median was not provided. The race/ethnicity of their controls were also not disclosed
| MIMneuro® controls | Population template | Cognitively impaired cohort | ||
|---|---|---|---|---|
| Age | Mean ± SD | 43.88 ± 15.48 years | 37.22 ± 17.29 years | 63.83 ± 11.98 years |
| Median | Unknown | 37 years | 65 years | |
| Range | 10–89 years | 4–83 years | 22–87 years | |
| Sex | Male | 39 | 1, 189 | 57 |
| Female | 51 | 879 | 45 | |
| Race/Ethnicity | White | 0 | 1, 493 | 78 |
| Hispanic or Latino | 0 | 125 | 1 | |
| Black or African American | 0 | 57 | 3 | |
| Asian | 0 | 18 | 0 | |
| American Indian or Alaskan Native | 0 | 9 | 0 | |
| Middle Eastern or North African | 0 | 2 | 0 | |
| Native Hawaiian or other Pacific Islander | 0 | 1 | 1 | |
| Two or more of the above | 0 | 50 | 1 | |
| Unknown | 90 | 313 | 16 | |
| Total number of subjects | 90 | 2, 068 | 100 | |
For the population template, the remaining set of scans were filtered to exclude subjects with gross structural abnormalities (n = 61), no recorded outgoing diagnostic impressions ( n = 16), and duplicates ( n = 50). The final cohort of 2, 068 subjects contained 879 women and 1, 189 men with ages ranging from 4 to 83 years (mean ± SD, 37.22 ± 17.29 years, Table 1, Figure 1). The most common diagnostic impressions assigned to these patients were TBI (n = 1, 768), anxiety disorder ( n = 1, 046), and mood disorder (n = 1, 018) with a high incidence of comorbidity evident in the population (84%).
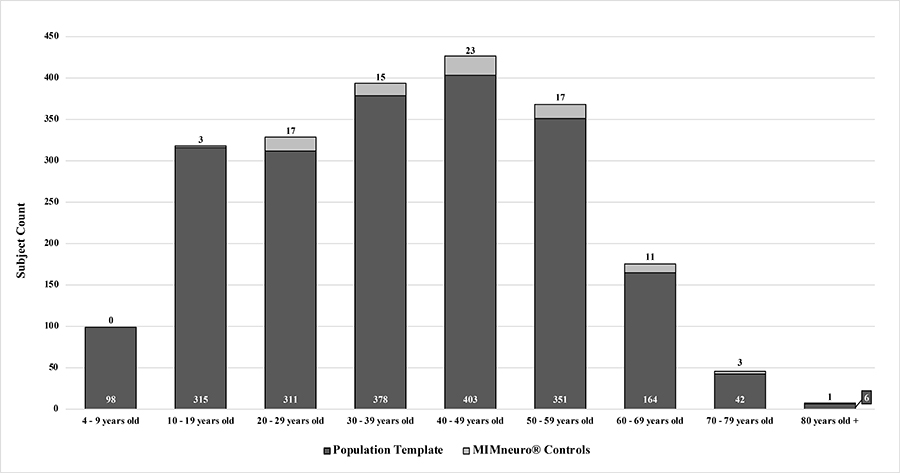
Age distribution of subjects in population template versus the controls contained within MIMneuro®
All SPECT scans were performed within the guidelines set forth by the ACR [5]. Patients were instructed to abstain from certain medications for 24–48 h including stimulants, opiates, barbiturates, and benzodiazepines, as well as caffeine, alcohol, over-the-counter medications containing caffeine, and illicit drugs. Patients were also directed to abstain from nicotine for 10 h prior to the scan.
Fifteen min prior to tracer injection, each patient was made comfortable in a dimly lit and quiet room while an intravenous line was placed. The patient was asked to rest with sound dampening headphones on and their eyes closed. After 15 min, radiopharmaceutical technetium-99m hexamethylpropyleneamine oxime (Tc99m-HMPAO) was injected into the bloodstream via the intravenous line. Uptake into the brain occurred within two min [4, 25]. After injection, each patient rested in the same room for an additional five minutes. Approximately one hour later, the patient was placed supine on the camera bed and their head held still by a cloth strap across the forehead. Scan times varied among patients but typically lasted 20 to 30 min to collect a minimum of approximately 5 million counts.
Segami Corporation’s Oasis software (Version 1.9.4.9) was used for image preprocessing. Each scan was reconstructed using filtered back projection and a Butterworth filter. Chang attenuation correction [26] was performed on all images. All raw sinograms and linograms were inspected by a nuclear medicine technologist for evidence of motion and corrected, as needed, using the built-in Cedars-Sinai MoCo application [27]. Brain volumes were then manually masked with ellipses by a nuclear medicine technologist to exclude non-neural uptake.
After masking, each reconstructed volume was sent through CereMetrix® software (Version 1.0) for registration. This software first thresholded the volume using Otsu’s method [28]. The original and thresholded versions were then mapped to the Montreal Neurological Institute (MNI) standard single subject brain template [29] using an affine transformation with 12 degrees of freedom. The optimal transformation for each volume was determined using the advanced mattes mutual information metric (MI) and adaptive stochastic gradient decent. The transformation with the higher MI was then applied to the original data and image intensities were normalized to the average intensity value of the whole brain [30].
After processing, all scans were exported and a script averaged the intensity values of each voxel across all scans to compute the population template. That is, every voxel in the template represented an average of 2, 068 normalized intensity values at the same location in each scan (Figure 2).
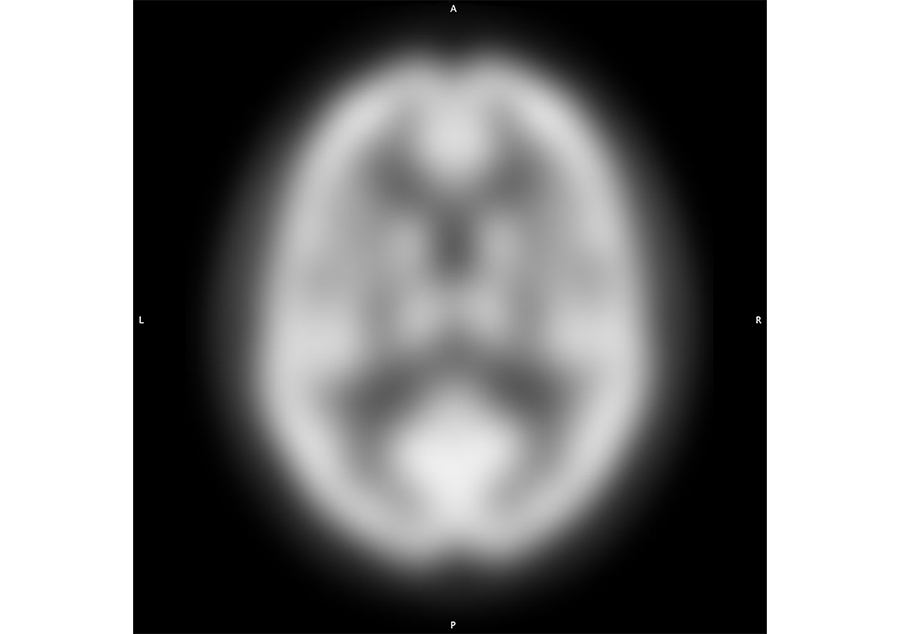
Axial cross section of the population template generated from 2, 068 clinical scans acquired at standard SPECT resolution and processed as described for display in the MNI single subject space
Ideally, the population template would be evaluated against true values or a reference standard, such as a phantom or digital reference object, to assess the technical performance associated with its use in quantifying brain perfusion abnormalities [31]. To our knowledge, no publicly available physical or digital SPECT reference standard has been widely accepted to model normal cerebral perfusion [15]. Therefore, validation of the population template is restricted to comparisons against softwares containing normative databases.
For this study, the population template was imported into quantitative SPECT brain analysis software, MIMneuro® (Version 6.7.12), and mathematically compared against its normative dataset through their region and cluster analysis tools. This is one of the largest control datasets in commercial software, containing Tc99m-HMPAO SPECT brain scans from 90 healthy volunteers (51 females and 39 males, mean age = 43.88 ± 15.48 years, Table 1, Figure 1) [13, 19]. A custom MIMneuro® workflow was built to import the template, normalize voxel intensities to the mean value for the whole brain, register the template to its proprietary brain atlas, and identify regions of interest (ROI) at varying levels of anatomical detail. MIMneuro®’s registration tool, BrainAlignTM, has been previously described [32]. The workflow then compared each voxel of the template to the same voxel in the controls. A z-score was calculated at every voxel to quantify its difference from the controls and generate a z-score map. Voxel z-scores were then aggregated and averaged according to their anatomical region assignment and 95% confidence intervals (CIs) were calculated and corrected for multiple comparisons using the conservative Bonferroni method [33, 34]. The region results were assessed for noninferiority using MIMneuro®’s default threshold for normality, 1.65 z-score, as the noninferiority margin [13]. CIs within this margin would indicate that the population template was noninferior to MIMneuro®’s normative dataset [31].
MIMneuro®’s default voxel analysis was then used to identify clusters of abnormal voxels that may span region borders. The following parameters dictated how the software identified clusters: P-value, minimum volume, and minimum z-score. The P-value determined the statistical significance level of the cluster, or the likelihood that a cluster was truly abnormal rather than occurring by chance [13]. The P-value parameter was set to one to identify all clusters, regardless of statistical significance. The minimum volume parameter, which defined the minimum size of the cluster in milliliters, was set to zero to return clusters of any size. Finally, only voxels that met the minimum z-score requirement were eligible for clustering. We set this parameter to 1.65 z-score to correspond to MIMneuro®’s default threshold for normality and our noninferiority margin.
The template and controls are both intended to serve as comparison datasets for quantifying deviations from typical perfusion in individual scans. However, each software deploys proprietary processing prior to this calculation that could impact the final output of perfusion measurements even if the population template was found to be sufficiently close to MIMneuro®’s normative. Therefore, assessing agreement between the z-score data generated from the template and controls within their respective softwares would further support whether measurements made from the template are noninferior to those made from the normative dataset.
The population template was integrated into a research-only instance of the CereMetrix® image processing pipeline that performed registration and normalization of image voxel values (previously described in “Population template generation” section) and calculated a z-score at every voxel to quantify its difference from the population template. This pipeline also designated an anatomical label for each voxel corresponding to a region contained within the automatic anatomical labeling atlas (AAL) [35].
The cohort of 100 cognitively impaired subjects was used to compare z-score results generated by CereMetrix® using the population template to those by MIMneuro® using its controls. Their scans were acquired, reconstructed, and motion corrected in Oasis software and then separately processed in both CereMetrix® and MIMneuro® for spatial registration, intensity normalization, and z-score calculation, as previously described. All average region z-scores were exported for analysis in Python™ or Microsoft® Excel.
Since the regions identified by each software were not identical due to registration and atlas differences, smaller regions were grouped into left and right internal or lobar (frontal, temporal, parietal) structures (Table 2). MIMneuro® automatically addresses this issue by offering the lobar structures as individual regions, but it does not do so for internal structures. Instead, a script was written to average the average z-scores for these regions from both MIMneuro® and CereMetrix® data. However, to generate data for CereMetrix® lobar structures consistently with MIMneuro®, the script only performed one average across the voxels of the smaller structures. This resulted in eight measurements per patient for a final total of 800 measurements from each software.
Summary of regions that were aggregated to create four metrics for each patient of the cognitively impaired cohort
| MIMneuro® | CereMetrix® | |
|---|---|---|
| Frontal lobe | Frontal lobe | Anterior orbital gyrusGyrus rectusInferior frontal gyrus, pars opercularisInferior frontal gyrus, pars orbitalisInferior frontal gyrus, pars triangularisLateral orbital gyrusMedial orbital gyrusMedial orbitofrontal cortexMiddle frontal gyrusOlfactory cortexPosterior orbital gyrusPrecentral gyrusSuperior frontal gyrusSuperior frontal gyrus, medial partSupplementary motor area |
| Parietal lobe | Parietal lobe | Angular gyrusInferior parietal lobulePostcentral gyrusPrecuneusSuperior parietal lobuleSupramarginal gyrus |
| Temporal lobe | Temporal lobe | Fusiform gyrusHeschl’s gyrusInferior temporal gyrusMiddle temporal gyrusMiddle temporal poleSuperior temporal gyrusSuperior temporal pole |
| Internal structures | AmygdalaCaudateCingulate gyrusGlobus pallidusHippocampusParahippocampal gyrusPutamenThalamus | AmygdalaAnterior cingulate gyrusCaudateGlobus pallidusHippocampusMiddle cingulate gyrusParahippocampal gyrusPosterior cingulate gyrusPutamenThalamus |
Agreement metrics often assume that the data are normally distributed. All data and their differences between softwares were graphed on probability plots to confirm this prior to the calculation of the following scaled and unscaled agreement indices: concordance and intraclass correlation coefficients [CCC, ICC(3,1)] [36, 37], mean squared deviations (MSD) [31], total deviation indices (TDI) [38], and Bland-Altman plots with limits of agreement (LOA) [39, 40]. 95% CIs were calculated for each metric [34, 36], corrected for multiple comparisons using the Bonferroni method [33], and, where appropriate, compared against the noninferiority margin.
Despite the objectivity and standardization that region-based quantitative metrics bring to brain SPECT reads, the spatial distribution of perfusion abnormalities is limited when voxel z-scores are averaged across ROIs. It is the spatial distribution of voxel z-scores that is most utilized by physicians performing individual brain SPECT reads, not ROI-averaged metrics. Agreement between softwares, present or not, bears no merit on the clinical utility of the population template if established voxel-wise perfusion patterns do not appear. Accurate reads are dependent on them.
To assess this, a single reader (CR) with extensive experience in reading Tc99m-HMPAO SPECT brain scans was trained on the CereMetrix® platform and given access the clinical and imaging data for each deidentified subject in the cognitively impaired cohort. This reader categorized his observed impressions of perfusion patterns as normal, AD, FTD, Lewy body dementia, TBI, vascular dementia, mixed dementia, indeterminate, or other psychiatric pattern. These categorizations were then compared with the original impressions generated by six readers using other SPECT analysis platforms. Concordance was evaluated in Microsoft® Excel using Krippendorff’s alpha statistic for multiple raters with 95% CIs [41, 42] and interpreted like other kappa statistics: 0.0–0.2 as slight agreement, 0.21–0.4 as fair agreement, 0.41–0.6 as moderate agreement, 0.61–0.8 as substantial agreement, and over 0.8 as nearly perfect agreement [43]. Substantial to near perfect agreement between readers’ impressions, despite the use of different softwares and comparison datasets, would support the clinical utility of the population template for individual patient analysis.
The average z-score deviations from the controls for each region of MIMneuro®’s atlas are given in Table 3 while their summary statistics and histogram of their distribution are in Figure 3. No regions of the population template fell outside ± 1 z-score, 84% were within ± 0.5 z-score, and no CIs exceeded the noninferiority margin of ± 1.65 z-score.
Mean z-scores and 95% CIs quantifying the population template’s deviation from MIMneuro®’s controls for every region in MIMneuro®’s proprietary atlas
| Region | Mean [95% CI] | Region | Mean [95% CI] | Region | Mean [95% CI] | Region | Mean [95% CI] |
|---|---|---|---|---|---|---|---|
| Amygdala (L) | −0.28 [−0.34, −0.22] | Inf. frontal gyrus (L) | −0.43 [−0.45, −0.41] | Middle orbital gyrus (L) | −0.09 [−0.11, −0.07] | Retrosplenial area (L) | 0.09 [0.02, 0.16] |
| Amygdala (R) | −0.84 [−0.93, −0.75] | Inf. frontal gyrus (R) | −0.45 [−0.47, −0.43] | Middle orbital gyrus (R) | −0.31 [−0.37, −0.25] | Retrosplenial area (R) | −0.06 [−0.10, −0.02] |
| Angular gyrus (L) | 0.33 [0.31, 0.35] | Inf. frontal gyrus, pars opercularis (L) | −0.57 [−0.61, −0.52] | Middle temporal gyrus (L) | 0.49 [0.46, 0.52] | Rolandic operculum (L) | −0.37 [−0.40, −0.34] |
| Angular gyrus (R) | 0.13 [0.11, 0.15] | Inf. frontal gyrus, pars opercularis (R) | −0.59 [−0.62, −0.56] | Middle temporal gyrus (R) | 0.46 [0.43, 0.49] | Rolandic operculum (R) | −0.55 [−0.59, −0.51] |
| Anterior cingulate gyrus (L) | 0.15 [0.13, 0.17] | Inf. frontal gyrus, pars orbitalis (L) | −0.37 [−0.42, −0.32] | Nucleus accumbens (L) | −0.04 [−0.07, −0.01] | Subcallosal area (L) | −0.12 [−0.20, −0.04] |
| Anterior cingulate gyrus (R) | 0.22 [0.19, 0.25] | Inf. frontal gyrus, pars orbitalis (R) | −0.25 [−0.31, −0.19] | Nucleus accumbens (R) | −0.33 [−0.43, −0.23] | Subcallosal area (R) | −0.13 [−0.21, −0.05] |
| Anterior orbital gyrus (L) | −0.03 [−0.05, −0.01] | Inf. frontal gyrus, pars triangularis (L) | −0.32 [−0.35, −0.29] | Occipital lobe (L) | 0.56 [0.54, 0.58] | Sup. cerebellar peduncle (L) | 0.18 [0.09, 0.27] |
| Anterior orbital gyrus (R) | −0.12 [−0.20, −0.04] | Inf. frontal gyrus, pars triangularis (R) | −0.41 [−0.45, −0.37] | Occipital lobe (R) | 0.32 [0.31, 0.33] | Sup. cerebellar peduncle (R) | 0.22 [0.15, 0.29] |
| Basis pontis | 0.06 [0.05, 0.07] | Inf. medial frontal gyrus (L) | −0.51 [−0.55, −0.47] | Olfactory cortex (L) | −0.04 [−0.06, −0.02] | Sup. frontal gyrus (L) | 0.26 [0.24, 0.28] |
| Brain stem | 0.07 [0.06, 0.08] | Inf. medial frontal gyrus (R) | −0.86 [−0.91, −0.81] | Olfactory cortex (R) | −0.42 [−0.57, −0.27] | Sup. frontal gyrus (R) | 0.26 [0.24, 0.28] |
| Caudate (L) | −0.10 [−0.13, −0.07] | Inf. occipital gyrus (L) | 0.48 [0.43, 0.53] | Orbitofrontal region (L) | −0.18 [−0.29, −0.16] | Sup. medial frontal gyrus (L) | −0.11 [−0.13, −0.09] |
| Caudate (R) | −0.15 [−0.20, −0.10] | Inf. occipital gyrus (R) | 0.28 [0.24, 0.32] | Orbitofrontal region (R) | −0.41 [−0.45, −0.37] | Sup. medial frontal gyrus (R) | −0.13 [−0.15, −0.11] |
| Cerebellar hemisphere (L) | 0.59 [0.57, 0.61] | Inf. temporal gyrus (L) | 0.63 [0.59, 0.67] | Paracentral lobule (L) | −0.17 [−0.19, −0.15] | Sup. occipital gyrus (L) | 0.53 [0.50, 0.56] |
| Cerebellar hemisphere (R) | 0.29 [0.28, 0.30] | Inf. temporal gyrus (R) | 0.11 [0.10, 0.12] | Paracentral lobule (R) | −0.12 [−0.14, −0.10] | Sup. occipital gyrus (R) | 0.51 [0.48, 0.54] |
| Cerebellar vermis | 0.51 [0.48, 0.54] | Insula (L) | −0.35 [−0.38, −0.32] | Parahippocampal gyrus (L) | 0.20 [0.16, 0.24] | Sup. parietal lobule (L) | 0.24 [0.22, 0.26] |
| Cerebellum | 0.45 [0.44, 0.46] | Insula (R) | −0.83 [−0.87, −0.79] | Parahippocampal gyrus (R) | −0.20 [−0.23, −0.17] | Sup. parietal lobule (R) | 0.12 [0.10, 0.14] |
| Cingulate gyrus (L) | 0.09 [0.07, 0.11] | Lateral orbital gyrus (L) | −0.12 [−0.15, −0.09] | Parietal lobe (L) | 0.15 [0.14, 0.16] | Sup. temporal gyrus (L) | 0.34 [0.30, 0.38] |
| Cingulate gyrus (R) | 0.08 [0.06, 0.10] | Lateral orbital gyrus (R) | −0.35 [−0.42, −0.28] | Parietal lobe (R) | −0.03 [−0.04, −0.02] | Sup. temporal gyrus (R) | 0.13 [0.09, 0.17] |
| Cuneus (L) | 0.23 [0.20, 0.26] | Lateral temporal lobe (L) | 0.44 [0.42, 0.46] | Pons | 0.08 [0.07, 0.09] | Supplementary motor area (L) | −0.03 [−0.05, −0.01] |
| Cuneus (R) | 0.2 [0.17, 0.23] | Lateral temporal lobe (R) | 0.25 [0.23, 0.27] | Pontine tegmentum | 0.14 [0.12, 0.16] | Supplementary motor area (R) | −0.01 [−0.02, 0.00] |
| Frontal lobe (L) | −0.02 [−0.03, −0.01] | Lingual gyrus (L) | 0.65 [0.61, 0.69] | Postcentral gyrus (L) | 0.18 [0.16, 0.20] | Supramarginal gyrus (L) | 0.31 [0.29, 0.33] |
| Frontal lobe (R) | −0.08 [−0.09, −0.07] | Lingual gyrus (R) | 0.13 [0.11, 0.15] | Postcentral gyrus (R) | −0.03 [−0.05, −0.01] | Supramarginal gyrus (R) | −0.05 [−0.08, −0.02] |
| Fusiform gyrus (L) | 0.76 [0.73, 0.79] | Medial orbital gyrus (L) | −0.29 [−0.33, −0.25] | Posterior cingulate gyrus (L) | −0.01 [−0.03, 0.01] | Temporal lobe (L) | 0.39 [0.37, 0.41] |
| Fusiform gyrus (R) | 0.08 [0.07, 0.09] | Medial orbital gyrus (R) | −0.54 [−0.61, −0.47] | Posterior cingulate gyrus (R) | 0.00 [−0.03, 0.03] | Temporal lobe (R) | 0.10 [0.09, 0.11] |
| Globus pallidus (L) | 0.04 [−0.01, 0.09] | Medial temporal lobe (L) | 0.17 [0.14, 0.20] | Posterior orbital gyrus (L) | −0.17 [−0.20, −0.14] | Temporal operculum (L) | −0.57 [−0.62, −0.52] |
| Globus pallidus (R) | −0.3 [−0.35, −0.25] | Medial temporal lobe (R) | −0.28 [−0.31, −0.25] | Posterior orbital gyrus (R) | −0.59 [−0.68, −0.50] | Temporal operculum (R) | −0.57 [−0.63, −0.51] |
| Gyrus rectus (L) | −0.40 [−0.49, −0.31] | Medulla | 0.11 [0.08, 0.14] | Precentral gyrus (L) | 0.23 [0.20, 0.26] | Temporal pole (L) | −0.27 [−0.31, −0.23] |
| Gyrus rectus (R) | −0.46 [−0.56, −0.36] | Midbrain | 0.04 [0.02, 0.06] | Precentral gyrus (R) | 0.07 [0.04, 0.10] | Temporal pole (R) | −0.40 [−0.44, −0.36] |
| Heschl gyrus (L) | 0.03 [−0.02, 0.08] | Middle cerebellar peduncle (L) | 0.01 [0.00, 0.02] | Precuneus (L) | −0.21 [−0.23, −0.19] | Thalamus (L) | 0.70 [0.66, 0.74] |
| Heschl gyrus (R) | −0.32 [−0.39, −0.25] | Middle cerebellar peduncle (R) | 0.01 [0.00, 0.02] | Precuneus (R) | −0.23 [−0.25, −0.21] | Thalamus (R) | 0.47 [0.43, 0.51] |
| Hippocampus (L) | 0.11 [0.06, 0.16] | Middle frontal gyrus (L) | 0.21 [0.19, 0.23] | Primary visual cortex (L) | 0.42 [0.39, 0.45] | Whole brain | 0.10 [0.10, 0.10] |
| Hippocampus (R) | −0.45 [−0.50, −0.40] | Middle frontal gyrus (R) | 0.41 [0.39, 0.43] | Primary visual cortex (R) | 0.35 [0.32, 0.38] | ||
| Inf. cerebellar peduncle (L) | 0.11 [−0.10, 0.32] | Middle occipital gyrus (L) | 0.72 [0.68, 0.76] | Putamen (L) | 0.07 [0.05, 0.09] | ||
| Inf. cerebellar peduncle (R) | 0.06 [−0.10, 0.22] | Middle occipital gyrus (R) | 0.37 [0.35, 0.39] | Putamen (R) | −0.47 [−0.51, −0.43] | ||
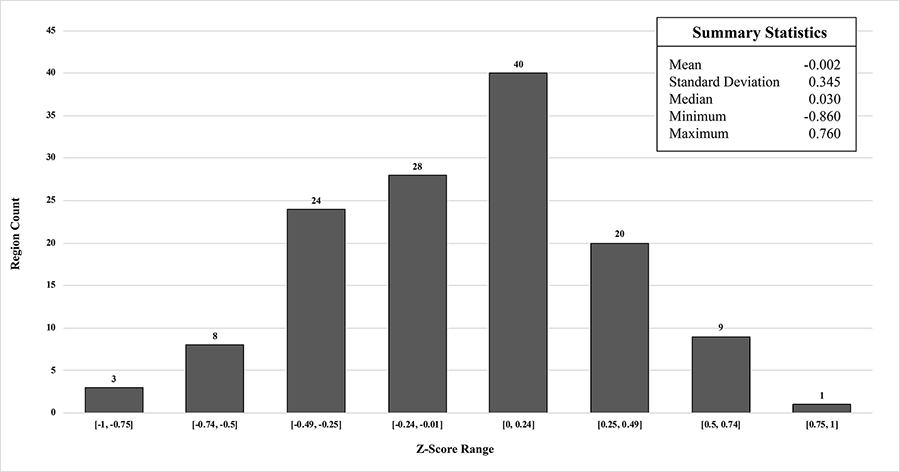
Histogram of region mean z-scores and their summary statistics from comparison of population template to MIMneuro® controls
Voxel analysis produced nine clusters that met the criteria described previously (Table 4). The largest cluster (11.53 mL) had an average z-score of 1.9 and spanned areas of the left lateral temporal and occipital lobes (Figure 4). This cluster and all others had low statistical significance ( P ≥ 0.93).
Summary statistics for clusters identified in population template using MIMneuro® voxel analysis. Parameters were a P-value of 1 minimum volume of 0 mL, and minimum z-score of 1.65
| Statistic | Cluster 1 | Cluster 2 | Cluster 3 | Cluster 4 | Cluster 5 | Cluster 6 | Cluster 7 | Cluster 8 | Cluster 9 |
|---|---|---|---|---|---|---|---|---|---|
| Mean | 1.90 | 1.87 | −1.85 | −1.66 | −1.67 | −1.67 | −1.74 | −1.71 | 1.66 |
| Standard deviation | 0.21 | 0.14 | 0.16 | 0.01 | 0.01 | 0.01 | 0.04 | 0.03 | 0.00 |
| Median | 1.84 | 1.85 | −1.81 | −1.66 | −1.67 | −1.67 | −1.72 | −1.71 | 1.66 |
| Minimum | 1.65 | 1.65 | −2.22 | −1.67 | −1.68 | −1.69 | −1.78 | −1.74 | 1.66 |
| Maximum | 2.65 | 2.19 | −1.65 | −1.65 | −1.66 | −1.65 | −1.69 | −1.67 | 1.66 |
| Volume (mL) | 11.53 | 2.62 | 1.67 | 0.10 | 0.08 | 0.05 | 0.04 | 0.02 | 0.02 |
| P-value | 0.93 | 0.99 | 0.99 | 1.00 | 1.00 | 1.00 | 1.00 | 1.00 | 1.00 |
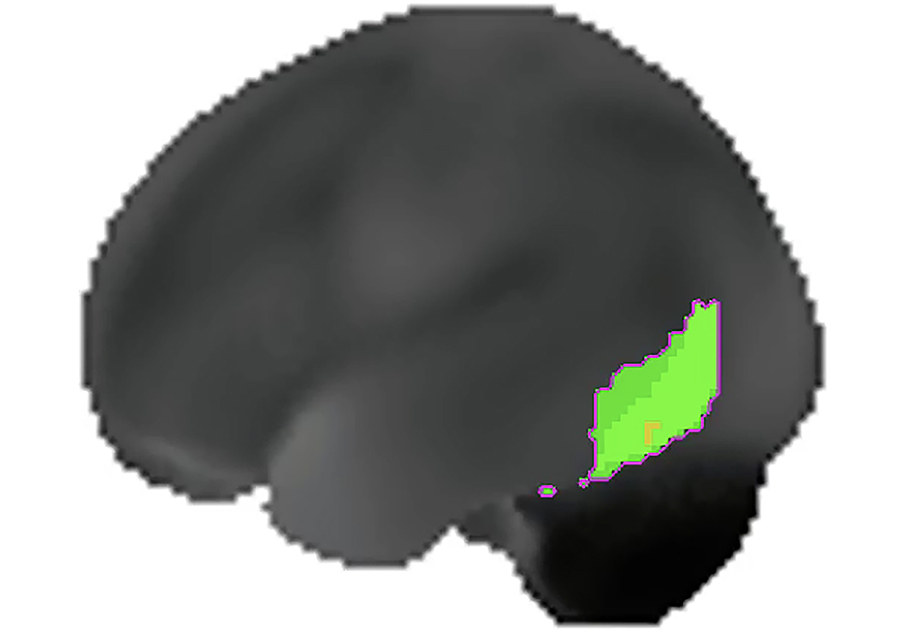
The largest cluster (P = 0.93) identified in the population template using MIMneuro® cluster analysis tools spanned portions of the left temporal and occipital lobes. This image depicts the left hemisphere surface projection of the population template with the cluster highlighted in green
Probability plots first confirmed that the data and their differences were approximately normally distributed (Figures S1–3). Scaled and unscaled agreement indices are summarized for each region in Table 5. The first scaled metric calculated was the CCC, a dimensionless quantity that can vary from −1 to 1, similar to Pearson’s correlation coefficient. When interpreted the same way, the CCCs generated from our data indicated poor to moderate agreement between the softwares, with CCC CIs ranging from 0.339 to 0.888 [34]. The ICC(3,1) is related to the CCC but instead evaluates consistency between softwares such that their measurements are allowed to differ with some amount of error. In our data, the ICC CIs ranged from 0.555 to 0.905, indicating moderate to good consistency between the softwares [44]. Both the CCC and ICC are dimensionless metrics and were therefore not compared to the noninferiority margin.
Scaled (CCC, ICC) and unscaled (MSD, TDI) agreement metrics and 95% CIs calculated between CereMetrix® data and MIMneuro® data
| Region | CCC [95% CI] | ICC(3,1) [95% CI] | MSD [95% CI] | TDI95% [95% CI] | |
|---|---|---|---|---|---|
| Frontal lobe | L | 0.730 [0.607, 0.819] | 0.790 [0.661, 0.874] | 0.064 [0.044, 0.094] | 0.498 [0.409, 0.604] |
| R | 0.608 [0.464, 0.720] | 0.758 [0.613, 0.853] | 0.097 [0.070, 0.137] | 0.613 [0.503, 0.743] | |
| Parietal lobe | L | 0.820 [0.718, 0.888] | 0.841 [0.738, 0.905] | 0.067 [0.046, 0.099] | 0.508 [0.418, 0.617] |
| R | 0.795 [0.679, 0.873] | 0.818 [0.703, 0.891] | 0.076 [0.052, 0.113] | 0.542 [0.446, 0.659] | |
| Temporal lobe | L | 0.500 [0.339, 0.633] | 0.718 [0.555, 0.828] | 0.168 [0.123, 0.231] | 0.805 [0.663, 0.970] |
| R | 0.760 [0.643, 0.843] | 0.767 [0.626, 0.859] | 0.068 [0.046, 0.101] | 0.512 [0.421, 0.623] | |
| Internal structures | L | 0.806 [0.718, 0.868] | 0.812 [0.694, 0.888] | 0.110 [0.075, 0.163] | 0.652 [0.536, 0.792] |
| R | 0.814 [0.729, 0.875] | 0.821 [0.708, 0.893] | 0.086 [0.058, 0.127] | 0.574 [0.472, 0.697] |
MSDs are the expected squared differences between the softwares’ measurements. Satisfactory agreement is reached when MSDs are less than or equal to the square of the noninferiority margin, or 2.72 [37]. The 95% CIs for MSDs in our data were much less than that, ranging from 0.044 to 0.231.
TDI is the absolute difference in measurements that achieves a desired coverage probability. In our data, TDI CIs computed to achieve 95% coverage probability range from 0.409 to 0.970 z-score. Satisfactory agreement is achieved when the TDI is less than the noninferiority margin, which was true here.
While unscaled indices (MSD, TDI) suggested CereMetrix® results were substantially noninferior to MIMneuro®, the scaled indices (CCC, ICC) did not support full agreement. Lines of equality showed this clearly; paired measurements between the softwares trend with the equality line but are scattered around it (Figures 5 and 6). CereMetrix® results do not exactly equal MIMneuro® results.
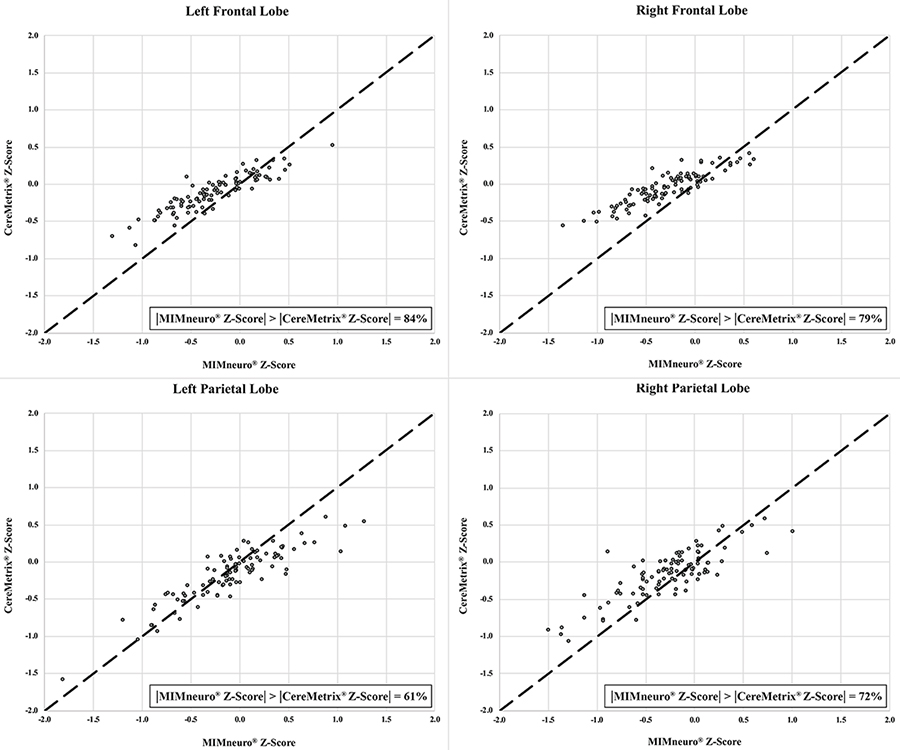
Frontal and parietal lobe equality plots between CereMetrix® and MIMneuro® data showing their scatter around the line of equality. The proportion of measurements where MIMneuro®’s z-score magnitude was greater than the corresponding CereMetrix® z-score magnitude is also given
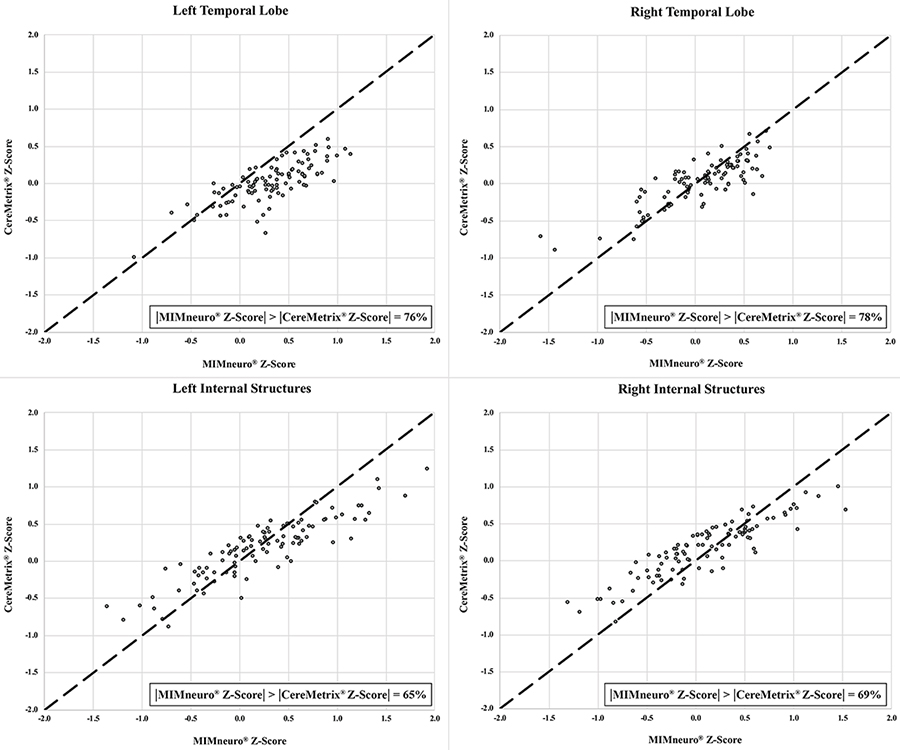
Temporal lobe and internal structures equality plots between CereMetrix® and MIMneuro® data showing their scatter around the line of equality. The proportion of measurements where MIMneuro®’s z-score magnitude was greater than the corresponding CereMetrix® z-score magnitude is also given
These differences between the softwares were evaluated with Bland-Altman plots and LOAs. The traditional horizontal LOA plots revealed proportional bias and slight heteroscedasticity that could not be remedied by recommended methods like ratios, percent differences, or log transformations (Figure 7). Therefore, simple linear regression was used to find the line of best fit and new LOAs (Figure 8) [39, 40, 45, 46]. LOAs define the range where most differences between these softwares are expected to lie. This was true for our data, as 97–99% fell between the confidence bounds of these LOAs.
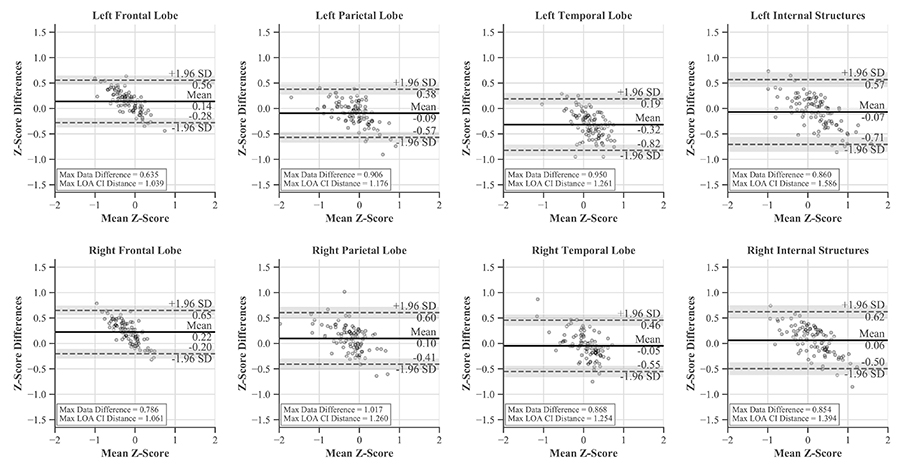
Bland-Altman plots with horizontal LOAs and CIs for each region. While much of the data is contained within the LOAs, proportional bias is evident
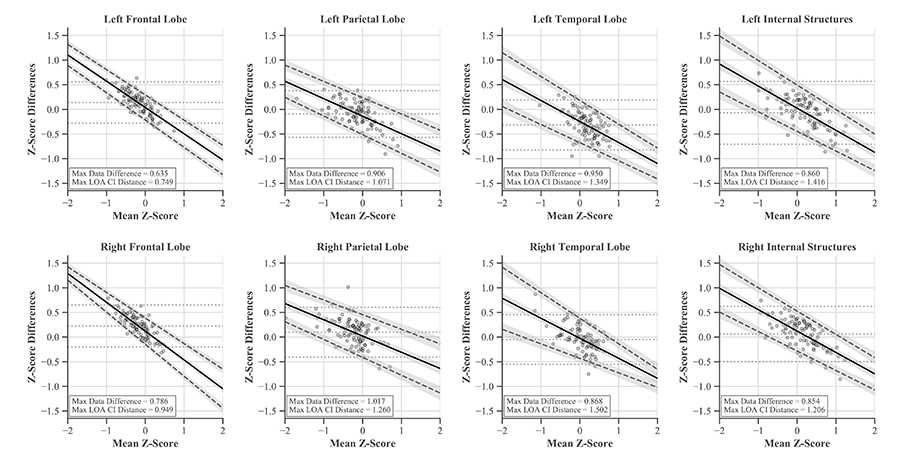
Bland-Altman plots with linear LOAs and CIs for each region accounting for proportional bias present in the data. Original mean and horizontal LOAs are represented by light gray dashed lines
The largest single difference between the softwares was 1.017 z-score and occurred in the right parietal lobe. The largest systemic difference was in the left temporal lobe, with its average differences amounting to −0.32 z-score while the others ranged from −0.09 to 0.22 (Figure 7).
For each ROI, proportional bias manifested as a negative relationship between software differences and the mean of their values. This relationship was most pronounced in the frontal lobes and least in the parietal lobes. Since all differences were calculated by subtracting MIMneuro®’s value from CereMetrix®’s, the negative slope was caused by MIMneuro®’s z-score magnitude consistently exceeding CereMetrix®’s in 61–84% of each region’s measurements (Figures 5 and 6).
LOAs were narrowest in the frontal lobes and widest in the right temporal lobe. This region also contained the most noticeable heteroscedasticity, with variability decreasing for positive means and increasing for negative means. No individual measurement differences exceeded ± 1.65 z-score and none of the LOA CIs extended beyond those boundaries when the mean z-score was between −2 and 2. Thus we are 95% confident that the difference in future measurements would also be within ± 1.65 z-score.
Finally, the single reader fully agreed with the impressions documented by the original physicians in 80 of the 100 cases in the cognitively impaired cohort. Krippendorff’s alpha was 0.72 with a 95% CI of 0.61 to 0.82. In 10 cases, the reader agreed with a portion of the impressions but not the final conclusions. The remaining 10 cases were completely discordant. Examples from the cohort analyzed in CereMetrix® presenting established perfusion patterns of AD, FTD, and TBI are given in Figures 9–11.
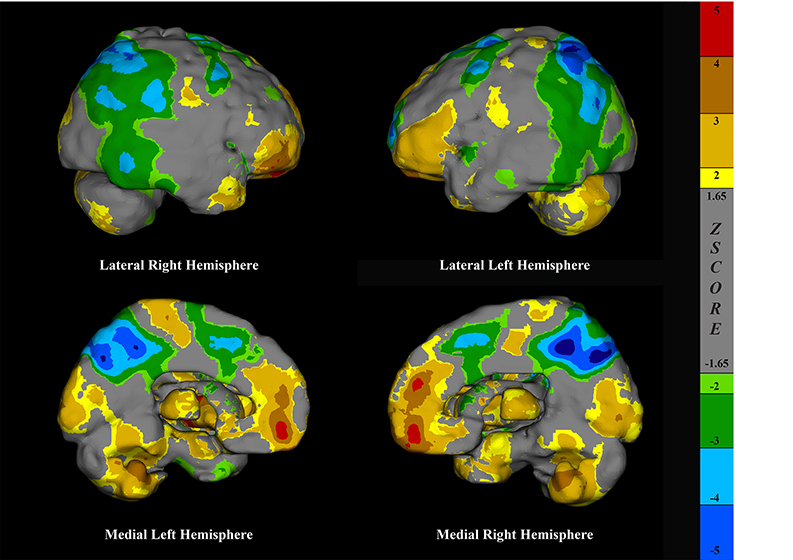
Surface projections of a brain SPECT scan rendered in CereMetrix® demonstrating temporal parietal hypoperfusion in a person with suspected AD
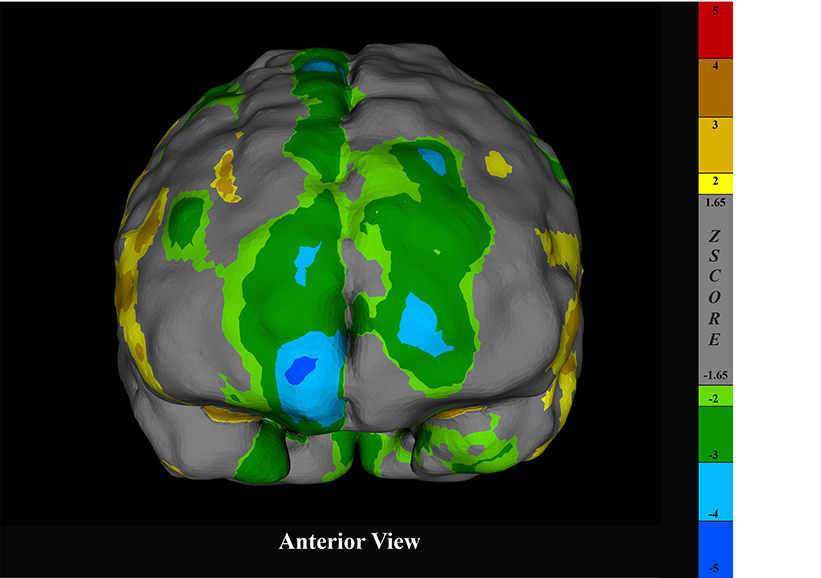
Surface projection of a brain SPECT scan rendered in CereMetrix® demonstrating frontal hypoperfusion in a person with suspected FTD
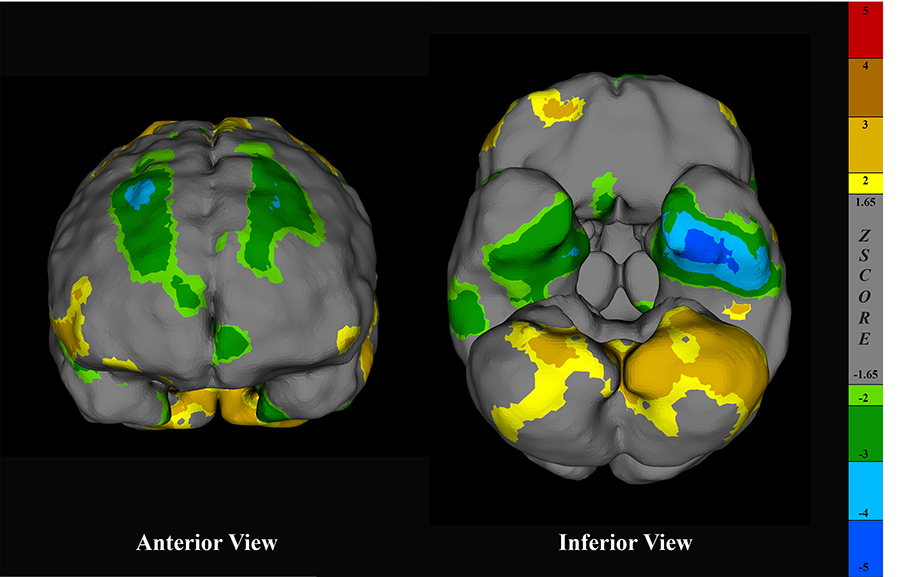
Surface projections of a brain SPECT scan rendered in CereMetrix® demonstrating asymmetric frontal and temporal hypoperfusion in a person with suspected TBI
Quantitative metrics for brain SPECT analysis are dependent on normative datasets but building them is challenging and expensive. For such investment, the number of participants in commercial normative datasets is frequently small [13, 19–21], limiting age ranges and subsequent comparisons to single subjects [47]. This study created an alternative to traditional normative datasets using a large clinical collection of abnormal scans and established noninferiority to the controls contained in a commercial product.
Various normative datasets have characterized cerebral perfusion across SPECT tracers [25, 48, 49], age or sex groups [50–54], spatial normalization templates [55, 56], and processing or equipment [57–59], yet no work to our knowledge has ever compared control databases of commercial products to each other. Controls are essential to any study investigating abnormal perfusion patterns, but the diseased cohort typically homogenous by design. No other group has attempted to substantiate noninferiority between a heterogeneous cohort of abnormal brain SPECT scans and a set of controls.
Direct quantitative comparison demonstrated that the population template was noninferior to MIMneuro®’s normative dataset. Despite this, CereMetrix® and MIMneuro® softwares do not employ identical processing methods when comparing individual scans against their respective datasets. Investigation of their quantitative results on individual subjects was warranted to ensure noninferiority was sustained following integration of the template into the CereMetrix® pipeline.
Metrics generated from both softwares’ region-based data gave mixed results. CCCs and ICCs indicated poor to moderate agreement yet moderate to good consistency between the software measurements, but these indices are difficult to interpret from a clinical perspective because they are dimensionless. MSDs and TDIs were calculated for this purpose and they suggested satisfactory agreement and noninferiority.
The equality and Bland-Altman plots revealed why the results from the scaled and unscaled indices were seemingly inconsistent. While the CereMetrix® and MIMneuro® measurements trend with each other, they were not equal and proportional bias existed between them. This bias was caused in part by the magnitude of MIMneuro®’s measurements often exceeding those of CereMetrix®. However, no individual differences or LOAs crossed the noninferiority margin. From a clinical perspective, this is satisfactory agreement and CereMetrix® quantification using the population template is noninferior to MIMneuro®’s quantification using their normative dataset.
Nonetheless, the bias observed in the Bland-Altman plots cannot be ignored. The mean of the measurements within our data did not exceed ± 2 z-score but it is clear that the LOAs may eventually cross the noninferiority margin as z-score magnitude grows. We find this unlikely for the broad anatomical regions analyzed here, but if the relationship were maintained for smaller structures, differences in z-score magnitude may be unsatisfactory. Our data cannot make any conclusions on this possibility. In practice, this bias means that quantitative results from MIMneuro® could be more extreme in magnitude and yield less specific perfusion pattern results than CereMetrix®.
MIMneuro®’s default threshold for normality is ± 1.65 z-score though some softwares use ± 2 z-score to increase the specificity of their results [60]. Within these bounds, the differences between the softwares are acceptable. However, from a clinical perspective, once an area of the brain crosses those thresholds, is it the z-score magnitude or the spatial pattern of abnormalities that dictates the diagnosis? If the former, the risk of software differences interfering with clinical decision making is legitimate. If the latter, increasing differences between the softwares at more extreme z-scores become immaterial.
Our work did not investigate how perfusion quantification is ultimately translated into diagnostic impression, but we did need to ensure consistency of clinical reads between the softwares. The secondary reads performed on the cognitively impaired cohort demonstrated substantial concordance between the single reader using the population template within CereMetrix® and the original impressions produced by six other readers. While not perfect, the observed Krippendorff’s alpha and percent agreement were consistent with or exceeded those previously recorded [61–65].
Direct comparison of our results to these dated works is complicated by key differences in SPECT scan presentation. All performed strictly two-dimensional visual analyses, at least two used films instead of computer displays for scan review [61, 62], and two reported using grayscale instead of applying color tables [61, 62]. These methodological choices now conflict with ACR guidelines for brain SPECT, which explicitly recommend computer display for three-dimensional viewing, color table adjustment, and quantitative analysis [5]. Additionally, Hellman’s and Pasquier’s work evaluated agreement in scan appearance or ROI severity ratings instead of the resulting diagnosis. Our study, like Stockbridge, Doran, and Barnes, measured agreement in diagnostic interpretation. Only Barnes introduced software assistance from Statistical Parametric Mapping, reporting a kappa of 0.5 between the readers. We are unaware of any recent work that has evaluated interobserver variability of diagnostic impression in Tc99m-HMPAO brain SPECT using quantitative software.
Our study achieved full concordance in 80% of the cases, partial concordance in 10%, and full discordance in 10%. While our statistics were conservative in considering partial concordance as disagreement, the data were more nuanced. In seven of the partial concordance cases, one reader proposed a mixed etiology of two conditions while the other selected one of those conditions exclusively. In the other three cases, one reader chose a primary condition but noted a second possibility while the other considered this second condition to be the primary. This potentially highlights differences in reader interpretation rather than differences in perfusion pattern.
Such interobserver variability is not uncommon, particularly in the context of clinical cognitive impairment data [64]. Gold standard diagnoses for this patient group can only be determined postmortem [66], challenging all dementia research. Despite this, our data’s consistency with prior work indicates that established perfusion patterns for conditions like AD [67, 68], FTD [69, 70], and TBI [71, 72] were in fact observable after comparison to the population template.
Our work was limited by the inability to perform raw voxel comparisons between the population template and any other dataset of controls. Instead, direct comparisons were limited to the tools available through MIMneuro®’s interface. A number of methodological differences may have also broadly influenced our results, including acquisition and reconstruction equipment and parameters, processing algorithms, reference templates and atlases, and anatomical region parcellations. Notwithstanding these challenges, our work provides a unique, though seemingly incongruous, alternative to normative datasets.
It is possible that these results would change if a subset of the scans used for the template were selected or if more were added, particularly if the resulting dataset was biased toward a specific condition. Our approach depends on data heterogeneity. We presumed heterogeneity given the clinical nature of these scans and the array of conditions within it, but the diagnostic impression labels assigned to them do not guarantee heterogeneity across each image’s voxels. How to define and measure sufficient heterogeneity to model normal perfusion is an open question. Our only solution, for now, is to validate each newly generated template independently.
This is why future work will require similar validation of the population template when segmented by age or sex. It is well documented that perfusion patterns change over the course of our lifetimes [50–54] so the ability to compare individual patients to subjects within their age range is imperative. We will be challenged to find suitable comparison datasets that are representative of normal perfusion in limited age ranges, particularly for children and young adults. For example, though MIMneuro® contains one of the largest normative datasets, their young adult population only has three controls and may not constitute an ideal reference.
Quantifying image-derived metrics is of increasing interest across medical specialties but doing so for brain SPECT analysis is dependent on normative datasets that are challenging and expensive to produce. Instead of controls, we used clinical scans to create an alternative, the population template. We investigated its utility for perfusion measurement in three ways. First, direct analysis of the template against a normative dataset demonstrated it was noninferior both at the region and voxel level. Second, using a cohort of cognitively impaired individuals, z-score metrics derived from the template were also noninferior to those generated from the normative dataset. Finally, individual visual reads of the same cohort revealed that, following quantification using the template, the perfusion patterns observed were largely consistent with their original clinical read and established literature. Despite this study’s limitations and recommendations for future work, we conclude that the population template is a viable alternative to normative datasets for quantifying brain SPECT.
AAL: automatic anatomical labelling atlas
ACR: American College of Radiology
AD: Alzheimer’s disease
CCC: concordance correlation coefficient
CI: confidence interval
FTD: frontotemporal dementia
ICC(3,1): intraclass correlation coefficient (two way mixed, single measures, consistency)
LOA: limits of agreement
MI: mutual information
MNI: Montreal Neurological Institute
MSD: mean squared deviations
PET: positron emission tomography
ROI: regions of interest
SPECT: single photon emission computed tomography
TBI: traumatic brain injury
Tc99m-HMPAO: technetium-99m hexamethylpropyleneamine oxime
TDI: total deviation indices
The supplementary materials for this article are available at:
We would like to thank CereHealth Corp. for their donation of patient data and support of this study, and individuals Shane Quint, Laurie Haynie, Michaela Olson, Logan Langholz, and Christine Salva for their contributions to this work.
LMQ contributed to the conception and design of the study. CAR also contributed to its design. With some assistance from acknowledged individuals, LMQ processed all clinical and imaging data for the template and the cognitively impaired cohort. LMQ generated the template and performed all testing and statistical analysis. CAR performed all visual reads on the cognitively impaired cohort. LMQ wrote the first draft of the manuscript. CAR wrote sections of the manuscript. All authors contributed to manuscript revision, read, and approved the submitted version.
Lindsay Quandt is an employee of CereHealth Corporation, the parent company of CereScan and CereMetrix Corporations. Cyrus Raji is an independent contractor for CereHealth Corporation.
This study was approved by the IntegReview Institutional Review Board, Certificate CHDB112019.
The informed consent to participate in the study was obtained from all participants.
Not applicable.
The datasets generated and analyzed for this manuscript are not publicly available because they are proprietary resources of CereHealth Corporation. Requests for access should be directed to Lindsay M. Quandt (LQuandt@ceremetrix.io).
Not applicable.
© The Author(s) 2020.
Copyright: © The Author(s) 2020. This is an Open Access article licensed under a Creative Commons Attribution 4.0 International License (https://creativecommons.org/licenses/by/4.0/), which permits unrestricted use, sharing, adaptation, distribution and reproduction in any medium or format, for any purpose, even commercially, as long as you give appropriate credit to the original author(s) and the source, provide a link to the Creative Commons license, and indicate if changes were made.

View: 7550
Download: 54
Times Cited: 0
Nicole L. Bjorklund ... Lampros Kourtis
Bessi Qorri ... Joseph Geraci
Siao Ye ... Reza Hosseini Ghomi
Honghuang Lin ... Rhoda Au
Sheina Emrani ... David J. Libon
Margaret Ellenora Wiggins ... Catherine C. Price
Larry Zhang ... Reza Hosseini Ghomi
Robert Joseph Thomas ... Rhoda Au
Taylor Maynard ... Sandy Neargarder
