
Abstract
Aim:
Amnestic mild cognitive impairment (aMCI) is a transitional stage toward Alzheimer’s disease (AD). For late-onset AD (95% of cases), aging is the main risk factor. Systematizing the transcriptome of hippocampal neurons under the native conditions of this disease is essential, as this information is scarce and the hippocampus is a highly vulnerable cerebral region.
Methods:
Public microarray data corresponding to homogenates of human hippocampus of Healthy-Younger, Healthy-Elder, and Elder-with-MCI individuals were re-analyzed herein. Through an optimized computational pipeline, those genes having splice forms and that belong to the neuronal type were identified. The differential genes arising from each group were then characterized by contrasting ontologies (functions, cellular components, and pathways). Additionally, the data were re-arranged factorially to determine the first- and second-order sex interactions.
Results:
Around 76% of the relevant changes actually occurred during the healthy-aging process, being further balanced or not during MCI. “Cognition”, “behavior”, “glutamatergic synaptic transmission”, “lipid rafts”, and “catecholamines” decreased across the three groups analyzed, whereas “associative/visual learning”, “gliogenesis”, “neuro-inflammation”, “corticosteroids”, “p75NTR”, “ER-stress” and “autophagy” peaked in Elders. On the contrary, “Learning/memory”, “GAP junctions”, “GABAergic transmission”, and “GNDF” showed a minimum in Elders. The “transcriptional regulators” (MeCP2, NPAS4, DREAM), “BNDF/NGFR”, “Ca2+ transport”, “CRHR1” and “CXCL12” were minimal in MCI. From Elder to MCI, “MAPKs”, “MEF2C”, “RGS7”, “CCKBR1”, “ErbB4”, “ERK5”, and “Ca2+-Na+-K+ channels” (RYR2, SCNA1/A8, KCNQ2/Q3, KCNN3, KCNIP2) appeared downregulated. “Long-term synaptic depression” (LTD) increased sharply in the MCI. Most of the findings detected were contrasted against 250 reports.
Conclusions:
The multiple alterations in the basic mechanisms—mainly in the CA3 dendrites of mossy fibers could be compatible with neuronal hyper-excitability, diminished synaptic transmission, and changes in the theta/gamma/SWR rhythms. Many functionalities appeared conditioned by sex-interactions. Particularly, women showed “pure” sex-effects and interactions with “cross-over” effects. Due to its consequences on the higher-order functions, all these predictions should be confirmed experimentally.
Keywords
Aging, amnestic mild cognitive impairment (aMCI), neurogenesis, synaptic transmission, synaptic plasticity, sex interactions, splice formsIntroduction
The aim of the present investigation was to systematize the main trends underlying the transcriptional repertory of neuronal cells coming from human hippocampus. However, the focus of interest was on the temporal window that could include the early transitional events toward the development of late-onset Alzheimer’s disease (AD). Mild cognitive impairment (MCI) is an intermediate stage in this sequence. It is characterized by subtle changes in one or several cognitive domains, but the activities of daily life are not compromised. The cognitive changes in the MCI are more intense than expected for normal aging [1], but they still do not fulfill the criteria for the diagnosis of dementia by AD [2].
MCI is a heterogenous condition because not all the patients will progress to AD. A fraction does not have memory compromise, but other cognitive domains are affected. These non-amnestic MCI cases could eventually progress to some forms of non-AD dementia. Another fraction of MCI patients can revert to a healthy condition or remain stable in its MCI stage [3]. However, in the cases of amnestic MCI (aMCI)—whether single or multiple cognitive domains are affected—a variable percentage of these patients may progress to AD. The ratio of conversion to AD ranged between 60–80% along a period of 6 years [4, 5]. For this reason, amnestic MCI is considered as the prodromic stage of the late-onset AD [6, 7], and for this reason, the present investigation will be focused on aMCI exclusively.
The hippocampus is particularly vulnerable to the effects of MCI [8]. In fact, the hippocampus plays a crucial role in forming short-term declarative memories by integrating sensory information [9], generating allocentric spatial navigation memories [10], and associating these memories with contextual features [11]. In conjunction with the prefrontal cortex and amygdala, the hippocampus may contribute to the generation of memory engrams [12]. This encompasses the phases of encoding short-term memories (including pattern separation), consolidation, and storage as long-term memories, as well as the steps of re-consolidation and recall (including pattern completion) [13, 14]. Additionally, the hippocampus is involved in the general response to stress [15] and supports neurogenesis during adulthood [16].
However, the “hippocampus formation” is not a homogenous anatomical structure. It includes mainly three bodies: the cornu ammonis (CA), the dentate gyrus (DG), and the subiculum. In turn, several subfields are recognized within the CA (CA1, CA2, CA3). The so-called CA4 region is actually a part of DG. Each body also has distinct histological sub-layers, that under normal conditions execute a well-coordinated work division [17]. Importantly, the sub-granular-zone (SGZ) located in the DG is involved in the process of neurogenesis. All these functions, to different degrees and with distinct kinetics, are affected in AD [18, 19].
Aging is one of the main risk-factors for developing the late-onset AD variant, which accounts for more than 95% of the cases of AD [20]. Thus, in order to study the MCI, the experimental designs currently include a group of “healthy” age-matched individuals as control. But, because “aging” is itself a divergent condition, samples from “healthy” middle-aged adults should also be analyzed as a second control. Once AD clinically manifests, it progressively accumulates a growing number of anomalies, advancing through the stages of mild, moderate, and severe dementia. Here, we will not analyze these advanced AD stages. In fact, although many disease epiphenomena are fully manifested, their primary causes remain hidden, distorting any feasible interpretation.
To address the stated problem, some powerful methods such as RNA-sequencing (RNA-seq), single-cell RNA-seq (scRNA-seq), single-nucleus RNA-seq (snRNA-seq), and/or spatially-resolved transcriptomics have arisen in the last years. However, all these methods—in spite of their sophisticated nature—are still affected by several types of limitations [21–23]. More than a hundred publications were identified in PubMed concerning the analysis of neurons in the human hippocampus by RNA-seq, but only three of them dealt with these determinations using “scRNA-seq” or “snRNA” under conditions of “aging” and/or “Alzheimer’s disease” [24–26]. Furthermore, only one publication used “spatial transcriptomics” under the last referred conditions in humans [27].
In order to mitigate the lack of MCI studies in human hippocampus under the “native” conditions of this pathology, we utilized a publicly available dataset produced by Berchtold et al. [28, 29]. These researchers analyzed numerous human hippocampus necropsies using microarrays. Leveraging the same datasets, we then developed a procedure for the computational dissection of the hippocampal homogenate, enabling the in silico isolation of the specific transcriptomes of both endothelial [30] and astrocytic cells [31]. In order to advance in the understanding of the phenomena leading to MCI in the light of the neurovascular unit concept [32], the present study complements our previous research, by examining the transcriptome of hippocampal pyramidal neurons under three relevant conditions (Healthy-Younger Adult, Healthy-Elder, and Eldered with MCI).
In brief, the present article has the following organization: Data systematization and underlying trends; Higher-order functionalities; Calcium, potassium, and sodium channels; Action potential and mitochondrial depolarization; Synaptic activity and glutamate activity; Lipid rafts and mechanical stimulus; Anterograde and retrograde axonal transport; Neurotrophins, stress responses, and basic neuronal processes; Sex interactions effects; Concluding remarks, and a section devoted to Limitations of the study. Using the method developed herein, the necropsied tissue results in a good proxy to achieve multiple relevant inferences about the functioning of hippocampal neurons in amnestic MCI.
Materials and methods
Data
Affymetrix HG133 plus 2 microarray data of human hippocampus was gathered by Berchtold et al. [28, 29]. These data were retrieved from the Gene Expression Omnibus database (accession code: GSE11882). Medical, psychometric, and biochemical metadata were reported in the Supplementary Materials of the original articles. Here, we re-stratified the data from n = 55 hippocampal samples by considering 64 years old as cut-off value. Three groups were defined: healthy middle-aged adults (Younger Group), healthy elder individuals (Elder Group), and elderly patients with MCI (MCI Group). Importantly, these datasets comprised balanced groups of men and women, matched by age. Hence, Group 1 comprised 9 men (age median = 28 years, age range = 20–45 years) and 9 women (age median = 44 years, age range = 26–64 years), Group 2 included 15 men (age median = 83 years, age range = 69–97 years) and 14 women (age median = 82.5 years, age range = 70–99 years), while Group 3 was made up by 4 men (age median = 86.5 years, age range = 75–89 years) and 4 women (age median = 88.5 years, age range = 88–90 years). The re-stratification of the data was undertaken to enhance the representativity of the sampled groups. While the prevalence of MCI ranges between 10–20% in adults with age over 65 years old (https://www.psychdb.com/cl/3-mild-neurocog-disorder), it can be estimated that using a cut-off value of 64 years old could account for 89.7% of possible cases of MCI in an elderly population [1]. One advantage of the microarray data from Berchtold et al. [29], is that the cases of MCI they sampled exclusively included individuals with amnestic MCI (both single and multidomain).
Computational methods
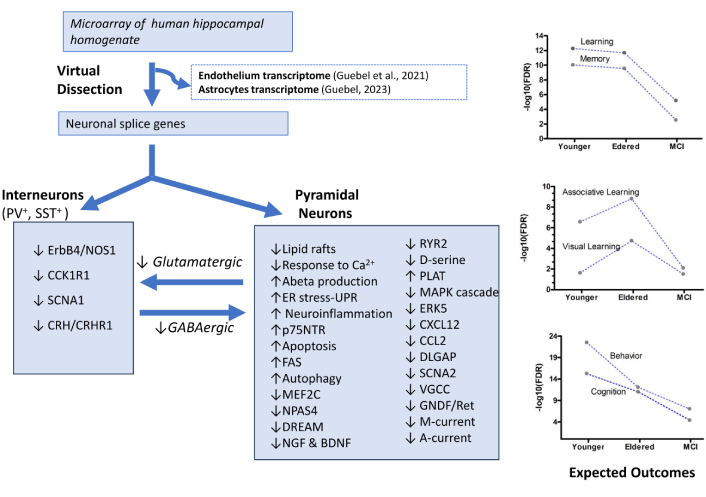
To determine the profiles of genes operating in the neurons of the human hippocampus, a computer dissection of the data was applied. By this approach, the data corresponding to the hippocampal homogenates was filtered away, while the cell-specific information was recovered (see Figure 1).
Computational operations performed to dissect the global microarray data corresponding to samples from the hippocampal homogenates (GSE11882, GEO database), showing the number of differential genes isolated in each step, followed by the reconstruction of significant functional profiles that could be operating in the neuronal compartment. The algorithms and software packages used for the computational operations are indicated in red. Here, the analyses of neuronal cells complement previous studies performed with a similar methodology, which assessed other critical components of the neurovascular unit, such as endothelial cells [30] and astrocytes [31] of human hippocampus. Note the gain in biological interpretability achieved owing to the substantial reduction in the number of differentially expressed genes identified along the successive levels of the pipeline
As is depicted in Figure 1, the optimized post-processing method Q-GDEMAR (Quantile-Gaussian Deconvolution of Microarrays) [33, 34] was the first step for the determination of the total differential genes in each group [30, 31, 35, 36], and for the identification of the sex-conditioned differential effects on these genes [31, 35]. Thereafter, a double filtering procedure was additionally applied. The first one used DAVID 6.8 software [37] to perform an ontology analysis, thus identifying which of the total differentially expressed genes admit alternative splice forms. The subsets of differential genes associated to splice forms were in turn subjected to a new screening to determine which of them actually occur in neuronal cells. This was achieved by means of the Ingenuity system database (IPA™, Qiagen, USA). IPA provides some relevant networks based on the identified molecules. A problem observed with IPA in the present study was that the APP gene, corresponding to amyloid precursor protein, occupied a central position in the inferred network for the Younger Group. Although this information was supported by studies with transgenic animal models, it was not suitable for the context herein analyzed, as the focus is on the late-onset form of AD, where such mutations do not occur [38]. For this reason, the list of molecules generated by the Ingenuity system, excluding APP, was re-analyzed using the NetWalker software [39]. This program can discern among distinct levels of action (genetic, protein-protein interactions, etc.), and, like Ingenuity, it can insert the most probable neighbor nodes to improve the connectivity of the detected networks. In fact, normal, non-mutated APP gene was further identified as a partner molecule in several inferred mechanisms (regulation of action potentials, lipid rafts, and responses to mechanical stimulus, and cellular stress) within the Elder Group. Finally, the resulting list of molecules was subject to a new ontology analysis at the level of biological processes, cellular components, and pathway analysis using several software packages as DAVID [37], KEGG database [40, 41], and the web server ToppGene Suite at the Cincinnati Children’s Hospital Medical Center (https://toppgene.cchmc.org/). Overall, the sequence of operations performed yielded a great amount of information (see Tables S1–S4). This information, analyzed through a data-driven approach as outlined in the Results section, was distilled in relevant, systematized biological information.
Regarding the efficiency of the pipeline, the data in Figure 1 indicate that in the Younger Group, the ratio between the neuronal genes recovered and the total spliced genes identified was 7.16%. However, this ratio diminished to 2.11% in the Elder Group and reached 4.66% in the MCI Group. By determining the confidence interval for the differences in these proportions (see section of Statistical analyses), it was verified that the recovery ratio of neuronal genes based on the spliced forms was significantly lower in the Eldered Group compared with the Younger Group (p < 0.05), despite the higher number of spliced coding-genes identified in the Elder Group. Therefore, the hypothesis sustaining that the recovery ratio was constant across the three conditions analyzed has to be rejected. This suggested that in the Elder Group the population of neurons might be diminished due to the increment of other cellular populations, very probably astrocytes (see Higher-order functionalities and Concluding remarks).
Gene identification checking
To assess the bioinformatic pipeline, it was tested whether the differential genes recovered as output of the computational procedure belonged to neurons. The primary assignation of genes that belong to hippocampal neurons was made by filters included in IPA™. Further verifications were obtained by consulting the RNA-seq generated in the Barres & Wu’s laboratories, accessible from the “RNAseq Browser” (http://jiaqianwulab.org/braincell/RNASeq.html), as well as by looking for in the literature of the field.
Statistical analyses
The Q-GDEMAR algorithm includes an ad-hoc procedure to compute the false discovery rate (FDR) associated to the differentially expressed genes [34]. In the ontology analyses, the FDR values were computed by the method of Benjamini and Hochberg [42].
For the determination of Sex interactions effects, two factorials were established (see Figure 1). Hence, the first-order interactions between sex and the two biological stages assessed were determined within each factorial, as described previously [31, 35, 36]. Furthermore, the values for the second-order interactions were calculated based on the variation of the first-order interaction coefficients across the factorials [31]. Various visualization methods were assayed (Multidimensional Scaling, different types of kernel-PCA). However, the most effective representation for distinguishing the different modes of second-order interactions detected was achieved using equation 1. This equation is based on the concept of Super-Ratio, which leverages the linear relationship between the Super-Ratio values and values of the first-order interaction coefficients [35].
Here, the Super-Ratio concept has been adapted to address the two factorials of dimensions 2 × 2, where the variables sex (female/male) and biological condition (Younger/Elder or Elder/MCI) were crossed. Defining W = –log10 (FDR)—with a scale of significance (0 ≤ W ≤ ∞)—given that FDR is the rate of false discovery (0 ≤ FDR ≤ 1), the sub-index k = (1, 2) designates the corresponding (Super) Ratios from factorials 1 and 2.
For Ratio 1 (when k = 1), the quotient quantifies how many times a feature or gene is enriched in females compared to males when the stages in the Younger-Eldered transition are considered. Similarly, for Ratio 2 (k = 2), the quotient quantifies how many times a feature or gene is enriched in females with respect to males when considering the stages in the Elderly-MCI transition. If the two estimations of R1 and R2 are not significantly different from a value of one, this means that the gene or feature is not influenced by sex. Conversely, if R1 and R2 are consistently higher (or lower) than one, this means that the gene or feature is strongly associated to females (or males) respectively. However, as further will be show in Sex interactions effects, the real data reveal several combinations beyond the simple YES-sex conditioned or NOT-sex-conditioned, generating a spectrum of possible sex interactions.
In all the cases analyzed, i.e., for the determination of the differentially expressed genes, of ontology functionalities, and of the interactions, a value of FDR ≤ 0.05 was considered significant. Here, FDR has to be taken as synonymous with padjusted, that in the presence of multiple comparisons is used to correct the classical p-value [34, 42].
Other statistical analyses, such as cluster analysis, Spearman rank-order correlations, and their degree of significance, were determined by the Matlab program (Mathworks, USA). The confidence interval for the difference between two proportions (p1, p2), used to analyze the efficiency of the computational pipeline (see Computational methods), was computed as a two-tailed test by the normal approximation of two binomial distributions, as indicated by the following equation:
In this context, the parameter Z represents the critical value of the normal distribution that corresponds to a probability of (1−α), where α is the accepted level of Type I error (false rejection of the null hypothesis), while n1 and n2 denote the sample sizes of the groups being compared.
Results
Data systematization and underlying trends
Because the analyses of neuronal transcriptome yielded a huge amount of significant, but not easily interpretable information, it was required to proceed to its systematization. Hence, after determining the differential genes associated to each analyzed condition (see Figure 1), an analysis based on the “biological-functions” ontologies was practiced.
As shown in Figure 2, five types of patterns can be discerned in relation to the “biological functions” ontologies. However, it could be expected some relationships between these patterns and those resulting from the “cellular components” ontologies (see Figure S1) or “pathway-based” ontologies (see Figure S2). In fact, close parallelisms were detected between some of the profiles identified (e.g., profiles in Figure 2C, Figures S1C and S2D; Figure 2A and Figure S2A; Figure 2B and Figure S2B). Given that parallel changes in distinct functionalities may indicate shared regulation mechanisms, these similarities will be further be exploited in the analyses performed. Additionally, the analyses of the “cellular components” and “pathways”, both included some unique ontology classes (see Figures S1D and S2E).
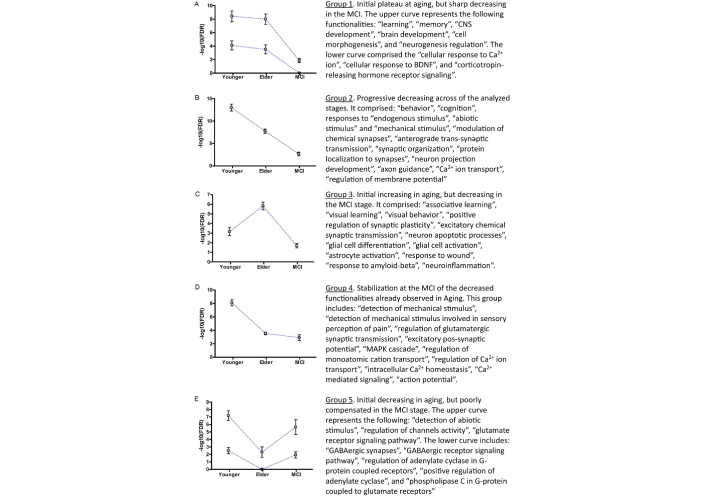
Main profiles detected across the three stages analyzed (Younger, Elder, MCI) as derived from the analysis of “biological process”-based ontologies. The significant functionalities were grouped by hierarchical clustering, using (1−RSpearman) as metric of correlation distance, and “average” as criterion of linkage function. The dashed lines represent the trend followed by the average significance of the functionalities comprised in each cluster at given stage while the error bars cover their 95% confidence intervals. The significances in the y-axis are quantified as –log10 (FDR), where FDR is the rate of false discovery. (For details about the genes involved in each functionality see Table S1)
Higher-order functionalities
Importantly, the systematization of the data in Figure 2 reveals that higher-order functionalities did not follow the same pattern across the three analyzed stages. Thus, the patterns for “learning” and “memory” (Figure 2A) differ from those for “behavior” and “cognition” pattern (Figure 2B), and both are distinct from the patterns for “associative learning”, “visual learning”, and “visual behavior” (Figure 2C).
This disparity may be due to the fact that these higher-order functions correspond to partially nested cognitive domains influenced by multiple interdependencies. These include hippocampal connections to and from other brain regions [43]; interactions among the hippocampal subfields [44]; and dependencies with respect to other molecules within the same profile, or molecules from different profiles, as a single molecule often participates in multiple pathways.
Instead, the parallelism between the patterns in Figure 2C, Figures S1C and S2D might represent some relationship between the represented functionalities. For instance, the first case includes: “positive regulation of glucocorticoid signaling”, “regulation of synaptic plasticity”, “glutamate secretion”, “excitatory chemical synapses”, “gliogenesis”, “glial differentiation”, “astrocyte differentiation”, “glial activation”, and “astrocyte activation”. The second case involves “synaptic vesicles”, “exocytic vesicles”, and “secretory vesicles”. The third case encompasses “brain-derived neurotrophic factor (BDNF) signaling”, “NOS1 activity”, and “synaptic adhesion-like molecules”.
At first, the relationship between “glutamate secretion” and “excitatory chemical synapses” (Figure 2C) appears evident, especially when considering the “dynamic of the vesicles” (Figure S1C). However, “excitatory chemical synapses” are not restricted to “glutamatergic synapses”, as the “cellular response to catecholamines” appeared maximized in the Younger Group (FDRYounger = 9.5 × 10⁻⁷ vs. FDRElder/MCI = 1). Epinephrine and dopamine exert a positive effect on the hippocampal-dependent memories [45, 46]. Additionally, BDNF is required for both “visual learning” and “associative learning” [47]. However, the regulation of BDNF isoforms is complex and varies depending on the hippocampal subfield and the neuronal compartment considered [48].
The parallelism among the enzyme NOS1, visual learning, and associative learning is supported by the positive effect of nitric oxide (NO) on learning acquisition [49]. Thus, NO enhances both N-methyl-D-aspartate receptors (NMDAR)-independent long-term synaptic potentiation (LTP) [50] and the NMDAR-dependent LTP [51]. Additionally, NO production is positively associated with glutamate secretion during the acquisition of active-avoidance behavior, which decreases after extinction training [52]. Importantly, NOS1 is abundant in GABAergic interneurons, where ErbB4 receptor activation leads to NO production and γ-aminobutyrate secretion. This mechanism effectively controls the excitability of the pyramidal neurons, improving working memory and social interactions [53].
The parallelism among patterns can also be explained by focusing on the molecules identified in each case. All categories related to “vesicles” share some common molecules [GRIN2A, GRIN2B, CALM1, amyloid precursor protein (APP), NTF3, presenilin1 (PSEN1), BDNF]. However, in the case of “secretory vesicles”, additional molecules like LRP1, ARC, and PLAT (tissue plasminogen activator) are included. Notably, the endocytic receptor LRP1, which is related with apolipoprotein E and Aβ peptide among other forty ligands, is induced by HIF1A. This molecule is listed among the genes corresponding to the higher-order classes enumerated in Figure 2C. The transcription factor HIF1A participates in the “cellular response to hypoxia”, which was significant in the Younger and the Elder groups, but not in the MCI (FDRYounger = 1.1 × 10⁻⁷ vs. FDRElder = 6.4 × 10⁻⁶ vs. FDRMCI = 1).
HIF1A exerts a clear neuroprotective effect in situations of pathological hypoxia (subarachnoid hemorrhage, chronic asthma, sleep-associated apnea), which are further associated to deficits in learning and memory. However, even under normal conditions, HIF1A is required to drive adult neurogenesis, thereby improving discrimination patterns in associative and visual learning [54]. VEGFA, a target gene of HIF1A, is also crucial for supporting microvasculature in the SGZ niche of DG, maintaining and regenerating injured axons, and ensuring neuron survival [55]. Additionally, the higher-order functions analyzed here include the transcription factor CREB, and the neurotrophic factor BDNF, which is induced by activated CREB. Importantly, BDNF enhances the formation of the vesicles during synaptogenesis and promotes the dendritic arborization [56].
The parallel changes shown by “associative learning” and “visual learning” along with several functionalities related with “gliogenesis” in Figure 2C, align with the concept of tripartite synapses [57]. The interaction between astrocyte processes and pre- and post-synaptic neurons facilitates a dynamic, bidirectional exchange of signals. As a result, astrocytes can modulate a wide range of critical neuronal activities, from nutrition to synaptic plasticity. However, depending on the degree of neuronal activity, astrocytes can either promote neuron survival [58] or contribute to neurotoxicity [59].
A pertinent question is why astrocytes appeared associated with cognitive functions only in Figure 2C. Although all the cognitive functions in Figures 2A–2C are linked to astrocytes according to the tripartite synaptic concept, this relationship is most pronounced in Figure 2C due to the “astrocytosis” in the Elder Group [31]. Several pieces of evidence support this occurrence, including the mathematical “anomalies” detected (see Computational methods and Statistical analyses), and the peaks in “gliogenesis” (FDRYounger = 2.2 × 10⁻⁶ vs. FDRElder = 7 × 10⁻¹⁰ vs. FDRMCI = 4.3 × 10⁻²), “astrocyte differentiation” (FDRYounger = 1.4 × 10⁻⁴ vs. FDRElder = 8.710–9 vs. FDRMCI = 1), and “astrocytes activation” (FDRYounger = 2.9 × 10⁻³ vs. FDRElder = 1.4 × 10⁻⁵ vs. FDRMCI = 3.4 × 10⁻²) herein observed in the Elder Group.
Finally, regarding the parallelism between “cellular response to glucocorticoids”, “associative learning” and “visual learning” in Figure 2C, note that the response to glucocorticoids did effectively peak in the Elder Group (FDRYounger/MCI = 2.4 × 10⁻² vs. FDREldered = 1.9 × 10⁻⁵), while the “inflammatory response” it did likewise (FDRYounger/MCI = 2.5 × 10⁻³ vs. FDREldered = 4.1 × 10⁻⁶). Importantly, several hippocampal-dependent cognitive functions (spatial working memory, fear memory, novel object recognition, emotional context memories) showed an inverted U profile with respect to corticoid levels [60]. Moreover, glucocorticoids can negatively affect the capacity of learning generalization even when memory acquisition is not affected (rigid memories) [61].
Calcium, potassium, and sodium channels
The MCI Group showed sharp diminutions in multiple variables such as “cellular response to Ca2+ ion”, “cellular response to nerve growth factor (NGF)”, “cellular response to BDNF” (see Figure 2A), together with great decrease in the “Ca2+ ion transport” and in the “glutamatergic synaptic transmission” (see Figure 2B). However, while the group of cellular responses were conserved between the Younger- and Elder-stages, the second group of variables already diminished markedly from the Younger Group. Hence, to achieve a better understanding about the possible mechanisms that drove these changes, a more detailed analyses of the several dimensions present in these data were performed (see Table 1).
Comparison of the significances of some mechanisms involved in transport of calcium, sodium, and potassium ions, and their consequences on the action potential along the three stages analyzed (Younger, Elder, and MCI Groups)
| Functionality | Younger | Elder | MCI |
|---|---|---|---|
| Cellular response to Ca2+ ion | 4.41 | 4.23 | 0 |
| Ca2+ ion transport | 15.06 | 4.19 | 2.72 |
| Voltage-gated Ca2+ channels (VGCCs) | 3.12 | 0 | 1.97 |
| Ca2+ channel complex | 3.58 | 1.46 | 1.71 |
| Ca2+ & Calmodulin-dependent protein kinase complex | 0 | 0 | 1.69 |
| Na+ transmembrane transport | 3.21 | 0 | 0 |
| Voltage-gated Na+ channels (VGSCs) | 1.97 | 0 | 0 |
| K+ transmembrane transport | 2.55 | 2.50 | 0 |
| K+: H+ exchanger ATPase | 1.58 | 1.80 | 0 |
| Ranvier nodes | 3.20 | 0 | 0 |
| Action potential | 9.43 | 4.12 | 3.48 |
| Excitatory post-synaptic potential | 4.41 | 3.00 | 1.96 |
| Membrane depolarization | 3.65 | 0 | 1.33 |
| Membrane hyperpolarization | 1.67 | 0 | 0 |
By comparing Figures 2A–2B and Table 1 it is concluded that MCI Group not only had downregulated the cellular responses to Ca2+ ion, to NGF, to BDNF, the transport of Ca2+ ions, and the transmission in glutamatergic synapses, but also lacks of the upregulated transport of K+ and Na+ ions that was observed in the Younger Group. In addition, the alterations in the transport of Ca2+ and Na+ ions had already begun in the Elder Group.
The homeostasis of Ca2+ ions in the Younger Group was achieved through the expression of CACNB3 and CACNA2D1—both regulatory subunits of the voltage-gated Ca2+ channels (VGCCs)—in cooperation with the expression of the intracellular ryanodine receptor RYR2 (FDR = 2.6 × 10⁻⁴). In the Elder Group, no VGCC nor ryanodine receptor appeared as significant, but other molecules associated to calcium ions did (CALM1, PRKACA; FDRElder = 3.5 × 10⁻²). In the MCI Group, what seems to be a “compensatory response” occurred since although RYR2 was not balanced there, the VGCCs appeared dysregulated again, but now using CACNA1B (a pore-forming of the N-type VGCCs) and CACNB4 (an auxiliary sub-unit of VGCCs) (FDR = 1.1 × 10⁻²). Note that VGCCs are built-up by four classes of subunits: a pore-forming units of α1 type (10 subtypes exist) + α2-δ subunits (exists 4 subtypes) + β subunits (4 subtypes) + γ subunits (8 subtypes) [62].
Concerning the Na+ ion transport, in the Younger Group it took place through SCN1A/Nav1.1, SCN2A/Nav1.2—two voltage-dependent Na+ channels (VGSCs)—both complemented by the β-subunit SCN2B. The Younger Group also showed upregulation of ASIC1, an acid-sensing (proton-gated) Na+ channel. Note that SCN1A and SCN2A both correspond to the pore-forming alpha unit of the VGSCs, but require the β-subunit to be targeted toward the plasma membrane and to modulate the activity of these channels.
Concerning the K+ transport, the voltage-gated potassium channel KCNQ3 was dysregulated in the Younger Group, whereas in the Elder Group, it was given by the voltage-independent potassium channel KCNN3/SK3, the voltage-gated potassium channel KCNQ2, together with the regulatory sub-unit KCNIP2/KChIP2. Regarding the upregulation of KCNN3 in the Elder Group, it is worth remarking that this channel is activated by the intracellular Ca2+ ion. The CA1 region of the Schaffer Pathway is enriched in the KCNN3 channel. There, in response to the activation of NMDAR, a K+ efflux is produced through the KCNN3 channels. This K+ efflux determines the slow-component of the so-called afterhyperpolarization (AHP) stage of the action potential [63]. However, it was reported that overexpression of KCNN3 led to the disorganization of CA1 and CA3 subfields, diminished LTP, and enhanced the cognitive loss [64].
By taking the Younger Group as a reference, it is concluded that the changes observed in the Elder and MCI Groups can be mainly associated to noxious scenarios. Hence, the profile of Ca2+ transporters in the Younger Group provides multiple benefits: (i) CACNB3 as β-subunit of VGCCs targets the pore-unit α1 toward the plasma membrane and increases the Ca2+ conductivity of these channels. Both mechanisms operate in response to BDNF during the remodeling of neurites, and/or after NMDAR activation during LTP induction; (ii) CACNA2D1 as α2-δ subunit regulates the Ca2+ current density and the kinetics of activation/inactivation of the VGCCs [65]; (iii) RYR2 receptors localize in the endoplasmic reticulum (ER) membranes. In pre-synapses, RYR2 is activated after the Ca2+ influx due to the opening of VGCCs, whereas in post-synapses RYR2 is activated after the activation of NMDAR. While in the pre-synapses the Ca2+ release mediated by RYR2 activation allows the exocytosis of neurotransmitters from the synaptic vesicles [66], in the post-synapses the Ca2+ release mediated by RYR2 activation is required for the maintenance of the excitatory synapses, avoiding the loss of dendrites with its consequent exacerbation of neuron excitability response [67]. In fact, RYR2 is dynamically regulated during the processes of activity-dependent spine remodeling that takes place during spatial memory acquisition [68]. It has been reported that dendritic spines are rich in RYR3 [69]. RYR3 was not detected here; instead RYR2 was identified. Anyway, the absence here of dysregulated RYR2 or RYR3 in the Elder and in the MCI could affect negatively the occurrence of LTP in these groups [68].
Concerning the results for Na+ transport, and based on evidence from Mann’s lab [70], the absence of dysregulated Na+ transport in the Elder and MCI groups could potentially affect the integration of input signals by neuronal dendrites. This, in turn, might constrain the effective control of gamma- and theta-oscillations generated in the hippocampus. Adequate control of these rhythms is essential to prevent seizures, hyperactivity behaviors, and/or altered social interactions. This expectation is further reinforced by the fact that SCN1A localizes on (inhibitory) GABAergic interneurons [both, sub-set of GABAergic interneurons containing the parvalbumin protein (PV+) and sub-set of GABAergic interneurons containing neuropeptide somatostatin (SST+) types], while SCN2A is localized on (excitatory) glutamatergic pyramidal neurons, thus disrupting their regulatory loop.
Concerning the K+ transport, the dysregulation of KCNQ3 (Younger Group) and KCNQ2 (Elder Group), both allow the so-called “M-currents” (efflux of K+ ions) by inducing neuronal hyperpolarization that inhibits hyperexcitation due to uncontrolled firing rate [71]. The K+ conductance in the KCNQ2 channel is twice as high compared to that of KCNQ3 channel [72]. Therefore, higher neuronal hypo-reactivity in the Elder Group compared to the Younger Group is expected. However, effective K+ conductivity through KCNQ1/Q2/Q3 channels could be diminished due to their inhibition under inflammatory conditions [73]. Given that inflammation was maximal in the Elder Group (FDRElder = 4.1 × 10⁻⁶ vs. FDRYounger/MCI = 2.2 × 10⁻³), a stage of neuronal hyper-excitability in the Elder Group could finally be produced.
The dysregulation of KCNN3 in the Elder Group might be unfavorable because its overexpression leads to deficits in LTP, spatial learning, and object recognition ability [64]. Additionally, KCCN3 has a differential distribution between ventral- and dorsal-hippocampus, which explains the failures in the former to elicit LTP and post-synaptic complex-spike bursting under normal conditions [74].
Furthermore, the regulatory protein KCNIP2/KChIP2 in the Elder Group, but not in the MCI Group, can be associated to a lesser control of neuronal excitability in the MCI Group. KCNIP2 is needed to regulate the Kv4 potassium channels (KCND1/D2/D3), which are responsible for the post-synaptic IA currents that stabilize neuronal activity [75]. The hyper-excitability of the MCI Group could also be intensified due to the down-regulation of KCNQ2/Q3 channels in this group.
Action potential and mitochondrial depolarization
The alterations in the ion channels detected herein might have consequences on the observed decreasing trend in the action potential (see Table 2). However, the action potential is not conditioned uniquely by the ion channels. The regulation of the membrane potential in the Younger Group depends on 27 genes, 24 of which do not code for ion channels (GABRB2, CACNB3, PSEN1, MAPT, ASIC1, CAMK2D, BAX, GRIA1, GRIA2, GRID1, GRIN2A, GRIN2B, GRM5, RGS7, MEF2C, CHRNA4, BDNF, RYR2, JUN, SCN1A, SCN2A, KCNQ3, GNA11, FGF14, NOS1, CXADR, NOS1AP; FDR = 8.6 × 10⁻¹⁸). In the Elder Group this regulation depends on 14 genes, of which 8 genes do not code for ion channels (PSEN1, CALM1, MAPT, BAX, KCNQ2, GRIA1, GRIA3, NR3C2, BCL2, GRIN2A, GRIN2B, APP, KCNIP2, BDNF; FDR = 2.0 × 10⁻⁹), whereas in the MCI Group it depends on 10 genes, 4 of which do not code for ion channels (GABRB2, CACNA1B, GRIA1, GRIA2, GNA11, CACNB4, GRIN2A, GRIN2B, GRM1, GRM5; FDR = 6.2 × 10⁻⁷). As is shown in Table 1, the enrichment in sodium ion channels (SCN1A, SCN2A) and potassium ion channel (KCNQ3) in the Younger Group is associated to the occurrence of Ranvier’s Nodes (FDRYounger = 6.3 × 10⁻⁴). So, its downregulation in the Elder and MCI groups could lead to a lesser rate of transmission of the action potential in the myelinated axons of these groups [76].
Comparison of the significancea of several functionalities related with the synaptic activity across the three groups analyzed (Younger, Elder, and MCI)
| Functionality | Younger | Elder | MCI |
|---|---|---|---|
| Synaptic signaling | 23.66 | 13.48 | 10.66 |
| Synaptic plasticity regulation | 12.58 | 13.28 | 5.45 |
| Synaptic organization | 12.77 | 4.51 | 2.70 |
| Cellular response to serotonin | 3.06 | 2.30 | 0 |
| Cellular response to catecholamines | 6.02 | 0 | 0 |
| Cellular response to epinephrine | 3.36 | 0 | 0 |
| Cellular response to dopamine | 3.14 | 0 | 0 |
| Cellular response to glycine | 2.90 | 0 | 0 |
| GABAergic signaling | 2.51 | 0b | 1.57 |
| GAP junctions (electrical synapses) | 4.31 | 0 | 4.44 |
| Glutamatergic synaptic transmissionc | 11.35 | 7.24 | 3.19 |
| Glutamatergic synaptic transmissiond | 18.57 | 5.43 | 11.88 |
| Glutamate secretion | 2.35 | 3.19 | 1.59 |
| NMDAR activation & post-synaptic events | 8.30 | 6.60 | 4.00 |
| Regulation of NMDAR activation | 2.54 | 2.04 | 6.05 |
| Retrograde endocannabinoids signaling | 1.31 | 1.79 | 5.51 |
| CA1-Schaffer collateral synapses | 2.62 | 1.84 | 3.45 |
| Somato-dendritic compartment | 28.41 | 12.31 | 8.62 |
| Dendrites | 23.22 | 9.86 | 8.45 |
| G protein-coupled glutamate receptors | 1.88 | 0 | 2.36 |
| G protein-coupled receptors | 4.31 | 1.51 | 1.93 |
| BDNF signaling | 10.76 | 9.14 | 2.44 |
| CREB1 activation by NMDAR/RAS | 1.32 | 0 | 0 |
| CREB1 activation by PKA | 0 | 1.32 | 0 |
| CREB1 activation by CAMKIV | 0 | 1.32 | 0 |
| MAPK cascade | 6.95 | 3.23 | 2.57 |
| Trafficking AMPAR | 2.27 | 1.79 | 1.81 |
| Membrane lipid rafts | 8.47 | 3.34 | 0 |
| Response to mechanical stimulus | 9.00 | 5.81 | 1.45 |
| Long-term synaptic potentiation (LTP) | 6.22 | 5.83 | 6.32 |
| Long-term synaptic depression (LTD) | 3.16 | 4.24 | 11.43 |
| LTP: LTD ratio | 1.96 | 1.37 | 0.55 |
a The significance is quantified as –log10 (FDR), where FDR is the false discovery rate; b the Elder Group showed a negative regulation of GABAergic signaling (FDR = 4 × 10⁻²); c based on biological process ontology; d based on cellular component ontology. Note that a zero value denotes a non-significant functionality, as FDR = 1 (For details of the genes involved, see Tables S1–S3)
Interestingly, the Elder Group showed a significant mitochondrial depolarization, but this depolarization was still counterbalanced (FDR(+)depolarization = 9.1 × 10⁻³ vs. FDR(-)depolarization = 4.2 × 10⁻²). Mitochondrial polarization is required to support material and energetic fueling to neurons. In fact, mitochondrial depolarization was not significant in the Younger Group. The mitochondrial depolarization in the Elder Group can be understood within a broader context. In this group, by pathway analysis, it was revealed the maximization of several deleterious functionalities, such as p75NTR signaling (the binding of pro-BDNF to p75NTR leads to apoptosis), generation of reactive oxygen species (ROS), oxidative DNA damage, ER stress associated to IRE-1 and unfolded protein responses (UPR), p53 signaling, extrinsic and intrinsic apoptosis, programmed cell death (via RAGE and NADE), FAS signaling, BIM-Bcl2 and BIM-Bcl-xL complexes, apoptosis executioner phase, mitochondrial pore transition, autophagy and macro-autophagy (see Figure S2). Consistently, the kinase MAPK7/ERK5, that associated to survival of neurons [77] and positive memory effects [78], only appeared upregulated in the Younger Group.
Synaptic activity and glutamate activity
It is clear that neurons use a great diversity of molecular effectors, receptors, modulators, channels, which through a sophisticated system of coordination of activations and deactivations provide the basis to establish the resting potential of the membrane as well as the action potential [79]. Alternatively, by viewing this system as a gray box, the synaptic transmission due to distinct available neurotransmitters and some other operative variables derived from them can reflect indirectly the complex map of “unobservable” molecular interactions (see Table 2).
Interestingly, Table 2 shows that “glutamatergic synaptic neurotransmission” was affected by a progressive diminution from the Younger Group to the MCI group when it was assessed by “biological process” ontologies. However, the decrease was restricted only to the Elder Group when ontology was derived from the term “glutamatergic synapses”, based on the “cellular components” ontologies (see Table 2). This difference between ontologies can be understood in terms that glutamatergic synapses could lack some functionality in the macromolecular complexes required, even when the building-blocks of these complexes had been transcribed (https://geneontology.org/docs/ontology-documentation/). This point is relevant in relation to the localization of α-methyl-D-aspartate-3-hydroxy-5-methyl-4isoxazolepropionic acid receptors (AMPAR) and NMDAR in the lipid-rafts at the plasma membrane (see Lipid rafts and mechanical stimulus).
Moreover, the diminished glutamatergic transmission in the Elder Group can be in relation with some not-dysregulated critical molecules, such as DLGAP1 [80], GRID1 [81, 82], CCL2 [83], CCK [84]. These molecules appeared upregulated in the Younger Group, where glutamatergic synaptic transmission appeared maximized. Also, the occurrence of tissue plasminogen activator (PLAT) in the Elder Group is consistent with the described “perforated synapses” [85], thus leading to impairments in cognition and memory [86].
Although a simple relationship between glutamatergic transmission, LTP, and long-term synaptic depression (LTD) is not expected, Table 2 shows a notable decrement in the ratio LTP: LTD in the MCI Group. This decrement was conditioned by the enhancement of LTD in the MCI Group. This latter could be caused by several factors, such as the significant retrograde endocannabinoid signaling (FDR = 3.1 × 10⁻⁶), the increased metabotropic receptor signaling in the post-synapses (GRM1, GRM5) (FDR = 6.0 × 10⁻³), and the neurexin-neuroligin interactions (FDR = 6.1 × 10⁻⁶) [87]. The highly significant endocannabinoid signaling in the MCI Group can be produced not only due to the higher availability of metabotropic glutamate receptors mGluR1 and mGluR5, but could also denote a lesser inhibition in the synthesis of 2-arachidonoylglycerol (2-AG) by the complex DLGAP1-SHANK-HOMER1 in the post-synapses [80]. Note that DLGAP1 and HOMER1 both appeared positively dysregulated only in the Younger Group. Thus, the above commented endocannabinoid mechanism contributes to the enhanced LTD herein detected in the MCI Group (see Table 2).
Lipid rafts and mechanical stimulus
Interestingly, the progressive decrease observed in the glutamatergic transmission was paralleled by similar changes in the “lipid rafts” and in the “response to mechanical stimulus” (see Table 2). In the Younger Group, the class of “lipid-rafts” comprised 16 genes [ERBB4, PSEN1, MAPT, beta-secretase enzyme (BACE1), SLC1A2, RGS7, PRKACA, ARC, KCNQ3, SNAP25, MAPK3, PLCB4, FYN, CTNN1, NOS1, NOS1AP; FDR = 3.4 × 10⁻⁹], whereas in the Elder Group only 7 genes (PSEN1, MAPT, TLR4, PRKACA, CASP3, ARC, APP; FDR = 4.0 × 10⁻⁴). No significant lipid-rafts were detected in the MCI even when two sub-units of the NMDAR (GRIN2A, GRIN2B) belong to this class. Note that in the Elder Group the gene APP that encodes for the amyloid precursor protein.
Consistently with the above results, only the Younger Group showed a significant level of the raft-marker flotillin-1 (FDRYounger = 1.8 × 10⁻²), together with significant flotillin-2 interactions (FDRYounger = 1.2 × 10⁻²). Other components of the membrane rafts, like the proteins caveolin-1 and caveolin-2 were detected in all the groups, but caveolin-3 appeared only in the Elder and MCI Groups. The structure of “caveolae” was significant only in the Younger Group (FDR = 6.3 × 10⁻³), while not “caveola” but caveolin interactions were significant in the Elder Group (FDR = 9.1 × 10⁻³). The importance of caveolin 1 in neurons is clear because of its multiple partners (NO synthase, G-proteins alpha/beta/gamma, adenylate cyclase, PKA, PKC, MAPK, SRC, PI3K). In the pre-synapses, caveolin 1 protein colocalizes with the ganglioside GM1 (another marker of rafts), where its palmitoylation is required to support the synaptic transmission. Moreover, caveolin 1 controls both the exocytosis of synaptic vesicles and the rate of vesicles’ endocytosis [88]. In post-synapses, caveolin 1 enhances the localization of GRIN2B in the raft microdomains, allowing the survival of neurons through the activation of both, ERK1/2 and the non-receptor SCR kinases FYN, SCR, LYNX [89].
Membrane rafts exert a critical role in the effective functionality of several glutamate receptors, such as the herein observed AMPAR (GRIA1/2/3), NMDAR (GRIN1, GRIN2A/2B), and metabotropic (mGluR1/R5) [90]. However, the availability of AMPAR at the synapses results from a complex dynamic balance between phosphorylation by distinct kinases, several post-translational modifications (palmitoylation, ubiquitination, S-nitrosylation), modulation by TARPs interacting proteins (auxiliary L-type of VGCC gamma sub-units CACNG1/8), and interactions with the cornichon-like family of proteins (CNIH2/3) see review of Bissen et al. [91].
Concerning the NMDAR, the subunits GRIN2A/GRIN2B are associated to the lipid rafts at the plasma membrane through the interaction with the proteins flotillin 1 and 2. In fact, this localization of NMDAR subunits can evoke some of the typical down-stream signaling activities, such as ERK1/2 activation, p140CAP interaction, and postsynaptic density (PSD)-95 colocalization [92]. However, a competitive process has been reported, regarding the partition of the NMDAR sub-units between lipid rafts (enriched in SRC and ARC proteins) and other membrane non-raft microdomains (enriched in PSD-95, CAMK2A, and SYNGAP) [93]. This apparent contradiction can be due to the very complex phenomena that regulate the interchange of PSD-95 between both raft and non-raft membrane compartments in the neuronal PSD. In fact, around 1,000 proteins participate in the PSD macromolecular structure, where the neurotransmission takes place [94].
Other proteins also appeared associated to membrane rafts. Some of them were common to the Younger and Elder Groups (PSEN1, MAPT, ARC, PRKACA), whereas others were exclusive to the Younger Group (ErbB4, BACE1, SLC1A2, PLCB4, RGS7, FYN, NOS1, NOS1AP) or to the Elder Group (APP, TLR4, CASP3). In the Younger Group, the receptor ErbB4 is located in the GABAergic (PV+) interneurons. Its activation enhances the steps of proliferation of neural precursor cells (NPCs) in adult neurogenesis, but not their differentiation nor maturation [95]. The enzyme NOS1 produces NO in response to activation of NMDAR. This NO acts as a retrograde messenger, enhancing presynaptic glutamate release [96]. In turn, the adaptor protein NOS1AP/CAPON is linked to the glutamatergic PSD protein PSD-95/DLG4 through interaction with NOS1, but these proteins have an optimal interval of activities to avoid noxious effects. NOS1AP mediates the activation of NOS1 in a Ca2+-dependent manner. But only when NOS1 interacts with the protein PSD-95 through their PDZ motifs, NOS1 moves close to NMDA receptor, where the local Ca2+ influx results in its activation. However, excessive activity of NOS1 due to NMDAR hyperactivation leads to neuronal injury. Moreover, the overexpression of NOS1AP markedly increased the interaction of NOS1 with PSD-95 but reduced the density of dendritic spines, and affected their morphology in the CA1 synapses. As a consequence, the spatial working memory decreased and social memory impairments appeared [97].
Rafts in the Younger Group also appeared enriched in RGS7, which modulates some G-protein coupled receptors (e.g., muscarinic CHRM2 receptor, GABAB type receptors). These regulations involve both the neuronal (P/Q)/N-type VGCCs and the G-protein-gated GIRK potassium channels [98]. However, depending on the relative availability of the RGS7-partners, R7BP, and GPR158, the final effect of RGS7 can result respectively either into increasing (or diminishing) the inhibitory effects of GABAB receptor on the c-AMP production by the enzyme adenylate cyclase, and hence, on negative (or positive) effects on memory formation [99]. Interestingly, GIRK2 receptor appeared miss-localized in AD, which could explain the alterations of neuro-excitability observed [100].
Related to rafts, significant transcription of the ARC gene was present in Younger and Elder Group, but not in the MCI Group. This could be an important difference because ARC is “an early induced gene” that encodes for a cytoskeletal protein in response to NMDAR activation. Moreover, ARC protein participates in the process of memory trace, and memory consolidation [101]. The ARC protein has been related to mechanisms of LTD induced by the activation of mGluR1/5 [102]. However, we observed increased LTD in the MCI Group with increased mGluR1/5 without dysregulated ARC transcription. This apparent discrepancy can be understood by the following: (i) NMDAR could be more determinant than mGluR1/R5 in the induction of LTD [102]; (ii) being required to induce ARC, the glutamatergic signaling was minimal in MCI Group (see Figure 2B); (iii) ARC is also required to internalize the AMPAR and produce LTD [103], but ARC was not enhanced in the MCI Group. Despite this situation, LTD was maximal in the MCI (see Table 2). This opens the possibility to other alternative mechanisms to produce LTD [104].
The “response to mechanical stimulus” in the Younger Group comprised 15 genes, of which 7 genes (marked with * here) also participate in the “detection of the mechanical stimulus” [CACNB3*, BACE1*, FOS, ETV1, REST, GRIN2A*/2B*, KCNQ3, RYR2, SCN1A*, FYN*, NOS1, CXCL12*, JUN, MAPK3; FDR = 1 × 10⁻⁹]. Instead, in the Elder Group, the response to mechanical stimulus comprised 9 genes, but only 3 genes participated in the detection of this stimulus [TLR4*, GRIN2A*/2B*, FOS, CASP2, CASP3, KNQ2, MAPK8, APP; FDR = 2.9 × 10⁻⁴]. The MCI Group had 3 genes of response to mechanical stimulus, but only two of them are related to its detection [GRIN2A*/2B*, IGF1; FDR = 3.5 × 10⁻²]. In fact, for most of the molecules encoded by the genes marked here with *, a close relationship between their sensitivity to mechanical stimulus and their location in membrane rafts was reported. Such are the cases of the NMDAR subunits GRIN2A/2B [105], TLR4 [106], the cross-talking between NMDAR and TLR4 [107], CACNB3 [108], SCNA1A [109], FYN/SRC-mediated endocytosis of NMDAR [110]. Interestingly, the potassium channels KCNQ2 and KCNQ3 to be targeted toward the lipid rafts need to recruit the BACE1, which exerts a role different to the actions in amyloidogenesis [111]. Moreover, the establishment of clusters of channels (“hot-spots”), in addition to their localization in membrane rafts, also depends on the interactions between channels and the cytoskeleton [108].
Anterograde and retrograde axonal transport
Neuronal homeostasis requires precise spatial and temporal integration between input and output signals, supported by material fluxes. This dynamic system must supply essential building blocks (organelles, mRNAs, proteins, and other molecules) in a timely manner. Consequently, local circuits involving various types of vesicles in the neuronal body are connected to the remote locations of neuronal extensions, such as neurites, dendritic spines, and axon—see review of Chanaday et al. [112]. In this context, we have analyzed the main effectors that were operating in the so-called “anterograde transport” (from the neuronal body toward the synapses) as well as in the so-called “retrograde transport” in the reverse direction (see Table 3).
Comparison between the differential genes related with axonal transport and autophagy across the three stages analyzed (Younger, Elder, and MCI Groups)
| Functionality | Younger | Elder | MCI |
|---|---|---|---|
| RAS-associated binding proteins (RABs) | RAB2B, RAB18, RABGAP1L, RAB40B, RAB39A, RAB33A | RAB3C, RAB4A, RAB3GAP1, RAB8B, RAB11FIP2, RAB14, RAB26 | RAB3GAP1, RAB3IP, RAB3I, RAB4B, RAB6A, RAB11FIP5, RAB27A, RAB27B, RAB31, RAB34 |
| Kinesin motor proteins (anterograde transport) | KIF1C, KIF9 | KIF1A, KIF15, KIF21B | KIF2A, KIF3C, KIF5B, KIF22 |
| Dynein motor proteins (retrograde transport) | DYNC1I2 | DYNC1LI1, DYNCC1I1 | |
| Autophagy-related cysteine peptidases (ATGs) | ATG2B, ATG4C, ATG13 | ATG3, ATG10 |
In the Younger Group, RAB2B and RAB18 are involved in vesicle trafficking from the ER to the Golgi apparatus and in maintaining ER structure. The intermediate protein DYNC1I2, as part of the dynein complex, participates in the retrograde transport of vesicles and organelles along the axons. Regarding kinesin motor proteins, KIF1C (Kinesin 3) is involved in the anterograde transport of “dense core vesicles” (containing neuropeptides and neurotrophins) and “clear vesicles” (containing glutamate or GABA), as well as the delivery of integrin proteins and the transport of organelles. In contrast, KIF9 is involved in axon extension processes in response to axon injury.
In the Elder Group, normal mechanisms coexisted with others of the type adaptive. Regarding the former, the interacting protein RAB11FIP2 regulates both the transport of vesicles from the endosomal recycling compartment to the plasma membrane and the clathrin-mediated endocytosis. The kinesin motor KIF1A, regulated by BDNF, modulates neurogenesis mediated by the activation of the 5-HT3 receptor [113]. The kinesin motor KIF15 drives the transport of the proteins PSD-95 and Ankirin G to dendrites [114]. As for adaptive mechanisms, there was evidence of enhanced neurogenesis and increased autophagy. Thus, RAB8B participates in the axon extension during the process of “neuron maturation” in the DG [115]. RAB26 GTPase modulates synaptic and secretory vesicles toward transformation into pre-autophagosome structures, which eventually are degraded [116]. This is consistent with the detection of dysregulated cysteine peptidases autophagy-related cysteine peptidases (ATG2B, ATG4C, ATG13; see Table 3), given their correlation with the autophagy markers LC3A and LC3B [117]. The dynein intermediate chain DYNC1I1 helps to mitigate neuronal atrophy by promoting the formation of autophagosomes [118]. Additionally, KF1A expression is enhanced in diabetic individuals, leading to the disruption of the anterograde axonal transport [119].
In the MCI Group, it appears that the responsive mechanisms observed in the Elder Group were further intensified through the use of alternative molecules. For instance, the protein RAB3GAP1 has the infrequent characteristic of acting both as a GTPase activating factor (GAP factor) on RAB3A-3D, RAB5A, and RAB43, and as a guanine-nucleotide exchange factor (GEF) on RAB18, that regulates the transport to lysosomes. In the case of RAB3 protein, RAB4GAP1 helps to maintain the structure of the ER [120]. The RAB31P acts as GEF by activating the RAB8B, which was also present in the Elder Group. The positive effect of RAB31P on axon extension in granular cells is complemented by the kinesin protein KIF2A, which is abundant in the granular neurons of the DG, where it regulates the migration, pruning, and axon elongation. The availability of KIF2A prevents aberrant dendro-axonal conversion that affects post-natal neuronal network wiring [121]. Unlike other kinesins of the same family as KIF5A/5C, KIF5B protects against deficits in dendritic spines morphogenesis, synaptic plasticity defects, and faults in memory formation [122].
Importantly, in the adult hippocampus, the kinesin KIF3C is involved in transporting “RNA granules” to the growth cones when axons are injured. This is achieved by the assembly of complex FMRP-KIF3C-RNA granule, where FMRP is the fragile mental retardation protein 1 [123]. Interestingly, the ontology class corresponding to “fragile X syndrome” pathway (here, an indirect measure of FMRP), showed a slightly diminished significance in both the Elder and MCI Groups (FDRYounger = 4.0 × 10⁻¹⁰ vs. FDRElder = 7.9 × 10⁻⁷ vs. FDRMCI = 2.5 × 10⁻⁸). More conclusively, the ontology category corresponding to “neuronal growth cones” exhibited a clear decreasing trend across the three analyzed stages (FDRYounger = 2.0 × 10⁻¹⁰ vs. FDRElder = 1.9 × 10⁻⁵ vs. FDRMCI = 2.3 × 10⁻³).
Neurotrophins, stress responses, and basic neuronal processes
To characterize the relationship between some key properties of neurons and astrocytes—the major cell population directly interacting with neurons—as well as their potential consequences on the neurobiological performance in the hippocampus, we compiled changes in several relevant functionalities (see Table 4).
Comparative significancea of the main indicators of basic neurobiological processes across the three stages analyzed (Younger, Elder, and MCI groups)
| Functionality | Younger | Elder | MCI |
|---|---|---|---|
| NTRKs signaling | 8.97 | 6.68 | 0 |
| GDNF/RET signaling | 1.49 | 0 | 2.76 |
| Neuroinflammatory response | 2.95 | 5.39 | 0 |
| Cellular response to stress | 3.40 | 4.09 | 0 |
| Regulation of stress response | 2.43 | 2.96 | 0 |
| MAPK cascade | 6.95 | 3.23 | 2.57 |
| Stress-activated MAPK cascade | 1.84 | 1.77 | 0 |
| Response to hypoxia | 6.95 | 5.19 | 0 |
| Response to oxidative stress | 1.97 | 2.79 | 0 |
| Cellular response to Abeta peptide | 5.30 | 6.97 | 5 |
| Positive amyloid fibril formation | 2.01 | 3.35 | 0 |
| ER stress & response to unfolded proteins | 0 | 3.08 | 0 |
| Intrinsic apoptosis in ER stress | 0 | 4.69 | 0 |
| Osmotic stress | 0 | 1.84 | 0 |
| Response to glucocorticoids | 1.70 | 6.59 | 0 |
| MeCP2 transcriptional regulation | 6.39 | 5.32 | 3.79 |
| DREAM pathway | 4.61 | 2.35 | 0 |
| Transcription regulation by NPAS4 | 5.47 | 2.74 | 0 |
| Sumoylation of intracellular receptors | 2.30 | 2.96 | 0 |
| CNS development | 12.52 | 13.32 | 0 |
| Pattern specification (GO: 0007389) | 1.83 | 4.83 | 0 |
| Gliogenesis | 5.65 | 9.16 | 1.37 |
| Astrocyte projection | 3.53 | 1.84 | 0 |
| Astrocyte activation | 2.54 | 4.84 | 1.46 |
| Neurogenesis (positive regulation) | 3.92 | 4.50 | 3.04 |
| Neurogenesis (negative regulation) | 2.57 | 2.26 | 0 |
| Cell fate commitment | 0 | 3.44 | 0 |
| Dendrite development | 7.59 | 6.59 | 0 |
| Dendrite spine organization | 7.27 | 3 | 1.37 |
| Axonogenesis | 11.99 | 9.48 | 1.37 |
| Collateral sprouting | 4.27 | 4.15 | 1.60 |
| Response to axon injury | 1.77 | 2.77 | 1.33 |
| CA3-pyramidal cell dendrites | 1.45 | 0 | 1.86 |
| Hippocampal mossy fibers (DG-CA3) | 3.05 | 1.63 | 0 |
| CA1-Schaffer collateral synapses | 2.62 | 1.84 | 3.45 |
| Fear response | 4.87 | 2.54 | 1.60 |
| Rhythm process | 4.46 | 6.12 | 1.76 |
a The significance is expressed as –log10 (FDR), where FDR is the false discovery rate. ER: endoplasmic reticulum; NTRKs: neurotrophic tropomyosin-receptor kinases; NPAS4: neuronal PAS domain protein 4; CA: cornu ammonis; DG: dentate gyrus. Note that a zero value denotes a non-significant functionality, as FDR = 1 (For details of the genes involved see Tables S1–S3)
Cellular responses to stress and hypothalamic-pituitary-adrenal axis
Table 4 shows that from the Younger Group, the aptitude of neurons to respond to cellular stress and to regulate it properly diminished sharply. Although the stress response was still conserved in the Elder Group, it relied on a different subset of genes compared to the Younger Group [UBQNL1, REST, FOS, MAPK3/ERK1, MAPK7/ERK5, SPI1, LRP1, FYN, CDC42, CXCL12, PAFAH1B1; (FDRYounger = 3.9 × 10⁻⁴) vs. HIF1A, HMGCR, MAPT, TLR4, MAPK8/JUN, BCL2, CASP3, APP; (FDREldered = 9.8 × 10⁻⁵)].
In the Younger Group, the protein Ubiquilin 1 (UBQNL1) enabled neurons to operate the ERAD system for protein quality control [124]. Its absence in the Elder Group is consistent with the peaks observed in the “ER stress/response to unfolded proteins” (FDR = 8.3 × 10⁻⁴) and “apoptosis associated to ER stress” (FDR = 2 × 10⁻⁵) (see Table 4). Additionally, in line with the observations of Lee et al. [125], both “autophagy” and “macro-autophagy” also peaked in the Elder Group (FDRYounger = 2.8 × 10⁻² vs. FDRElder = 1.6 × 10⁻⁴ vs. FDRMCI = 1). This was also supported by the coincident changes exhibited by the ATGs (see Table 3 in Anterograde and retrograde axonal transport).
The stress responses were paralleled by the “clearance of the peptide Aβ” that also peaked in the Elder Group, even when “β-amyloid peptide production” and “fibril formation of β-amyloid” already occurred to a lesser degree in the Younger Group (see Table 4). All these sources of stress coexisted with the dysregulation of “HIF1alpha” and “hypoxic conditions” (see Table 4). However, the transcription factor HIF1alpha and the APP, both participate in the first line of the “general response to stress” through the hypothalamic-pituitary-adrenal (HPA) axis [55, 126–128].
This latter is consistent with the peak of “response to glucocorticoids” in the Elder Group (FDRYounger = 2 × 10⁻² vs. FDRElder = 2.6 × 10⁻⁷ vs. FDRMCI = 1, see Table 4). In turn, the changes of the transcriptional regulator NPAS4 in Table 4 were consistent with both, the inhibitory effect of glucocorticoids on NPAS4 transcription [129] and the changes observed in the epigenetic regulator MeCP2 [130].
Importantly, the loss of the “cellular response to stress” in the MCI Group can be explained by a sharp fall in the corticotropin-releasing hormone (CRH) signaling. In fact, besides the CRH produced in the hypothalamus, a subset of GABAergic (PV+) interneurons operating in the hippocampus also generate this peptide [79, 131]. The analyses performed herein showed that CRH signaling diminution in the MCI Group was due to a diminution of the receptor CRHR1 (FDRYounger = 4.4 × 10⁻⁴ vs. FDRElder = 2.6 × 10⁻⁵ vs. FDRMCI = 2.5 × 10⁻²). The loss of CRH-CRHR1 signaling in the MCI group could have dramatic consequences, not only diminishing the response to stress [132], but altering neurogenesis [133], increasing the excitability of pyramidal neurons [134], and disrupting the gamma oscillations of cognitive functions [135].
Neurotrophins signaling
The Elder Group showed a sharp diminution in the signaling through the neurotrophic factor GDNF and its receptor RET, whereas the MCI Group showed a drastic diminution in the neurotrophic tropomyosin-receptor kinases (NTRKs) signaling, i.e., through the NGF/TrkA and BDNF/TrkB pairs (see Table 4). The reasons for why the apparent recovery of the GDNF signaling in the MCI Group could not be effective are analyzed in MAPKs signaling.
In the Younger and Elder groups, both NGF and BDNF signaling had some molecules in common (BDNF, FOS, ARC, GRIN2B, BAX, MEF2A, MEF2D). However, the Younger Group appeared differentially associated to one neurotrophin (GDNF), two transcription factors (REST/NRSF, MEF2C), and two protein-serine/threonine kinases (MAPK3/ERK1, MAPK7/ERK5). Instead, the Elder Group was differentially associated to the neurotrophin NTF3 and the transcription factor CREB1. In the Younger Group, the dysregulation of ERK5 enhances the process of neurogenesis in the DG, allowing LTP maintenance and spatial learning [136]. On the other hand, due to a positive cross-talk between the neurotrophins BDNF and NTF3, this latter could develop effects in the Elder Group equivalent to those produced by BDNF when both are within the physiological range of concentrations [137].
Note that BDNF, acting both as an input stimulus and as an output product, allows to close a feed-forward loop on the excitatory synapses as well as on the inhibitory synapses. Importantly, in both Younger- and Elder-Group, the BDNF (and also partially NGF) drives several fundamental processes of learning and memory by the “immediate induction genes” as Egr1 [138], FOS [139], ARC [140], and NPAS4 [141]. Therefore, a marked fall of NGF and BDNF signaling in the MCI Group can be expected, resulting in important constraints to the cognition abilities regulated by these molecules.
Similarly, in the Elder Group the lack of significant “GDNF signaling” can also interfere not only with neuronal survival but with synaptic plasticity. In fact, the loss of GDNF leads to defective dendrite morphogenesis and spinogenesis, thus distorting the processes by which the adult-new born granule neurons are integrated to pre-existing hippocampal circuits [142]. Note that GDNF acts in an autocrine manner under normal conditions, but in paracrine form under stress conditions [143]. Moreover, GNDF and BDNF are both able to induce the AMPAR sub-unit GRIA2, but NPAS4 is able to repress this induction, as well as the transcription of the NMDAR sub-unit GRIN1 [144].
REST silent factor and gliogenesis
Compared with the Younger Group, the lack of significant transcriptional repressor REST/NRSF in the Elder and MCI groups can enhance the processes of neurogenesis (see in Table 4 the pattern followed by the neurogenesis). However, according to data in Table 4, the process of gliogenesis predominated largely over neurogenesis, even during the peak of REST/NRSF in the Elder Group [FDRgliogenesis = 7 × 10⁻¹⁰ vs. FDRneurogenesis = 3.1 × 10⁻⁵]. In fact, the silent factor REST/NRSF acts as a repressor in the presence of co-repressors mSin3A and HDAC1, thus maintaining the quiescent stage of neural stem cells in the neurogenic niche. But, depending on the context of the neurogenic niche, the expression of the (truncated) isoform REST4 can turn repression into de-repression, thus leading to neuronal differentiation [145].
The availability of REST in the Younger Group could allow these individuals to maximize their cognitive reserves under stressful conditions and against the neurotoxicity of the peptide Aβ [146]. However, REST can also lead to apoptosis under ischemic conditions [147]. The data herein obtained regarding the loss of REST, NGF, BDNF, GDNF, NFT3 in the MCI Group align with the findings previously reported data of Ginsberg et al. [148]. However, in the present study, a reduction in REST was also observed in the Elder Group. Note that according to the herein observed expression of REST, and following some published evidence, it can be expected that both Elder and MCI Groups exhibit diminished spatial- and fear-conditioning memory tasks due to an altered hippocampal synaptic transmission and the affected activity-dependent synaptic plasticity [146]. In fact, we have identified the occurrence of these synaptic alternations in Elder and MCI Groups (see Table 2 in Action potential and mitochondrial depolarization).
MEF2 transcription factors
No significant members of the family of myocyte-enhanced transcription factors (MEF2s) were detected in the MCI Group. So, the MCI Group might be affected due to the lack of the beneficial effects associated to MEF2A [149, 150], MEF2C [151], and MEF2D [152, 153], all of which were detected in the Younger Group (see Table S1).
The Elder Group only expressed MEF2A and MEF2D significantly (see Table S2). Hence, the loss of MEF2C in the Elder Group also can interfere with some critical functions not covered by MEF2A or MEF2D [151, 152, 154]. Due to the occurrence of active caspases, even the potential positive effects of MEF2A and MEF2D in the Elder Group could be ineffective [155]. In fact, the activity of caspases reached a peak in the Elder Group, such as can be inferred from the patterns followed by the “intrinsic ER apoptosis (FDR = 2 × 10⁻⁵) in Table 4, and the “cleavage of cytoskeleton by caspases” (FDR = 4.4 × 10⁻³) in Figure S2E.
Although the family of MEF2 factors has some redundant effects, it is well known that MEF2C exerts the major influence in maintaining neuronal survival and synaptic plasticity in hippocampus [152]. Specifically, MEF2C enhanced dendritic arborization, spine formation, and synaptic transmission in granule neurons of DG in the hippocampus. These effects avoid the generation of autism-like symptoms (deficits in social recognition and in the detection of novel objects), even when the transgenic overexpression of MEF2C showed a blocking effect on the global process of neurogenesis [151]. This latter seems to be consistent with others that reported that mice triple KO for MEF2A/2C/2D show uncoupled dendritogenesis with respect to the process of neurogenesis, so that NPCs type I can proliferate with partial maturation of granule neurons, but with atrophy of the neurites [154]. Therefore, in the Elder and MCI Groups that lacked dysregulated MEF2C, some abnormalities might appear. This is consistent with the herein changes observed in the items “dendrite development” and “dendrite spine organization” (see Table 4).
MAPKs signaling
Importantly, Table 4 shows a significant fall in the MAPK activity across the three stages analyzed. In this regard, the Younger Group included 21 genes (NR2C2, ERBB4, PSEN1, SPI1, CAMK2D, GRIN2B, GRM5, MEF2A, MEF2C, CCKBR, JUN, CAMKK2, PTPRR, PAFAH1B1, LRP1, CCL2, FGF14, MAPK3, MAPK7, CDC42, CXCL12; FDR = 1.1 × 10⁻⁷), the Elder Group comprised 10 genes (PSEN1, APP, NTF3, TLR4, LRP1, HMGCR, GRIN2B, MAPK8, MEF2A, AR; FDR = 5.9 × 10⁻⁴), and the MCI Group included 8 genes (IGF1, LRP1, GRIN2B, GRM1, GRM5, GFRA2, GFRA4, RASGRF1; FDR=2.7 × 10⁻³).
The beneficial effects of MAPK activity in the Younger Group can be inferred by considering some of the molecules participating in its regulation: (i) The activation of the receptor to cholecystokinin CCKBR up-regulates the PI3K/Akt signaling, thus maintaining synaptic proteins, spatial learning, and memory [85]; (ii) activation of receptors CXCR4 or CXCR7 by chemokine CXCL12 enhance the process of neurogenesis, enabling normal synaptic transmission in mossy fibers (MF) [156, 157]; (iii) in the CA1 subfield, FGF14 modulates synaptic transmission, synaptic plasticity, and the initiation of the action potential by enhancing the clustering of potassium and sodium voltage-gated channels (KCNQ2/KCNQ3, SCN8A respectively) [158, 159]; (iv) the receptor-type protein tyrosine phosphatase PTPRR allows either to sequester or to release MAPK effectors (ERK1/2, p38alpha) depending on the degree of PKA activation (Genecard); (v) the ligand-activated transcription factor NR2C2 expressed in the new-born granule cells enhances the integration of these cells in the hippocampal circuits [160]; (vi) during adulthood, the lissencephaly protein LIS1 (PAFAH1B1 gene) is required in the GABAergic (PV+) interneurons to efficiently regulate the glutamatergic pyramidal neurons [161], and to allow cellular migration during neurogenesis [162]; (vii) the GTPase CDC42 allows microtubule stabilization and axonogenesis [163], which finally contributes to LTP production and remote memory recalling [164]. Therefore, it is easy to understand that the down-regulation of these molecules, such as seen in the Elder Group, might deprive these neurons of most of the biological benefits previously enumerated.
Interestingly, the deficit in the MAPK signaling in the MCI Group can be explained by the dysregulation in the IGF1 and the lack of an effective GDNF signaling. In fact, it has been reported that the functioning of the pair IGF1/IGFR1 leads to a great activation of the PI3K/AKT route, as opposed to a very poor MAPK activation due to the scarce phosphorylation of the protein Shc [165]. Moreover, although the GDNF co-receptors GFRA2 and GFRA4 appeared as significant in the MCI (FDR = 1.7 × 10⁻³), this does not mean that GDNF signaling was active. In order to be effective, the GDNF/RET signaling requires two additional conditions, besides the activation of the co-receptors. Thus, the receptor RET must be localized in lipid rafts [166, 167], but these microdomains appeared diminished in the MCI group (see Table 2). In addition, the protein sortilin1 (SORT1) is also required [168], but this protein is diminished by 40% in the MCI Group. Consequently, the fall in the MAPK signaling in the MCI Group, due to the ineffective GDNF signaling, could alter the processes of neurite outgrowth, spinogenesis, and the circuital integration of new-born granule neurons [142]. Moreover, the negative effects associated to the loss of GDNF/RET signaling could be potentiated even more in the MCI (see Table 4) due to the sharp diminution of BDNF signaling, also mediated by the MAPK cascade [169].
DREAM, NPAS4, and MF
Importantly, Table 4 shows the parallel changes in the DREAM pathway and NPAS4 transcriptional activity, which are closely related to the changes observed in MEF2C. In fact, DREAM (original name)—better known as KCNIP3 (official name) or Calsenilin/KchiP3 (old names)—has the notable property of acting either as a silent transcription factor in the nucleus or as the regulator of the potassium channels KCND2/KCND3 at the plasma membrane. The predominance of one role or the other is not easily predictable because of its very intricate regulation. This depends on the balance between contrary processes of sumoylation-desumoylation [170], the crossed controls exerted by the metabotropic glutamate receptors GRM5 and GRM1 [171], the instances of palmitoylation [172], and its own phosphorylation [173]. Moreover, DREAM can also interact and modulate the presenilin proteases PSEN1/2 [174], as well as NMDAR activity [175], thus conditioning survival, and contextual memory [176].
Remarkably, the variations in the MF synapses observed in Table 4 are fully consistent with the associated decline reported for the “contextual memory” under similar conditions [177]. Moreover, in addition to their glutamatergic nature, MF synapses also secreted the neurotrophin NTF3, which was not significant in the MCI Group, as was already commented. Therefore, based on the report of Tan et al. [178], could be expected that the absence of NTF3 leads to a limited post-synaptic LTP due to a limited AMPAR current, as well as to less availability of the NMDA receptor-subunit GRIN1 in the stratum lucidum of CA3 region.
Sex interactions effects
The analyses revealed that sex interactions affect a wide range of functionalities. However, quite different modalities of sex interactions were detected (see Table 5).
Interaction effects between neuronal functionalities and sexa
| Group | Associated to | Ratio 1 | Ratio 2 | Functions |
|---|---|---|---|---|
| 1 | Female | >> 1 | >> 1 | Neurogenesis, generation of neurons, inorganic ion transport, cell metal ion homeostasis, response to corticosteroids |
| 2 | Female, but enhanced in Younger | >> 1 | > 1 | Cognition, learning/memory, cation ion homeostasis, metal ion transport |
| 3 | Female, but enhanced in MCI | > 1 | >> 1 | SNC process, neuron projection morphogenesis, morphogenesis in neuron differentiation |
| 4 | Female, but only in Younger | >> 1 | ≈ 1 | Behavior, modulation of chemical synaptic transmission, inorganic cation transport |
| 5 | Female, but only in MCI | ≈ 1 | >> 1 | Neuron development, neuron differentiation, cell projection morphogenesis, collateral sprouting, glial differentiation, neuron migration, axonogenesis, apoptosis, BDNF receptor signaling, glutamate secretion |
| 6 | Female in Younger, but Male in MCI | >> 1 | << 1 | Cell-cell signaling, trans-synaptic signaling, chemical synaptic transmission |
| 7 | Female, but only in Younger | >> 1 | NSb | Circulatory system, memory, associative learning, LT-memory, pain perception, NPC proliferation, gliogenesis, glial cell fate commitment, apoptosis, action potential, aging, axon guidance and ensheathment, IGFR1 signaling, response to hypoxia, inflammatory response, Ca2+ ion homeostasis |
| 8 | Male | << 1 | << 1 | Glutamatergic synaptic transmission |
| 9 | Male, but only in Younger | << 1 | NSb | Response to iron (Fe2+), copper ion (Cu2+) transport, negative regulation of neuron projections |
a The type of conditional association was determined by comparing the values of Ratio 1 and Ratio 2, which summarized the information from two factorials based on equation 1 (Materials and methods); b NS: no significant change observed. For details of the genes involved see Table S4
Based on the comparison between R1 and R2 ratios, note that only the functionalities in Groups 1 and 8 can be characterized in terms of current first-order interaction coefficients. These functionalities appeared consistently associated with one of the sexes across all the biological stages considered in the two factorials examined. Conversely, the functionalities comprised in Groups 2–7 required second-order interaction coefficients, due to significant variations in their first-order interaction coefficients, depending on the biological stage tested. Thus, in Groups 2 and 3, these functionalities remain associated to a given sex (females), but the strength of the association varies depending on whether the Younger Group or the MCI Group is considered.
Group 6 is unique because its functionalities are associated with one sex in one factorial (female in the Younger Group) but with the opposite sex in the other factorial (males in the MCI Group). The functionalities in Group 6 are an example of the so-called interactions with the cross-over effect (Karen Grace-Martin, The Analysis Factor). On the other hand, Groups 4, 5, 7, and 9 can be seen as particular instances of interactions with crossing-effects, because sex-association manifests only under certain biological conditions. For example, functionalities in Groups 4, 6, and 7 were associated with females, but only in the Younger, MCI, and Younger Groups respectively. Likewise, functionalities in Group 9 were associated with males, but only in the Younger Group.
In addition, the pathway analyses conducted on the genes involved in the sex interactions revealed further differences (see Table 6).
Sex-conditioned effects as derived from the pathway analyses
| Sex-association | Functionality | FDR |
|---|---|---|
| Male (Younger Group) | Conservation of energy | 6.5 × 10⁻⁸ |
| Activation of AMPK by NMDAR | 3.6 × 10⁻³ | |
| BDNF and NGF signaling | 1.6 × 10⁻³ | |
| Pluripotency | 1.6 × 10⁻³ | |
| p38 alpha-beta signaling | 1.4 × 10⁻⁵ | |
| Dyrk1a in cell proliferation | 1.4 × 10⁻⁵ | |
| Female (Younger Group) | Post-synaptic events associated to NMDAR activation | 1.7 × 10⁻⁸ |
| Trafficking of GluR2-containing AMPAR | 5.8 × 10⁻⁶ | |
| NOS1 activity | 1.6 × 10⁻³ | |
| RAS activation by NMDAR | 1.0 × 10⁻⁴ | |
| PKC-gamma and Ca2+ ion signaling | 1.0 × 10⁻⁴ | |
| CREB1P-NMDAR activation | 1.0 × 10⁻⁴ | |
| BDNF signaling | 1.0 × 10⁻³ | |
| LTP | 4.0 × 10⁻⁵ | |
| Female (MCI Group) | p75NTR signaling | 1.6 × 10⁻⁵ |
| Cell death (mediated by NRAGE, NRIF, NADE) | 1.4 × 10⁻² | |
| NTRK2/TrkB through adapters FRS2 and FRS3 | 4.8 × 10⁻⁴ |
FDR: false discovery rate; NMDAR: N-methyl-D-aspartate receptors; NTRK: neurotrophic tropomyosin-receptor kinases; BDNF: brain-derived neurotrophic factor; NGF: nerve growth factor; AMPAR: α-methyl-D-aspartate-3-hydroxy-5-methyl-4isoxazolepropionic acid receptors; LTP: long-term synaptic potentiation; MCI: mild cognitive impairment
According to the results in Table 6, the functionalities associated to males in the Younger Group included molecules as MEF2A, MEF2B, MEF2C, SIRT1, glycogen synthase kinase 3 beta enzyme (GSK3B), MAPT, SRF, SGK1, and PSEN1. Hence, their profile appears oriented to better support the energy metabolism of neurons, synaptic activity, neurogenesis, and the response to cellular stress. In contrast, the functionalities associated to women in the Younger Group, included molecules as GRIP1, GRIN1, GRIA2, GRIA4, DLG4, PRKACA. Thus, their profile seems to be oriented to achieve a better support for synaptic plasticity, LTP, and related cognitive mechanisms as learning and memory. Interestingly, the functionalities associated to females in the MCI Group included molecules as BDNF, NTF4, SQSTM1, PSEN1. This profile seems to be oriented to support neuronal survival, apoptosis regulation, and the development of new neurons and synapses. In fact, the signaling by NTRK2/TrkB through the intracellular adapters FGFR substrate, FRS2, and FRS3, is important due to the role of FRS2/S3 in the processes of neurogenesis and synaptogenesis in adult hippocampus [179].
Importantly, we also detected significant sex interactions with “lipid rafts” (Lipid rafts and mechanical stimulus) and “anterograde/retrograde axonal transport” (Anterograde and retrograde axonal transport). Men in the Younger and Elder Groups showed molecules associated with lipid rafts (BACE1, PSEN1, MAPT, GSK3B; FDRmen = 3.5 × 10⁻²), that differ from those in women (KCNA5, KCND3, NOS1; FDRwomen = 6.4 × 10⁻³). Notably, the molecules in the men’s group are related with the amyloidogenic pathway for APP processing (BACE1; PSEN1; MAPT/Tau protein; GSK3B). In contrast, the molecules in the women’s group can protect neurons from the excessive excitation, due to the availability of potassium hyperpolarization channels (KCND3, KCNA5) and higher endocannabinoid production, linked to the higher availability of NO [180].
Regarding the axonal transport, women in the Elder and MCI Groups had a differential upregulation of RAB27B, RIN2, and KIF3C. In contrast, men in the same conditions exhibited upregulation of RAB4B, RAB6A, RAB31, and KIF2A.
In women, RAB27B is localized pre-synaptically in MF and the Shaffer collateral pathway. However, RAB27B favored LTP production only in the MF [181]. RAB27B may work in synergy with BDNF-induced RAB3A [182]. The protein RIN2 (Ras and Rab Interactor 2) is involved in the early endocytic pathway, where it activates RAB5, and links RAS activation with NMDA receptor endocytosis in an α-synuclein-dependent manner [79]. The motor protein KIF3C transports RNA granules to growth cones during axon regeneration [123]. Therefore, the profile of RAB proteins associated to the women’s group primarily maintains synaptic homeostasis by repairing axons and/or avoiding neuroexcitation.
In men, RAB4B supports neurogenesis by facilitating the provision of Fe2+ ions by recycling the transferrin receptor from the lysosomes after its endocytosis by ligand activation [183, 184]. RAB4B also maintains the homeostasis of cellular phospholipids by interacting with Golgi Associated Retrograde Protein Complex [185]. The protein RAB6A activates dynein, enabling the transport of the lissencephaly protein Lys 1 (PAFAH1B gene) [186]. The protein RAB31 is upregulated by FGF2 in parallel with protein RAB8B. Note that RAB31 interacts with at least 31 partners and enhances the production of extracellular-vesicles [187]. The motor protein KIF2A is abundant in the granular neurons of the DG, where it regulates the migration, pruning, and axon elongation of these cells [121]. FGF-2 promotes the proliferation of NPCs and is up-regulated following brain injuries [188]. Hence, the profile of RAB proteins associated to the men’s group was mainly oriented to regulate distinct steps of neurogenesis. In fact, it has been reported that the availability of Fe2+ alone, through a ferritin transport process, was able to modulate up to 346 genes [184].
Discussion
Concluding remarks
The computational pipeline used to disaggregate the homogenate data, together with the strategy followed to systematize the obtained information, enabled to identify a myriad of dysregulations across the three groups analyzed (younger adults, elder individuals, and elder with MCI). However, most of the important variations detected appeared as part of the “healthy” aging process. In fact, from 70 functionalities selected, based on their higher degree of variability, in 53 of them (75.7%) the change occurred in the Elder Group, whereas only in 17 functionalities (24.3%) the variations were associated exclusively to the MCI stage. This type of distribution is consistent with previous studies on hippocampal endothelium [30] and hippocampal astrocytes [31].
Interestingly, although the Elder and MCI comprised a similar age interval, “aging phenotype” (GO: 0007568) seems to follow some hierarchical order since hippocampal neurons aged very late, associated to MCI Group (FDREldered = 1 vs. FDRMCI = 1.9 × 10⁻²; molecules CTSC, FOXO4, GRM5, and LRP1), whereas hippocampal astrocytes did from the Elder Group (FDRElder = 7.4 × 10⁻¹³), and hippocampal endothelial cells aged from the Younger Group (FDRYounger = 1.4 × 10⁻⁷).
The premature aging of endothelial cells aligns with multiple pieces of evidence supporting the “two-hits” theory for AD pathogenesis [189, 190]. Additionally, several key findings here support the accelerated aging of astrocytes: (i) “gliogenesis”, “glial differentiation”, “astrocytic activation”, and “microglia activation”, all peaked in the Elder Group; (ii) “astrocytes process” showed a clear decreasing trend across the three groups analyzed (see Table 4); (iii) both the Elder and MCI groups were associated with “astrocytosis” (FDRYounger = 1 vs. FDRElder/MCI = 6.4 × 10⁻⁴); (iv) astrocytes in the Elder Group exhibited a peak of “oxidative stress” due to the production of “ROS”, “reactive nitrogen species”, and “hydrogen peroxide” [31].
Note that the occurrence of “gliogenesis” can be detrimental for the production of new-born pyramidal neurons in the DG via post-natal “neurogenesis”. In fact, mature astrocytes and mature granule neurons share common precursors, but their lineages further diverge through highly-regulated specific differentiation processes [191–194]. Therefore, it can be expected that not only will astrocytic functions be affected, but many of their effects may also impact the cognitive functions of the neurons due to the tripartite-synaptic organization [195, 196].
The inflammatory dysregulation of astrocytes in the Elder and the MCI groups (see Table 4) herein and data in reference [31], together with the enhanced production of endocannabinoid by neurons (see Table 2), can lead to an exacerbated release of gliotransmitters [197]. Gliotransmitters as ATP and adenosine, acting at the pre-synapses, lead to a diminished release of glutamate from the pyramidal neurons [198, 199], resulting in reduced glutamatergic synaptic transmission (see Tables 2 and 4). Conversely, once released, gliotransmitters as glutamate and D-serine act at the post-synaptic level [197]. There, glutamate can activate the neuronal metabotropic receptors of Group I (GRM1 and GRM5) [200], while D-serine acting as co-agonist binds to the neuronal NMDAR [201]. D-serine is produced in astrocytes by the enzyme serine racemase, but under the oxidative stress prevailing in the Elder and MCI groups, the conversion of L-serine to D-serine is impaired. Consequently, D-serine levels may be very reduced, affecting CA1-dependent memory tasks [202, 203].
Importantly, the dysregulated astrocytic-neuronal interactions mentioned could also justify the great increment in the LTD observed in the MCI Group (FDRYounger/Elder = 3.7 × 10⁻⁴ vs. FDRMCI = 3.7 × 10⁻¹²) (see Table 2). Of note, the rise in the LTD was not associated to a significant decline in the LTP (FDRYounger = 6 × 10⁻⁷ vs. FDRElder = 1.5 × 10⁻⁶ vs. FDRMCI = 4.8 × 10⁻⁷) (see Table 2). The enhancement of LTD in the MCI Group was paralleled by a great increment in the NMDAR regulation (see Table 2). This increment was driven by three factors: the loss of MEF2C and CXCL12 expression from the Elder Group and the upregulation of RASGRF1 in the MCI Group. RASGRF1—a RAS-specific GEF protein—has effects opposite to those of RASGRF2, which was not detected in this study. In adults, RASGRF1 leads to LTD, while RASGRF2 leads to LTP [204]. Consistent with the observations of Jin et al. [205], the reduced prevalence of RASGRF2 was herein corroborated by the progressive decline in the “response to fear contextual memory” in the Elder and MCI groups (FDRYounger = 1.3 × 10⁻⁵ vs. FDRElder = 2.9 × 10⁻³ vs. FDRMCI = 2.5 × 10⁻²). The fact that the peak of LTD was not accompanied by a simultaneous depotentiation could be attributed to the predominance of homo-synaptic plasticity over the hetero-synaptic plasticity phenomena [206]. Additionally, distinct hippocampal subfields can exhibit different—or even opposing—forms of neuronal plasticity simultaneously, thus allowing for the coexistence of LTP and LTD (e.g., see table 2 in reference [207]).
Importantly, the significance of the MF—unmyelinated axons projecting from the granular neurons of DG to neurons in the CA3 region—appeared diminished in the Elder and MCI groups (FDRYounger = 1.3 × 10⁻⁵ vs. FDRElder = 2.9 × 10⁻³ vs. FDRMCI = 2.5 × 10⁻²). Evidence for the decrease in mossy fibers in the Elder and MCI groups was marked by the absence of the opioid precursor peptide prodynorphin (PDYN), the progressive decline of the BACE1, and the BDNF. Consistently, the dendrites of the CA3 pyramidal neurons also appeared diminished in the Elder Group (FDRYounger/MCI = 2.4 × 10⁻² vs. FDRElder = 1) (see Table 4).
Of note, “GAP junctions” also exhibited a sharp decrease in the Elder Group (FDRYounger/MCI = 4.3 × 10⁻⁵ vs. FDRElder = 1) (see Table 2). This observation is relevant because GAP junctions are present in the CA3-MF [208] and in the Schaffer collateral pathway that projects CA3 axons to the dendrites of the CA1 region [209]. The GAP junctions are required to facilitate the neuronal synchronization through the interchange of ions and low molecular-weight metabolites between several types of cells: astrocytes-neurons [210–212], axo-axonic principal neuron interactions [208], and between interneurons [213].
Therefore, the alterations in the MF and the GAP junctions might interfere with the generation of the characteristic theta and gamma rhythms, that synchronize the neuronal firing in the hippocampus, influencing the processes of attention, memory, and cognition [214, 215]. In addition, the alterations in the CA3 MF are particularly important because this can compromise the generation of sharp-wave ripple (SWR) waves, which are needed for the consolidation of short-term episodic memories, spatial memories, and social memories [216, 217]. Although the precise characterization of these oscillatory rhythms requires of electrophysiological studies, Table 4—based on ontology functionalities—suggested as very probable the occurrence of significant changes in the “rhythmic processes” (GO: 004851) across the three conditions analyzed (FDRYounger = 3.5 × 10⁻⁵ vs. FDRElder = 7.6 × 10⁻⁷ vs. FDRMCI = 1.7 × 10⁻²). The effect of the dysregulation in the “rhythmic processes” could be particularly relevant for the MCI Group, given the sharp fall of their significance under this condition. This claim is supported by the fact that “circadian rhythm” (GO: 0007623)—a category nested in the more ample class of rhythm processes—exhibited a different pattern of variation (FDRYounger/Elder = 2.2 × 10⁻³ vs. FDRMCI = 1), and was mediated by a distinct set of molecules.
Moreover, given the set of gains and losses observed at the Ca2+, K+, Na+ ion-channels, alterations in the hippocampal oscillatory patterns are expected (see Action potential and mitochondrial depolarization). In particular, the altered hippocampal oscillations observed in the Elder and MCI Groups are related to the loss of voltage-gated sodium channels SCN1A (enriched in interneurons) and the SCN1B (enriched in pyramidal neurons), as well as the loss of cholecystokinin receptor CCKBR1 in the GABAergic interneurons. These losses have consequent effects on learning and memory [70, 84, 218].
The findings that diminished glutamatergic and GABAergic transmission, along with exaggerated neuronal hyperexcitability is important because a considerable fraction of patients (25% in preclinical-AD, 27% in prodromic-AD/MCI, 50% in AD) actually exhibited epileptiform activity when examined using advanced techniques of electroencephalography (EEG) and magnetoencephalography (MEG). Moreover, most of these patients behaved as “rapid converts” in their curves of cognitive deterioration [219, 220]. However, advanced EEG and MEG methods have allowed to detect subclinical epileptiform activity (SEA), but mainly restricted to the cortical areas [221].
MCI and AD stages have been analyzed at a biophysical level, through a very laborious, sophisticated, but indirect procedure as the micro-transplantation of several human synaptic neuroreceptors in Xenopus’s oocytes. There, by combining flow cytometry, proteomics, transcriptomics, and in situ hybridization (ISH) analyses, it has been proven the occurrence of alterations in the excitatory-inhibitory (E/I) balance in the case of receptors coming from cortex synaptic-neuroreceptor implants but failed to demonstrate a similar effect with hippocampal synaptic-neuroreceptor implants [222].
While experimental electrophysiological and biophysical techniques continue to advance, the data obtained here indicate that the molecular alterations observed in healthy Elder and MCI groups suggest a possible stage of neuronal hyperexcitability. Therefore, the exploration of the alterations in hippocampal oscillatory waves in these patients needs to continue. In addition, several higher-order functionalities such as “cognition”, “learning-memory”, “behavior”, and “associative learning” appeared to be associated to varying degrees with the female condition (see Table 5). This finding suggests the need to investigate new gender-specific therapies to address this disease.
Limitations of the study
The sets of data herein analyzed, were generated by Berchtold et al. [28, 29]. The race of the brain donors was registered, and they adjusted the overall universe of brain samples to be representative of the USA population at that time (85% Caucasian to 15% African-Americans). However, a detailed analysis of the metadata corresponding to hippocampus, shows that the effective ratio of races finally used was affected because of the lack of samples from African-Americans in the Elder Group. It is known that Black people have a higher prevalence of AD compared with White people. However, despite the evident racial bias present in the set of samples analyzed, it was determined here that 76% of the most important changes in the altered functionalities were actually associated with the “healthy” Elder Group.
A similar problem arose with the proportion of ApoE4(–) to ApoE4(+) carriers, with the ratio varying between 1.83 in the Younger Group to 4.75 in the Eldered Group. It is known that the ApoE4 allele confers a high risk to develop late-onset AD, particularly in Caucasian individuals [223]. Unexpectedly, the prevalence of ApoE4 gene in Black individuals is higher than in Caucasians, but Blacks do not manifest a higher rate of cognitive decline, an effect known as “Nigerian Paradox” [224–227].
The high incidence of AD in Black women is explained by socio-demographic, educative, and style of life factors [228–231]. In any case, it was not possible to adjust ApoE as covariant here, as doing so would require a large number of cases in order to apply multivariate or machine learning approaches with sufficient statistical power [232]. The paradoxical effects described for ApoE4 could dampen the observed unbalances. Additionally, this minimization is influenced by the fact that neurons were analyzed here, whereas the main source of ApoE4 in the brain appears to be astrocytes [233, 234], and the primary target of ApoE4 are the endothelial cells [235–237].
Other limitations arising from the transcriptional nature of this study is that all the dysregulations detected have to be confirmed by proteomics or functional assays (electrophysiology, behavioral tests). Because data is derived from a tissue homogenate, many of the detected dysregulations cannot be associated to a specific hippocampal subfield [238]. This may require confirmation by spatial transcriptomics [27] or laser capture proteomics [239]. As a planned decision, this work did not consider any of the several types of polymorphisms (SNPs, CNVs, indels) that can modify the performance of the genes and molecules [240, 241].
In the light of the present knowledge, better protocols should be applied to recognize separately the stage of “pre-clinical” AD with respect to “cognitively healthy” Elders. The determination of clinical dementia rating score (CDR = 0) and Mini-Mental State Examination score (MMSE > 24) are not enough without monitoring markers as beta-amyloid peptides and p-tau molecules in cerebrospinal fluid (CSF) or by positron emission tomography (PET), and/or other image studies (functional-MRI, structural-MRI, CT) [242, 243]. Also, the occurrence of subjective cognitive deficits (SCD) should be assessed [244, 245] as well as the possible occurrence of subtypes within the amnestic MCI [246, 247]. A more in-depth covariation analysis of individuals considering their comorbidities and types of medication received, is desirable. Although herein, this problem was partially minimized due to the strict rules of inclusion/exclusion applied by Berchtold et al [28, 29], future studies should recruit a large number of individuals [248] to be capable to apply modern methods of causal analyses [249, 250].
Abbreviations
| AD: | Alzheimer’s disease |
| aMCI: | amnestic mild cognitive impairment |
| AMPAR: | α-methyl-D-aspartate-3-hydroxy-5-methyl-4isoxazolepropionic acid receptors |
| APP: | amyloid precursor protein |
| ATG: | autophagy-related cysteine peptidases |
| BACE1: | beta-secretase enzyme |
| BDNF: | brain-derived neurotrophic factor |
| CA: | cornu ammonis |
| CRH: | corticotropin-releasing hormone |
| DG: | dentate gyrus |
| EEG: | electroencephalography |
| ER: | endoplasmic reticulum |
| FDR: | false discovery rate |
| FMRP: | fragile mental retardation protein 1 |
| GEF: | guanine-nucleotide exchange factor |
| GSK3B: | glycogen synthase kinase 3 beta enzyme |
| LTD: | long-term synaptic depression |
| LTP: | long-term synaptic potentiation |
| MCI: | mild cognitive impairment |
| MEF: | myocyte-enhanced transcription factors |
| MEG: | magnetoencephalography |
| MF: | mossy fibers |
| NGF: | nerve growth factor |
| NMDAR: | N-methyl-D-aspartate receptors |
| NO: | nitric oxide |
| NPAS4: | neuronal PAS domain protein 4 |
| NPCs: | neural precursor cells |
| NTRK: | neurotrophic tropomyosin-receptor kinases |
| PSD: | postsynaptic density |
| PSEN1: | presenilin 1 |
| PV+: | sub-set of GABAergic interneurons containing the parvalbumin protein |
| RNA-seq: | RNA-sequencing |
| ROS: | reactive oxygen species |
| scRNA-seq: | single-cell RNA-sequencing |
| SGZ: | sub-granular-zone |
| VGCCs: | voltage-gated Ca2+ channels |
| VGSCs: | voltage-dependent Na+ channels |
Supplementary materials
The supplementary figures for this article are available at: https://www.explorationpub.com/uploads/Article/file/1001299_sup_1.pdf. The supplementary tables for this article are available at: https://www.explorationpub.com/uploads/Article/file/1001299_sup_2.xlsx.
Declarations
Acknowledgments
The author extends gratitude to Dr. Catalina A. Feledi for her valuable discussions and expert assistance in refining idiomatic expressions.
Author contributions
DVG: Conceptualization, Investigation, Visualization, Writing—original draft, Writing—review & editing.
Conflicts of interest
The author declares that he has no conflicts of interest.
Ethical approval
Not required.
Consent to participate
Not required.
Consent to publication
Not required.
Availability of data and materials
The original microarray data corresponding to the patients were gathered by Berchtold et al. [28, 29], and can be accessed under code GSE11882 in GEO database (https://www.ncbi.nlm.nih.gov/geo). The data generated in this study are available from Supplementary materials associated to the present article.
Funding
Not applicable.
Copyright
© The Author(s) 2025.
Publisher’s note
Open Exploration maintains a neutral stance on jurisdictional claims in published institutional affiliations and maps. All opinions expressed in this article are the personal views of the author(s) and do not represent the stance of the editorial team or the publisher.