
Abstract
Breath analysis is a relatively new topic of study that has a lot of potential for both therapeutic and scientific applications. The volatile organic compounds (VOCs) found in breath are created internally by the body due to environmental interactions, gut and air passage bacteria, and metabolites of ingested precursors. Breath analysis may help diagnose disorders linked to changes in breath composition, according to several recent research. An analytical technique that shows promise for the metabolic examination of breath is infrared spectroscopy. Chemical substances found in exhaled human breath can be used to diagnose illnesses, determine physiological states, or evaluate environmental exposure. Exhaled breath (EB) is the perfect biological fluid because it is nearly limitless and causes little to no discomfort for the patient, which promotes collaboration. Furthermore, EB can be sampled without requiring medical professionals or privacy, and it usually doesn’t produce infectious waste (despite airborne infections), which makes breath analysis a desirable method for a variety of applications. Breath analysis is a non-invasive method that solely uses the volatile composition of the EB to characterize the bloodstream and airways’ volatile content, which indicates the state and condition of the entire body’s metabolism. The absorption strength of the metabolites is still very modest, though, because EB contains minimal amounts of them. Several of the most recent uses of infrared spectroscopy for breath analysis, published between 2020 and 2024, are presented in this study.
Keywords
Breath analysis, infrared spectroscopy, non-volatile compounds, biomarkersIntroduction
The topic of breath analysis is relatively new, but it has much potential for clinical and scientific studies. One of the earliest methods of diagnosis in medicine is breath analysis, which uses certain smells to identify illnesses [1].
Each person has a unique “breath print” that can reveal a lot about their health. Thousands of molecules are released with every breath we exhale. Some people may find this news, but medical professionals shouldn’t. The field of breath analysis is as old as medicine itself. Hippocrates (460–370 BC) described fetor oris and fetor hepaticus in his treatise on breath aroma and disease [2, 3]. Lavoisier and Laplace studied guinea pigs’ CO2 breath for the first time between 1782 and 1783 and showed that the body’s combustion produces the exhaled breath (EB), and respiration consumes oxygen and expels carbon dioxide [4]. Nebelthau demonstrated that diabetics release breath acetone [5], while Anstie separated ethanol from the breath (the basis for modern breath alcohol testing) [6].
In the 1970s, Pauling et al. [7] made a significant contribution to the scientific study of breath by proving that EB contains much more than only the traditional gases of carbon dioxide, nitrogen, oxygen, and water vapor. 250 compounds were found in EB, according to Pauling et al. [7] investigation using gas-liquid partition chromatography. It is currently possible to identify over 1,000 distinct chemicals in EB using contemporary technologies. A wide range of volatile organic molecules and elemental gases such as carbon monoxide and nitric oxide are examples of these substances. Additionally, EB contains aerosolized droplets that are collected as “exhaled breath condensate (EBC)” and contain dissolved non-volatile substances like proteins.
Since the time of Hippocrates, clinicians have realized that human breath may offer reliable information about medical disorders and, in certain situations, a diagnosis. For instance, an experienced healthcare professional may quickly identify the characteristic fruity odor of acetone in diabetes, the musty and fishy odor of advanced liver disease, the urine-like odor of kidney failure, and the foul odor of a lung abscess. However, breath analysis has been a valuable diagnostic technique for a long time. Therefore, breath analysis is a desirable biochemical monitoring technique to track the development of other illnesses and bodily defects. Because it is a non-invasive process that can be used on various chemicals, it can even aid in predicting such disorders. Additionally, because the matrix is less complicated than blood or urine, the analysis is easier [8]. Manolis et al. [9] published the first review that discussed the presence of volatile organic compounds (VOCs) in EB. According to a recent review by Drabińska et al. [10], was demonstrated that 4,412 VOCs were discovered in bodily fluids and healthy human breath, including 1,488 in breath, 623 in skin, 549 in saliva, 444 in urine, 443 in feces, 379 in blood, 290 in milk, and 196 in semen. This information may help identify diseases and provide a better understanding of the metabolic pathways involved in the production of VOCs.
One of the most intricate living things in the universe is the human body. A complicated metabolism that involves a vast array of metabolic reactions advances to maintain its function. Numerous chemical and biological components are created or altered throughout these metabolic processes. Although there are variances based on individual metabolic or physiological states, such physiological reactions are well-regulated within healthy human bodies. It is possible to follow the onset (or recurrence) of a disease and the efficacy of a treatment by tracking the concentration of the molecules of interest across time [11]. In this way, a method to carry out breath analysis with high-resolution, broad-spectrum coverage, high specificity, and high sensitivity increases its accessibility and widespread adoption [11].
In the most recent investigation of health, a variety of biological materials have been used, including blood, plasma, feces, urine, cells, herbal extracts, EB, and EBC [12]. EBC is typically a sample that is obtained by capturing exhaled aerosols that come from the fluid that lines the lungs. It primarily consists of nonvolatile analytes, particularly those that dissolve in aqueous solutions [13]. The term “EB” describes gaseous samples that are drawn from EB and primarily comprise volatile analytes with trace amounts of nonvolatile analytes, particularly those with lower boiling temperatures [14]. Breath is a crucial matrix for the analysis of VOCs and non-volatile compounds produced by the body. After passing through the body’s bloodstream and arriving at the alveolar interface, these substances are eventually exhaled. Analyzing EB to find VOCs may reveal if a person is healthy or ill. Similar to blood testing in clinical medicine, but quicker and less invasive, identifying the type and concentration of molecules in breath is an effective method of evaluating a person’s general health. A diagnosis can be made easier if a certain molecule (or combination of molecules) has been detected and is indicative of the existence of an illness or infection [15].
With the appearance of new technologies (such as infrared, electrochemical, chemiluminescence, e-nose, and others) and the development of highly sensitive mass spectrometers, breath analysis has advanced significantly in the twenty-first century, and several techniques are currently in clinical use or on the verge of entering that field [16–22].
Investigating molecular vibrations is an essential component of vibrational spectroscopy methods, such as Fourier transform infrared (FTIR). An overview of the vibrational spectroscopic methods used in breath analysis during the past few years is given in this article. Future uses of the sophisticated spectroscopic methods will also be emphasized. The review’s findings demonstrate that FTIR spectroscopy offers label-free, noninvasive bacterial detection, identification, and antibiotic susceptibility testing in a single step, making it a promising substitute for traditional diagnostic techniques. To improve patient care and diagnostics, reduce the use of unnecessary antimicrobial drugs, avoid resistant microorganisms, and lessen the overall burden of outbreaks, quick, accurate, and affordable tests are required.
The difficulty of showing the association between detected marker molecules and pathology is one of the main disadvantages of diagnostic breath analysis since, in the majority of situations, certain metabolic pathways are unknown. Sampling is a crucial step since substance concentrations in exhaled air vary depending on the circumstances and are frequently at a trace level [23]. A great alternative technique for detecting chemicals at the trace level with high sensitivity and molecular selectivity is mid-infrared (MIR) spectroscopy. MIR spectroscopy looks more suited to integration and miniaturization than GC-MS (gas chromatography-mass spectrometry), which suggests well for near real-time analysis assessing highly discriminative vibrational and rotational molecular signatures—two crucial advantages for routine clinical applications [24, 25].
In human breath, nitrogen (N2—about 70%), oxygen (O2—about 21%), water (H2O—less 5.2%), and carbon dioxide (CO2—4–6%) are the most prevalent matrix components [26–28]. At this, we can add about 3,500 distinct VOCs identified using GC and MS in a study of breath samples from fifty healthy people [29]. More than 1,000 components are present in EB at trace levels, at ppm or ppt levels, and several of these substances may be biomarkers for particular illnesses, physiological states, or the effectiveness of treatment. Some substances found in EB have been thoroughly investigated, and their connections to various disease pathologies have been identified. However, because these biomarkers are often found at low levels below the ppb (v/v) range of EB, molecularly precise identification of these biomarkers in EB at clinically significant levels remains a practical and analytical problem. MIR spectroscopy and sensing techniques need to be significantly improved to be a viable option for breath analyzers that may be used in clinical settings. Thus, when a person transitions from a healthy to a diseased condition, a slight but significant change in the VOC spectrum (in concentration and composition) is seen; this phenomenon is called breath metabolomics (breathomics) [30]. This change can be recognized and used for diagnosis and monitoring.
Infrared spectroscopy’s biggest challenge for analyzing biological samples is the high concentration of water vapor in gaseous biofluids. For instance, a healthy person’s breath sample normally comprises 5–7% water vapor [29]. There are several methods for breath analysis, but this review will cover only some of the most recent applications, published between 2020 and 2024, that use infrared spectroscopy.
Breath analysis selected applications
Two significant obstacles must be overcome to create breath diagnostic instruments based on infrared spectroscopy. First off, a major barrier to using infrared spectroscopy in breath is the high water [31] content of an EB sample. A significant (factor of 2,500) decrease in water vapor from the EB sample at –60°C has been made possible by the recent development of a water suppression approach from gaseous biofluids [32]. A hierarchical correction process was suggested to carry out the baseline corrections [33]. There are some other reviews related to breath analysis using infrared spectroscopy, published in the period under the study [34–36].
Water removal from the sample without altering the constituent molecules is the primary benefit of breath analysis utilizing infrared spectroscopy over tissue or liquid-phase biological samples. Recently, a very effective method for removing water was created and published [37]. A typical water-suppressed breath spectra of a healthy volunteer is presented in Figure 1.
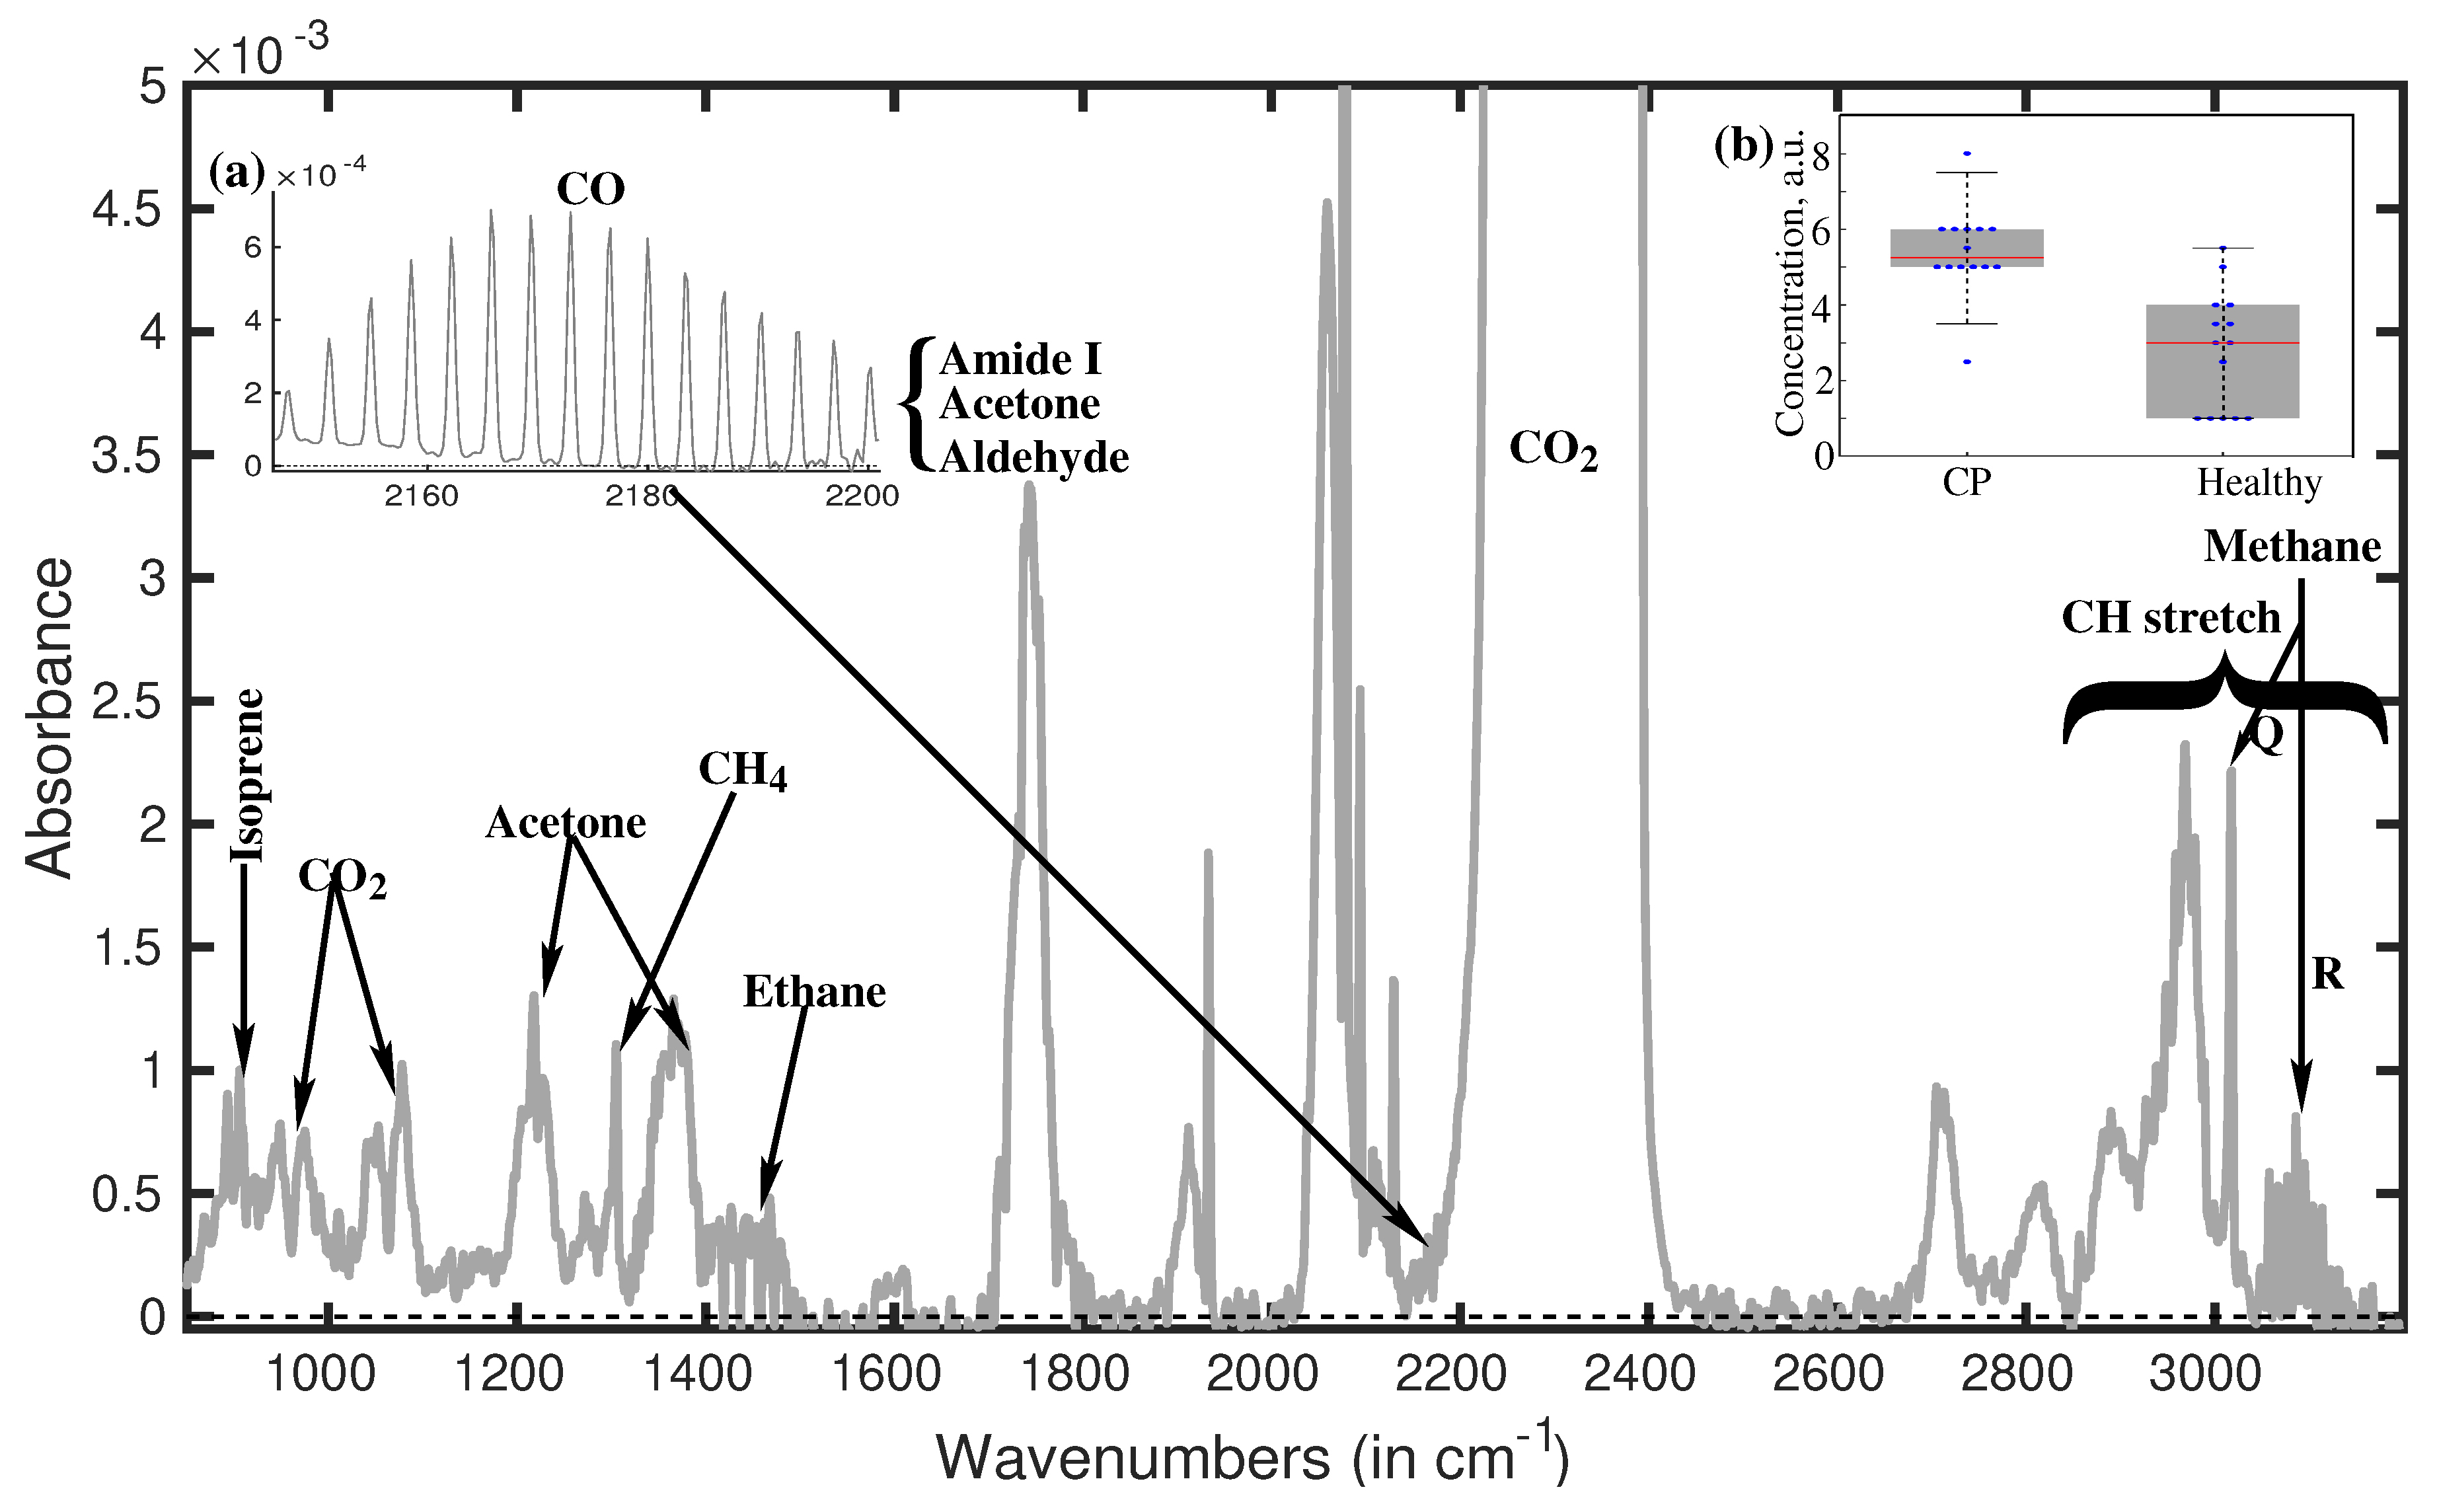
A typical water-suppressed breath spectrum [32]. The inset of (a) displays in detail the peaks situated at around 2,180 cm–1 being characteristics for amide I, aldehyde, acetone, and CO. The inset of (b) displays the peak’s strength at 1,189 cm–1 for the two volunteer groups. Through statistical analysis using the two spectral features stated above, we were able to discriminate between the individuals in the groups with an accuracy of over 90%. CP: cerebral palsy
Note. Reprinted with permission from [32], © 2019 the authors (CC BY 4.0)
Generally speaking, CH stretch vibrational absorptions are present in the spectral range (2,800–3,200 cm–1) [38]. Since the CH bond is a property of biological molecules, all biological compounds exhibit a high concentration of CH absorption peaks in this spectral region, making them appear as highly crowded spectral features. Consequently, it is almost hard to use fingerprints to identify individual molecules in the CH stretch vibrational range. But a distinct spectral characteristic at about 3,100 cm–1 is recognized as the R branch of methane. While methane’s P branch is obscured by other molecules’ large CH absorption spectra, a very strong Q branch is visible at 3,020 cm–1. Since the spectral signatures in this spectral area (900–1,800 cm–1) are exclusive to each molecule and comparatively less crowded, molecular fingerprinting is a simpler method of identifying the molecules. For instance, isoprene is remarkable in that it has twin peaks at about 900 cm–1. Isoprene is present in the breath sample, as indicated by the double peaks at 893 cm–1 and 906 cm–1. The peak measured at 1,220 cm–1 is unmistakably an acetone signature. But the peak at 1,375 cm–1, which is also an acetone fingerprint, is far stronger than it ought to be. Consequently, the formation of this spectral characteristic must be the result of many molecules being absorbed. Acetaldehyde was found as the second molecule. Due to the absorption of acetone, acetaldehyde, and a few tiny molecules with amide bands, a very strong absorption is seen at 1,750 cm–1.
Evidence of detectable VOCs in breath linked to lung and breast cancer has been established by researchers. Finding every factor affecting the number of VOCs in exhaled air has piqued the curiosity of the scientific community. It has concentrated on standardizing the breath sample and analysis methodology in this context. Rapid and non-invasive diagnosis of several illnesses, including diabetes and cancer, may be possible with breath analysis [39].
Normal human subjects’ breath has been found to include a variety of chemicals, although it is typically unknown what metabolic pathways these molecules originate from. Certain chemicals have been linked to increased amounts in ovulation, diabetes, cirrhosis, renal disease, and cancer. Yet, many other illnesses have not yet been investigated in this light.
VOC analysis can reveal important details about a person’s health, particularly concerning several illnesses. As a result, it can be applied to the early detection of numerous illnesses, even at the initiation [40]. The primary benefits of breath analysis over other tests currently used to investigate diseases are that it is completely non-invasive, sampling is simple, there are essentially no restrictions on sample size or source, results are available quickly, objective diagnoses can be made using AI/ML (artificial intelligence/machine learning) methods, requires only reasonably priced equipment, and can be performed by trained technicians without the need for medical professionals.
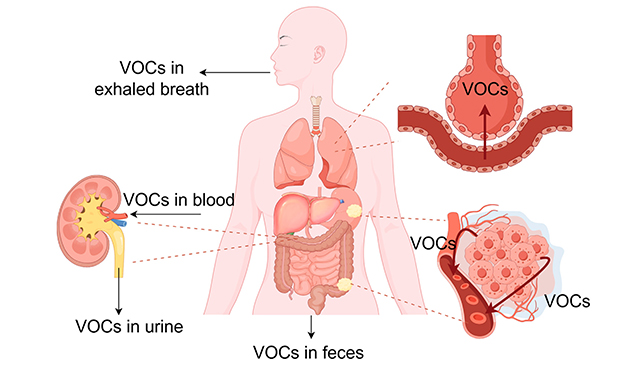
Figure 2 presents the distribution of VOCs from gastrointestinal tumor tissues to parts around the body. The cancer-related volatile organic compounds, produced as a result of metabolic alteration in cancer tissues, diffuse into the blood and are carried by the bloodstream to other parts of the body. They cross the alveolocapillary barrier and enter exhaled breath [41].
A higher degree of physical, emotional, and financial well-being for society is achieved through early diagnosis of diseases like various cancers, resulting in more effective therapy and quicker recovery. This allows for significant cost savings in medical care and prevents the loss of human resources. Non-communicable diseases like cancers of internal organs (ovarian, liver, pancreatic, etc.), cardiovascular diseases, and communicable diseases of pathogenic origins (like COVID-19) that make up the majority of the health care burden require effective techniques that can detect them early through cost-effective, noninvasive, universally applicable—that is, affordable, acceptable, and available—diagnostic methods [42].
For neonates’ long-term development, it is essential to monitor their health status to provide early therapeutic intervention if physiological circumstances deviate [43, 44]. Preterm newborns require extra caution in physical and neurological diagnostic procedures because of their immaturity. These should ideally be radiation-free, noninvasive, and noncontact. As a noninvasive, noncontact, and radiation-free diagnostic method, EB from 71 neonates—with a focus on preterm infants—was analyzed using infrared spectroscopy [45]. For instance, the risk of cerebral palsy (CP) or other neurological problems is negatively correlated with gestational age (GA); the earlier a child is born, the greater the chance of neurological impairment [46]. It was hypothesized that infrared spectroscopy for breath biomarker analysis could contribute to neonatal health monitoring, providing a feasible means of collecting an adequate quantity of EB.
In Figure 3, the infrared absorption spectra of ambient air, incubator air (containing a neonate), exhaled air from a neonate with spontaneous (S) respiration, and input and outlet air of a CPAP (Continuous Positive Airway Pressure) system are displayed. Spectra are focused around the carbon dioxide absorption spectra.
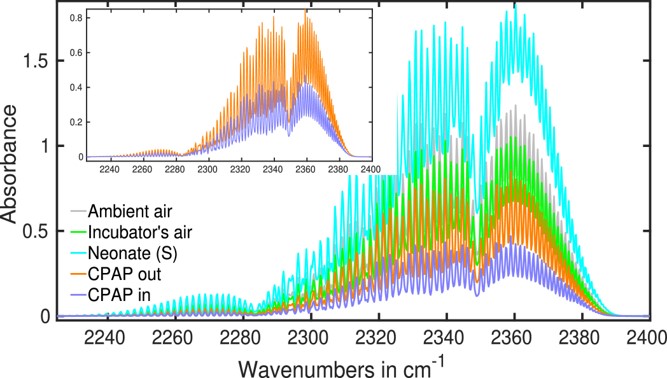
Studying the obtained spectra, it was concluded that the most prominent CO2 infrared absorption peak is usually seen at about 2,350 cm−1, whereas the CO peak is found at 2,170 cm−1. The atmosphere contains several greenhouse gases, including methane. Each person inhales methane from the surrounding air during inhalation, and an equivalent amount is anticipated in EB.
The main cause of periodontitis is the gram-negative anaerobic bacillus Porphyromonas gingivalis (P. gingivalis). The infrared absorption spectra of the gases released by the cultured bacteria were recorded at a resolution of 0.5 cm–1 within the wavenumber range of 500–7,500 cm–1 using strains of oral bacteria that were cultivated, such as P. gingivalis and the oral commensal bacteria Actinomyces viscosus and Streptococcus mutans [47]. A decision tree-based ML technique was used to extract the infrared wavenumbers from these spectra, corresponding to distinctive absorptions in the gasses that P. gingivalis emitted. Lastly, peaks at comparable locations in the P. gingivalis gases, NH3, and CO spectra were found when the resulting absorbance spectra of NH3 and CO were compared using the HITRAN (High-Resolution Transmission Molecular Absorption) database. This technique offers an efficient way to identify P. gingivalis in oral bacteria by differentiating its gases from those of other oral bacteria. The suggested approach may prove useful as a straightforward, noninvasive pathogen diagnosis method in clinical settings.
Alcohol enters the small intestine and stomach when it is consumed. After being absorbed into the blood, it travels throughout the body and into the lungs and brain. Breathing causes it to be exhaled. For quantitative analysis and ethanol identification several reviews were published in this period [17, 48–51], and the majority of breath-alcohol instruments currently in use for evidence use infrared spectrometry as the analytical principle [52]. A common quick test for excessive alcohol use in forensic science and legal medicine is the measurement of ethanol in EB. To maintain sobriety in individuals suspected of driving while intoxicated, police officers employ breath analyzers. A recent paper discusses the physiological underpinnings, historical evolution, and real-world uses of breathalyzers in legal medicine and forensic research [53]. However, several nations chose to employ different BBRs (blood-breath ratios), which varied from 2,000:1 to 2,400:1, when calculating statutory BrAC (breath-alcohol concentration) limitations [54].
Because of the global pandemic caused by COVID-19, early detection techniques are desperately needed. Breath analysis has demonstrated significant promise as a quick and non-invasive method of COVID-19 detection [55–57]. FTIR [58] was one of the techniques utilized recently to analyze exhaled air or EBC to detect COVID-19. Figure 4 presents the FTIR spectra for a breath infrared analysis of patients with COVID-19 virus infection.
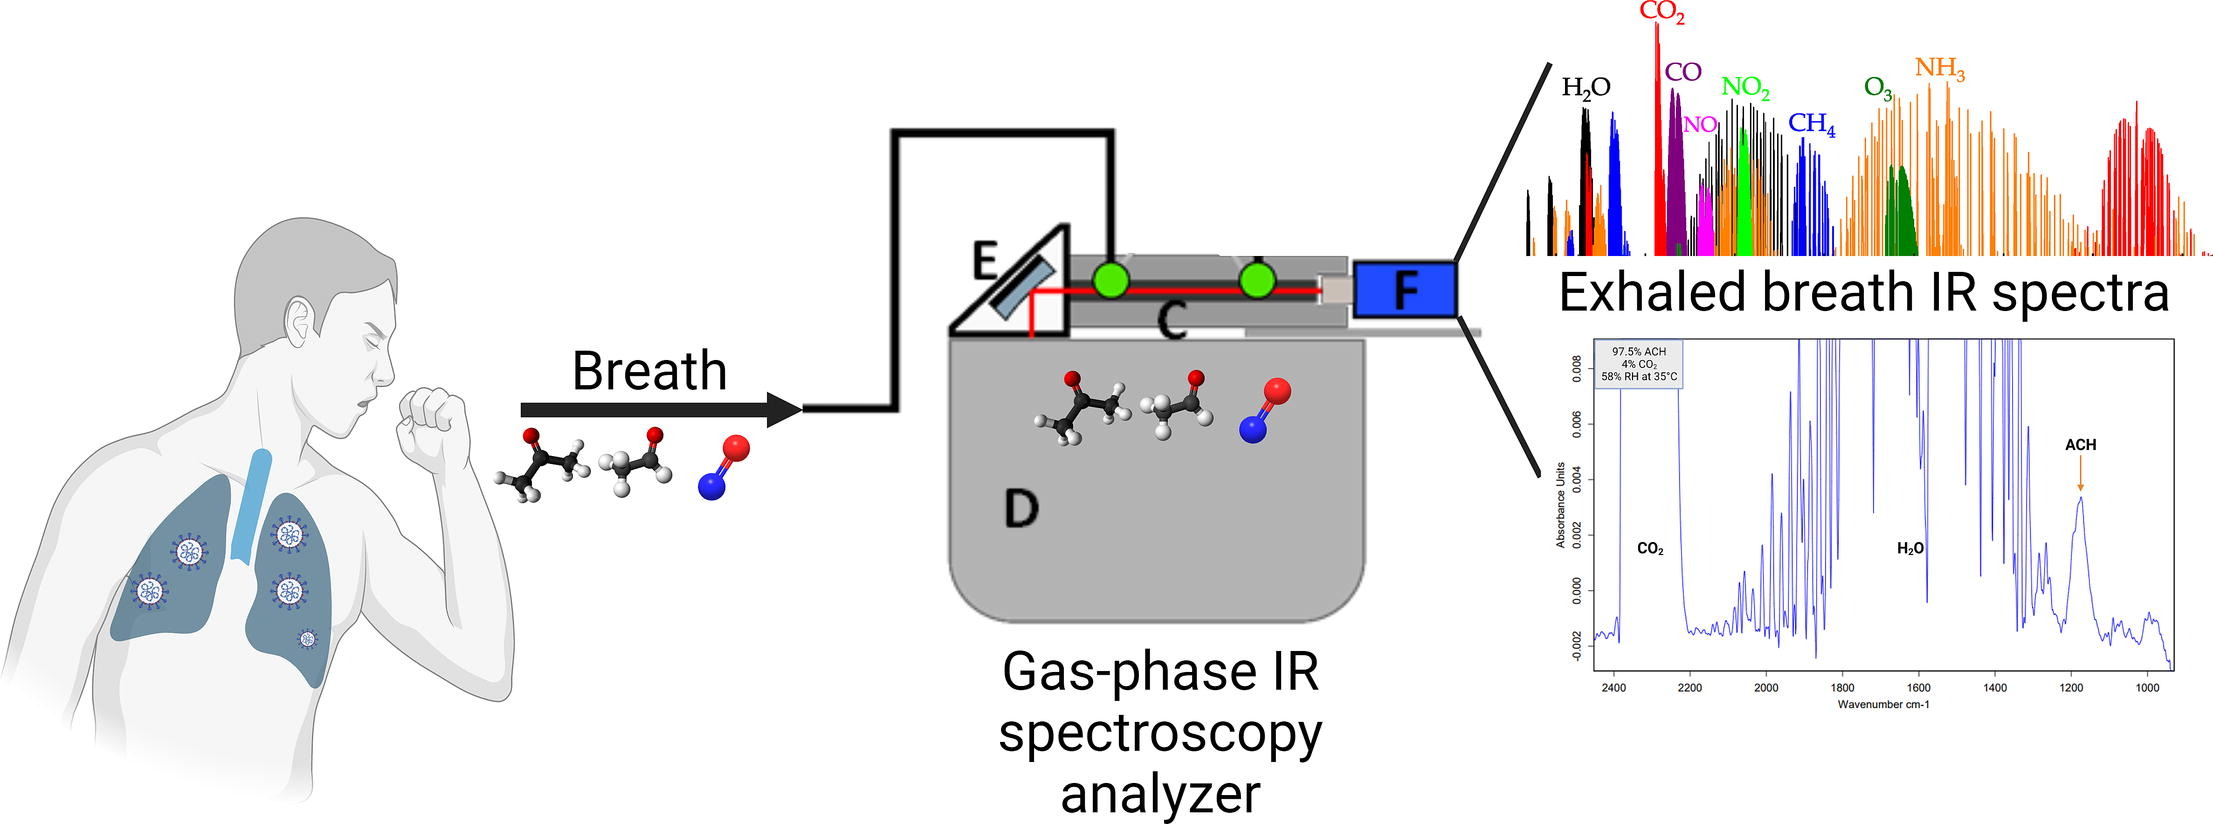
The FTIR spectra for a breath infrared analysis of patients with COVID-19 virus infection. FTIR: Fourier transform infrared; IR: infrared
Note. Reprinted with permission from [59], © 2023 Elsevier B.V.
The experimental setup schematically presented in Figure 4, contains a 14 cm long substrate-integrated hollow waveguide (iHWG) (C) containing a 12.5 cm light guiding channel with a quadratic cross-section of 4 mm, which was closed on both sides with infrared transparent zinc selenide windows. As a light source, a Bruker Alpha II (Bruker Optics GmbH, Ettlingen, Germany) FTIR spectrometer (D) was used. The infrared light was directed by a 1″ off-axis parabolic mirror (OAPM) (E) and focused onto the gas channel of the iHWG. After interaction with the molecules in the light pathway, the infrared signal was sensed by the infrared detector (MIP-10–1 M–F–M4, VIGO Systems S.A., Poznanska, Poland) (F).
It was demonstrated that a unique approach of using a panel of thirty-four carbonyl compounds detected in all EB samples for detection of COVID-19 can be used for differentiation of the Alpha from Delta variant and detection of asymptomatic COVID-19 infection [60]. Carbonyls are an organic molecule class derived from lipid oxidation [61] and are essential for many biological processes, including oxidative stress and inflammation, which are dramatically triggered by SARS-CoV-2 infection [62].
The most often detected VOCs in the EB of people infected with COVID-19 include nitric oxide, alcohols, aldehydes, and ketones [59]. As for acetaldehyde, a recent investigation using GC-MS found that patients with COVID-19 had simultaneous increases in acetaldehyde and acetone in their EB [63]. Additionally, acetaldehyde, propanal, and n-propyl acetate abundances in the EB of children infected with COVID-19 were found to rise during acute infection and fall as the illness subsided, according to another study [64].
Identifying chemical components in exhaled human breath offers a chance to evaluate environmental exposure, diagnose illness, or ascertain physiological conditions. Metabolic profiles can be obtained from a range of biological sample types, which can be collected non-invasively (such as feces, urine, sputum, or breath) or invasively (such as blood, serum, or tissue biopsies) [65].
EB is the perfect biological fluid because it is nearly limitless and causes little discomfort for the patient, promoting collaboration. Breath analysis is a desirable method for a variety of applications since EB can be sampled without requiring privacy or medical professionals, and it usually does not produce infectious waste (despite airborne pathogens) [66].
Early cancer detection is one of the most important factors in saving many lives. In this way, there are several reviews related to cancer screening using breath analysis [67–69]. Tragically, it might be challenging to identify urogenital malignancies early on. Even at advanced stages, the accuracy of current noninvasive prostate cancer (PCa) diagnoses is limited (less than 70%) [70].
Figure 5 presents the spectral range, centered at 1,005 cm−1, that differentiates healthy patients from different cancer groups, including kidney cancer (KC), PCa, and bladder cancer (BC), due to the presence of acetic anhydride (AA) in EB.
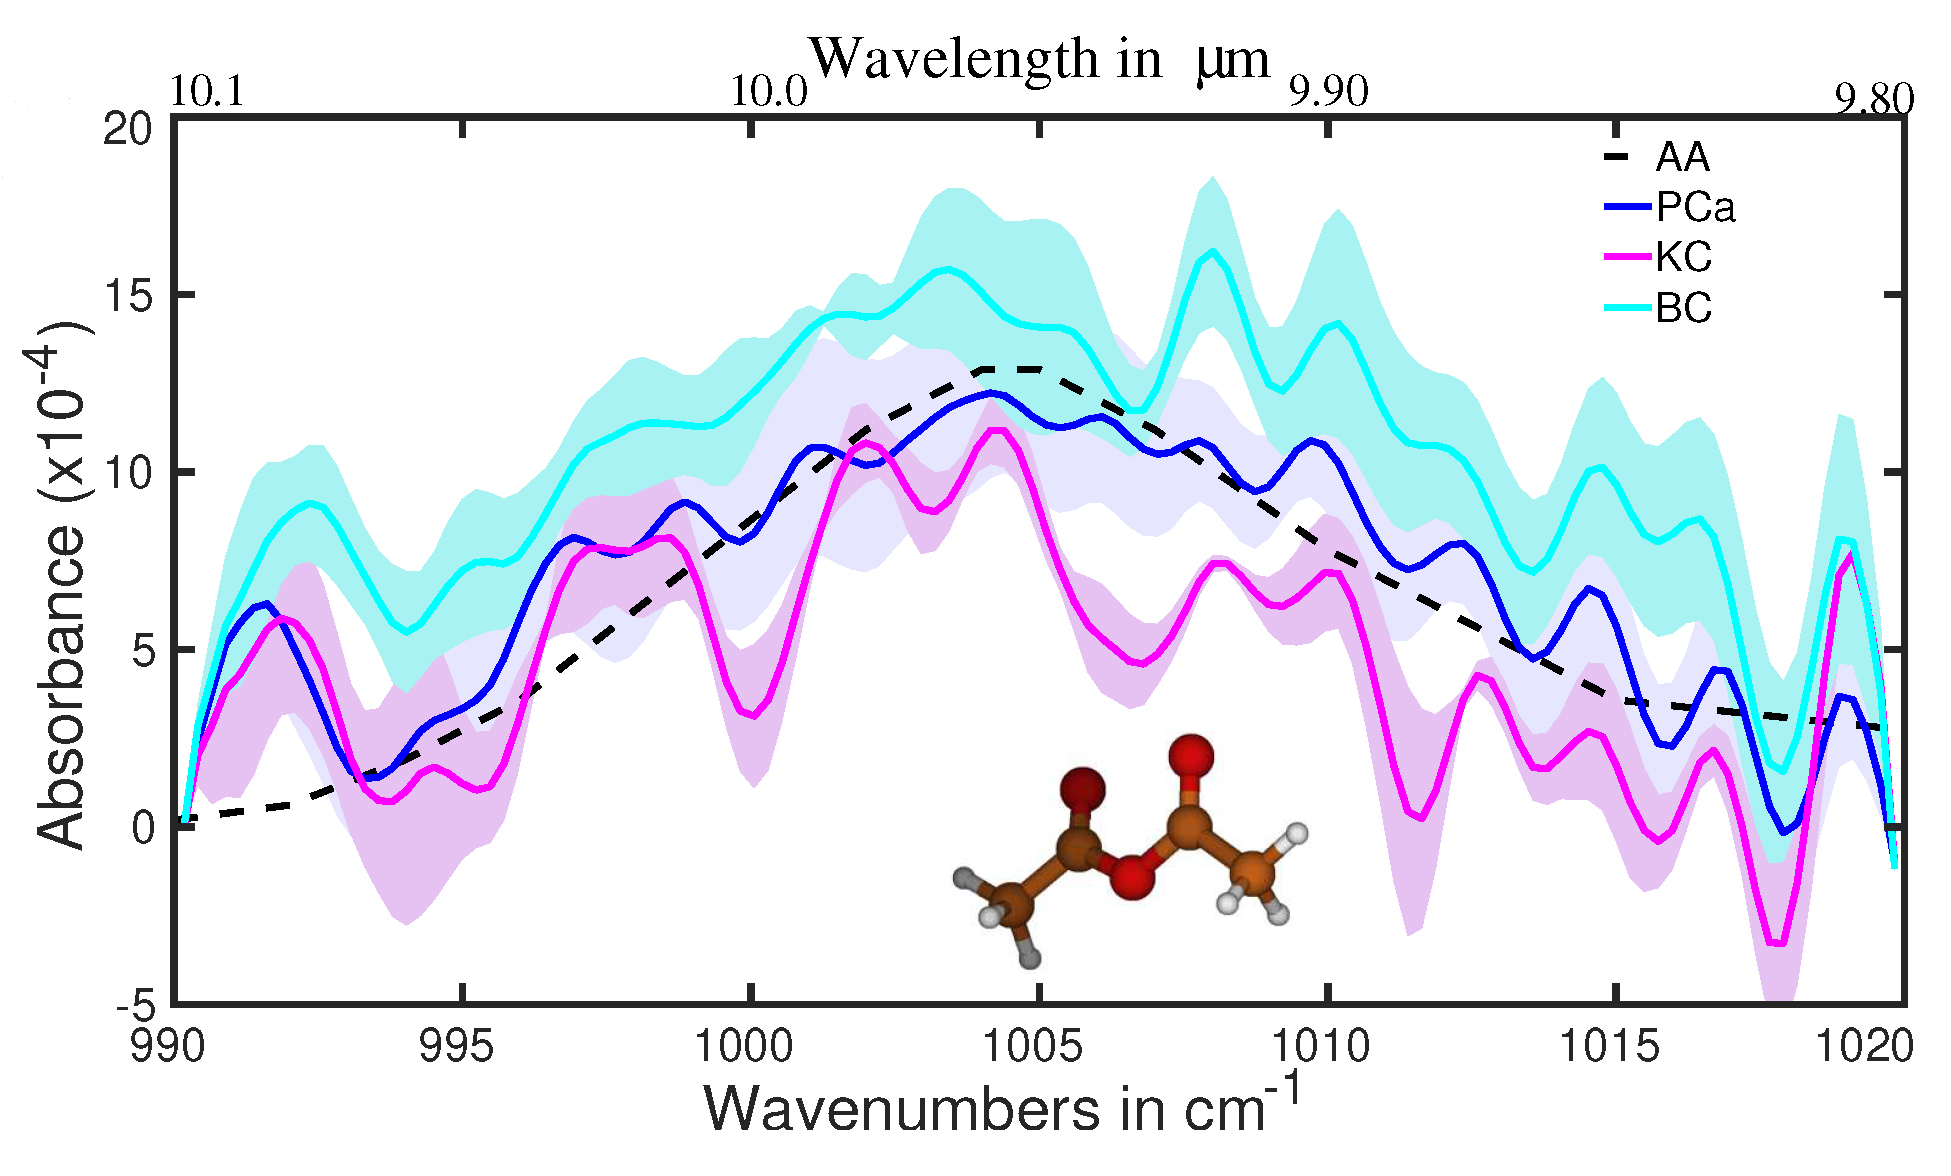
The average absorption spectra for healthy and different cancer groups [71]. Oscillations visible for the range > 1,010 cm−1 (especially at 1,015, 1,019, and 992 cm−1) are due to the contribution of CO2 [72]. AA: acetic anhydride; BC: bladder cancer; KC: kidney cancer; PCa: prostate cancer
Note. Adapted with permission from [71], © 2023 the authors (CC BY 4.0)
Although AA is not an end product, it can only remain in the body for a few minutes before converting to acetic acid through a reaction with water or other products through acetylation. Now, let’s note that MS, the most practical approach for analyzing metabolites in gas and liquid phases, was not previously used to detect AA in patient biofluids. First, ten molecules with a molecular mass of 102.09 amu and the formula C4H6O3 are identical. These chemicals can be easily distinguished using MIR spectroscopy, which we used in the fingerprint region, but they are difficult to differentiate using GC-MS. The identification process is further complicated by the fact that, in addition to those 10, there are several molecules whose molecular mass differences are less than 0.1%. The FTIR method is better suited for light volatile metabolites in gaseous and liquid phases than the GC method, which is better suited for heavier ones.
The sensitivity and specificity of > 95% offer an excellent scenario for early cancer detection. A further reason in favor of this confidence is the patient who was diagnosed with cancer but did not have the original tumor (i.e., T0; following resection during the biopsy, with additional surgery). The methods used here must be changed to show early (pre-symptomatic) cancer detection. The prognosis is very bad for lung cancer patients who have malignant pleural effusion (MPE). Making the distinction between MPE and benign pleural effusion (BPE) is essential. Based on FTIR near-infrared spectroscopy (NIRS) in conjunction with an ML approach, a recent study attempts to create a quick, practical, and affordable diagnostic tool for classifying clinical pleural effusions [73]. Figure 6 presents the average NIR spectra for MPE (red) and BPE (blue) samples.
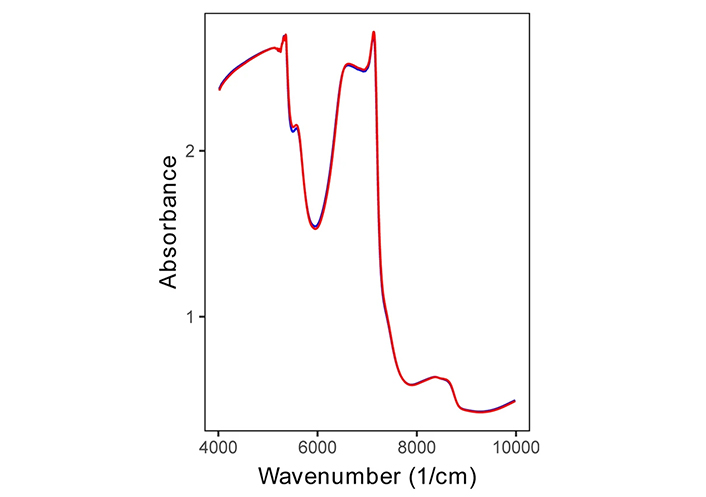
Even so, the NIR spectra provide a wealth of information about the chemical makeup of the pleural effusion, even in the absence of feature peaks. The first overtone of CH is indicated by wavenumbers between 4,200 and 5,500 cm−1, the first overtone of OH, NH, and CH is indicated by wavenumbers between 5,400 and 6,100 cm−1, wavenumbers between 6,200 and 7,600 cm−1 indicate the first overtone of CH, and wavelengths between 7,900 and 9,000 cm−1 indicate the second overtone of CH. Wavelengths of 6,200 to 7,600 cm−1 were used to indicate NH and CH combinations, whereas wavelengths of 7,900 to 9,000 cm−1 were used to indicate the second overtone of CH [73, 74].
This is the first study to use NIRS for pleural effusion categorization. MPE typically denotes advanced cancer growth, which helps create a distinct malignant microenvironment that differs greatly from the surrounding healthy tissues and has different metabolites, such as proteins and lipids [74–76]. According to some other results, the IR-CRDS (infrared cavity ring-down spectroscopy) classification of alveolar breath is a potentially effective method for breast cancer screening [77].
Conclusions
The primary benefits of breath analysis over other tests currently used to investigate diseases are that it is non-invasive, sampling is relatively simple, results are available quickly, objective diagnoses can be made using AI/ML methods that require only relatively inexpensive equipment, and trained technicians can perform the test without the assistance of medical professionals such as radiologists, pathologists, oncologists, etc., particularly for preliminary screening of susceptible subjects (smokers, females over a certain age group, etc.).
Early disease identification, such as that of many types of cancer, results in more effective treatment and quicker recovery, which allows for significant cost savings in healthcare and prevents the loss of human resources. It also raises the standard of physical, emotional, and financial well-being in society. Non-communicable diseases, such as cancers of the internal organs (ovarian, liver, pancreatic, etc.), cardiovascular conditions, and communicable diseases of pathogenic origin (like COVID-19), which make up the majority of healthcare costs, require dependable methods that can identify them early using noninvasive, cost-effective, and universally applicable—that is, accessible, affordable, and acceptable—diagnostic techniques.
Breath analysis is not yet a diagnostic tool that clinicians may use, despite several VOC-based detection methods being available and considerable efforts. Given the tens of VOCs found in breath, infrared absorption spectroscopy is a promising method to close this gap.
Abbreviations
| AA: | acetic anhydride |
| AI/ML: | artificial intelligence/machine learning |
| BPE: | benign pleural effusion |
| EB: | exhaled breath |
| EBC: | exhaled breath condensate |
| FTIR: | Fourier transform infrared |
| GC-MS: | gas chromatography-mass spectrometry |
| iHWG: | integrated hollow waveguide |
| MIR: | mid-infrared |
| MPE: | malignant pleural effusions |
| NIRS: | near-infrared spectroscopy |
| PCa: | prostate cancer |
| VOCs: | volatile organic compounds |
Declarations
Author contributions
AAB: Conceptualization, Methodology, Formal analysis, Writing—original draft. HYAE: Data curation, Supervision, Writing—review & editing.
Conflicts of interest
Not applicable.
Ethical approval
Not applicable.
Consent to participate
Not applicable.
Consent to publication
Not applicable.
Availability of data and materials
Not applicable.
Funding
Not applicable.
Copyright
© The Author(s) 2025.
Publisher’s note
Open Exploration maintains a neutral stance on jurisdictional claims in published institutional affiliations and maps. All opinions expressed in this article are the personal views of the author(s) and do not represent the stance of the editorial team or the publisher.