Original Article

Affiliation:
1Department of Physical Therapy and Rehabilitation Science, University of Iowa, Iowa City, IA 52242, USA
Email: laura-freylaw@uiowa.edu
ORCID: https://orcid.org/0000-0002-3574-3715
Affiliation:
2Military Operational Medicine Research Program, United States Army Medical Research and Development Command, Fort Detrick, MD 21702, USA
ORCID: https://orcid.org/0000-0003-0848-3628
Affiliation:
1Department of Physical Therapy and Rehabilitation Science, University of Iowa, Iowa City, IA 52242, USA
ORCID: https://orcid.org/0000-0002-1239-7530
Affiliation:
1Department of Physical Therapy and Rehabilitation Science, University of Iowa, Iowa City, IA 52242, USA
ORCID: https://orcid.org/0000-0003-0207-8728
Explor Musculoskeletal Dis. 2024;2:408–422 DOI: https://doi.org/10.37349/emd.2024.00066
Received: April 26, 2024 Accepted: July 23, 2024 Published: September 13, 2024
Academic Editor: Fernando Pérez-Ruiz, Cruces University Hospital, Spain
Aim: Physical activity (PA) is increasingly used as a patient-centered means to treat and/or cope with pain and other symptomology resulting from clinical health conditions. Despite the increasing use of wearable sensors to track PA in healthy and patient cohorts, few algorithms are equally accurate in assessing sedentary and light PA as moderate and vigorous. Given that many older adults and patient cohorts are less active, there is a need for simple algorithms that are easily implemented and valid for the assessment of even low activity levels. Thus, the purpose of this study was to test a simple nonlinear modification to a validated linear algorithm for hip- and wrist-worn accelerometry to measure human PA energy expenditure.
Methods: Triaxial accelerometers were worn on the wrist and hip during 14 standardized laboratory-based activities in 37 healthy adults across the lifespan [19–65 years, 19 females (F)]. Combined with previously reported energy expenditure data, linear and power equations transforming accelerations to estimates of oxygen consumption (VO2) were compared.
Results: The nonlinear algorithm provided equally accurate measures of PA energy expenditure as linear approaches, with the added advantage of being able to estimate even low energy expenditure, a necessary outcome to differentiate sedentary and light PA. Further, the nonlinear algorithm produced a slightly better estimate of PA when using wrist than hip accelerometry.
Conclusions: A simple nonlinear algorithm provides a better means for monitoring PA in populations with low activity levels due to its improved ability to discern sedentary from light PA. This is particularly relevant for older and clinical populations as even light levels of PA may provide therapeutic benefits.
Despite the mounting evidence supporting the value of regular physical activity (PA), anywhere from 56% to 96% of adults do not meet the 2018 Physical Activity Guidelines for Americans of 150 minutes of moderate PA per week [1–4]. In some populations, such as those with clinical conditions or older adults, even fewer are routinely achieving 150 minutes of moderate-to-vigorous PA [5–7]. Independent of meeting physical activity guidelines, sedentary time is also a risk factor for poorer health outcomes [8]. The health benefits of regular light PA and/or reducing sedentary time across a wide range of populations have been postulated and supported by strong evidence across a range of populations [5, 9, 10]. Thus, effective means to differentiate sedentary, light, moderate, and vigorous PA are needed.
Objective measures of PA have gained popularity and acceptance in commercial and more recently, healthcare domains [11–13], providing some advantages over the traditional self-report methodologies. However, while activity measurement has been validated in numerous studies, largely in young adults [2, 14–21], there remain considerable variations in the algorithms used to estimate energy expenditure from triaxial acceleration signals [22, 23] with relatively few parsimonious wrist-based algorithms to choose from.
Older approaches to estimating PA from hip-worn accelerometry found the relationship between activity “counts” and activity intensity often depended on the type and intensity of the activity itself. In fact, the use of “Crouter equations” involved the use of two linear equations to fit what is essentially a nonlinear relationship [16]. In response, multiple complex machine learning and random forest approaches have been developed [21], yet without clear or consistent improvements in energy expenditure estimates over more simple algorithms [23]. Advances in PA measurement have moved away from the use of “counts”, which are often ill-defined and can vary from device to device, towards the use of raw accelerations to extract mean and variance of accelerations per unit time, such as that proposed by Hildebrand et al. [19]. However, the linear nature of the Hildebrand approach makes it unable to differentiate sedentary from light activity, as the algorithm intercept produces a minimum or floor energy expenditure estimate of approximately 2 metabolic equivalents (METs). To address this limitation, a follow-up study identified 45 milli g/minute (mg/min) as a cut-off for classifying sedentary behavior that can be applied separately [24]. While this is an improvement, it is not fully able to address the inherent nonlinearities observed. For example, using their linear algorithm, the 45 mg/min cut-off is equivalent to 2.49 METs. Thus, when this correction is applied, the linear algorithm is incapable of identifying any light activity in the range from 1.6 METs to 2.48 METs. This level of PA translates to energy expenditure levels expected for many activities of daily living (ADLs) and slow walking [25, 26], common types of activities for many patient cohorts [27].
Traditionally, hip-worn accelerometers were commonplace with numerous algorithms proposed and validated in the literature. However, wrist-worn devices are increasingly popular due to improved compliance and ease of use [20]. Indeed, there has been a substantial increase in consumer-based activity monitoring devices worn on the wrist [28]. However, studies have demonstrated that algorithms to estimate PA levels typically differ between hip and wrist-worn measurements [20], with wrist accelerations often higher than hip for the same activities [19].
While the linear Hildebrand approach produced the most consistent estimates of moderate to vigorous PA (MVPA) relative to a validated hip measure of activity out of several different algorithms, its inability to detect a region of light PA is a substantial barrier to its use in both healthy and clinical populations [29]. Nonlinearities in the relationships between acceleration outcomes and energy expenditure are often reported (despite the use of linear regression [16, 19]). We hypothesized that a modified Hildebrand approach, using a nonlinear algorithm, could resolve this problem and eliminate the need to apply a separate cut-off to differentiate sedentary from light behavior, while maintaining the accuracy in estimating MVPA. Thus, the primary purpose of this study was to test this hypothesis using mean raw acceleration signals measured at the wrist and the hip in healthy adults across the lifespan performing a range of different controlled laboratory tasks from sedentary to vigorous intensity. These findings would then provide the needed validation as a basis for its use in patient cohorts, who may be expected to have generally lower levels of PA. Secondarily we aimed to compare hip and wrist accelerations across activities to investigate if a simple transformation may be applicable between wear locations and to explore whether this may be applicable for improving comparisons across methodologies.
A combination of previously reported [19] and newly collected accelerometry data, with their corresponding measured or estimated oxygen consumption (VO2), were best fit to linear and nonlinear equations. To supplement the previously reported laboratory tasks, additional data involving a wider range of task intensities, particularly higher intensity tasks, were collected. The process of collecting and extracting the data, fitting the parameter values for each model, and the statistical comparisons to assess these models are outlined below.
A total of 37 [18 males (M), 19 females (F)] healthy, non-smoking adults were recruited to participate in this single-visit study. Exclusion criteria included elevated blood pressure (> 140/90 mmHg), or a history of any medical condition that would place them at increased medical risk to perform exercise. All participants provided written informed consent as approved by the University of Iowa Biomedical Institutional Review Board prior to participating in this observational study. After providing consent, participants completed activity and demographic surveys to characterize the population, including general perceived global health and the Rapid Assessment of Physical Activity (RAPA). Height (m) and weight (kg) were assessed and used to determine body mass index (BMI), and body composition was assessed using a bioimpedance scale (Tanita TBF-300A). Study data were collected and managed using Research Electronic Data Capture (REDCap) tools [30].
See Table 1 for summary characteristics of the study cohort. The ages ranged from 19–65 years [mean 37.1, standard deviation (SD) 14.5]. Sex differences were assessed using t-tests, or Chi-square tests as appropriate, without adjustment for multiple comparisons. Only BMI differed significantly between men and women (t35 = 2.5, p = 0.02) (Table 1), where men had higher BMI on average, yet body fat (%) was not different between the sexes (t35 = 1.9, p = 0.07).
Mean (SD) of demographic characteristics of the study population
| Demographic characteristics | All(n = 37) | Males(n = 18) | Females(n = 19) | Sex differencep-value |
|---|---|---|---|---|
| Age (yrs) | 37.1 (14.5) | 35.4 (13.3) | 38.7 (15.8) | 0.50 |
| BMI (kg/m2) | 23.7 (4.2) | 25.3 (4.4) | 22.1 (3.3) | 0.02 |
| Body fat (%) | 22.2 (8.0) | 19.7 (7.6) | 24.6 (5.9) | 0.07 |
| RAPA (1–7 scale) | 6.0 (1.4) | 6.3 (1.6) | 6.3 (7.9) | 0.31 |
| n (%) Caucasian | 35 (94.6%) | 17 (94.4%) | 18 (94.7%) | 0.97 |
| n (%) Reporting good or excellent health | 35 (94.6%) | 16 (88.9%) | 19 (100.0%) | 0.23 |
SD: standard deviation; BMI: body mass index; RAPA: Rapid Assessment of Physical Activity
Each subject completed a series of controlled tasks, representing everyday activities while wearing two ActiGraph™ wGT3X-BT ± 8g triaxial accelerometers (ActiGraph LLC, Pensacola, FL) worn on the non-dominant wrist and ipsilateral hip. The hip accelerometer failed to collect data for one female subject. Therefore, only 36 participants (18 M, 18 F) were included in the analyses involving hip data points. Each of the tasks assessed in the battery of standardized activities lasted 3 minutes (see Table 2 for task descriptions) including each level of the modified Bruce protocol (MBP), monitored with a stopwatch. The only deviations from this 3-minute duration occurred for: stair climbing ascending 7 flights of stairs and descending 7 flights of stairs, which lasted only 1–2 min each for most individuals; and over-ground walking, which involved walking a prescribed distance (350 m, 3–4.5 min). Only the first 5 stages of the MBP were assessed as higher stages rely on both increased incline and speed (see Table 2). The test was stopped if the heart rate reached 85% of the predicted maximum, following standard guidelines as previously described [31]. Additionally, treadmill walking, jogging, and running tasks were performed after the Bruce protocol at 0% incline. Individuals were given the choice of the two running tasks to choose from the 2–3 velocity options indicated (see Table 2). This was to allow for the collection of more intense activity data points recognizing not all individuals are equally capable of achieving or maintaining these running speeds. A brief rest of at least 2 min was provided between each activity, apart from the MBP stages which were performed consecutively. If requested, or if participants’ heart rate had not recovered to < 100 beats/min, additional time was allowed before starting the subsequent task. For all tasks, participants were monitored to ensure they tolerated the activity level without problem (e.g., subjective report, diaphoresis, excessive shortness of breath). Note that the study procedures did not involve any health-related interventions, nor were any biomedical or health-related outcomes assessed. Thus, this observational study did not meet the requirements of a clinical trial per the standard guidelines put forth by the ICJME or World Health Organization (WHO).
Controlled activities performed while wearing hip- and wrist-worn accelerometers
| Order | Task | Description |
|---|---|---|
| 1 | Lying quietly | Laying supine on a plinth |
| 2 | Keyboarding | Type the Declaration of Independence (hard copy provided) in a Word document on a desktop computer |
| 3 | Window washing (simulated) | Whiteboard erasing of a 1.2 × 2.4 m (4 × 8 ft) whiteboard using the dominant hand was used to simulate window washing |
| 4 | Sweeping† | Using a standard broom, participants swept confetti into a pile and then using a dustpan, placed the confetti into a garbage bag |
| 5 | Over-ground walking† | At a self-selected velocity, participants walked 350 m (1,145 ft) through hallways. Mean walking speed was calculated (distance/time) |
| 6 | Ascending stairs | Walked up 7 flights of stairs at a comfortable pace, minimal handrail use. The mean climbing speed calculated |
| 7 | Descending stairs | Walked down 7 flights of stairs at a comfortable pace, with minimal handrail use. The mean descending speed calculated |
| 8 | Modified Bruce protocol (MBP) stages 1–5 | Subjects progressed from Stages 1 through 5 as tolerated without rests; subjects were discouraged from using handrails unless necessaryStage conditions:Stage 1: 2.74 km/h (1.7 mph), 0% inclineStage 2: 2.74 km/h (1.7 mph), 5% inclineStage 3: 2.74 km/h (1.7 mph), 10% inclineStage 4: 4.0 km/h (2.5 mph), 12% inclineStage 5: 5.5 km/h (3.4 mph), 14% incline |
| 9 | Sitting in a chair | Between treadmill activities, sat quietly in a chair |
| 10 | Treadmill walking† | 4.8 km/h (3 mph), 0% incline |
| 11 | Treadmill jogging | 8.0 km/h (5 mph), 0% incline |
| 12 | Treadmill running 1 | Subjects ran at their choice of 9.7, 11.3, or 12.9 km/h (6, 7, or 8 mph) (if they felt comfortable doing so), with 0% incline |
| 13 | Treadmill running 2 | Subjects ran at their choice of 14.5 or 16.1 km/h (9 or 10 mph) (if they felt comfortable doing so), with 0% incline |
†: performed tasks again after 1st 17 tasks in the following order: treadmill walking, followed by overground walking, and lastly sweeping
Acceleration signals were collected at 60 Hz, averaged over each second, and then across each minute using custom MATLAB (MathWorks®, Inc., Natick, MA) software following previously reported methodology [19]. In brief, the Euclidian norm minus one (ENMO) of the triaxial raw acceleration time signals was computed [see Eq. (1)] as the root mean square of the three axes minus 1 g to account for the acceleration due to gravity. Average ENMO accelerations (g/min) for each task were computed for the middle 2.5 minutes of each task for the hip and the wrist sensors, where 1 g (1000 mg) is the acceleration due to gravity, 9.81 m/s2. The minimum ENMO value per minute was set to 0 in the event the ENMO was negative (e.g., small calibration or rounding errors). Due to typically small values, accelerations were also reported in units of mg.
The mean VO2 (mL/kg/min) of each task in the current study was estimated from direct observation coupled with reported norms from the available literature (see Table S1). First, the Compendium of Physical Activities Database was used to compile a list of relevant publications reporting VO2 for comparable activities to gather as comprehensive and representative an estimate as possible across participants, given our approximately equal representation of males, females, young and old adults [25, 26]. From this list, each citation was retrieved, evaluated for task similarity and methodological quality, and relevant VO2 data points were extracted. Mean and SD VO2 values for each task were calculated, and weighted by sample size (Table S1).
Using the approach previously described, we fit acceleration—VO2 relationships for hip- and wrist-worn devices using both linear and nonlinear algorithms [19]. This included previously reported VO2 data measured directly [19] as well as the current data collected for this study. While the mean data from the prior study was processed using the GGIR package, similar final outputs were used in both (mean accelerations/min) and plotted together to ensure they appeared to show good overlap supporting their face validity. Collectively, these data were fit using least squares regression to linear [Eq. (2)] and nonlinear [Eq. (3)] algorithms, weighted by sample size using SPSS (IBM, v 25.0). Thus, both algorithms required only two parameters, a and b, to define the relationships between VO2 and ENMO accelerations using wrist-worn and hip-worn devices.
In addition to reporting energy expenditure in relative VO2 units, METs, are also commonly used. That is, 1 MET typically represents the resting levels of VO2, or 3.5 mL/kg/min. This is useful, as PA is often classified by MET levels as: sedentary (≤ 1.5 METs), light (1.6 to < 3.0 METs), moderate (3.0 to < 6.0 METs), or vigorous (≥ 6.0 METs) [32]. Accordingly, each standardized activity was also classified as sedentary, light, moderate, or vigorous using the estimates generated by the linear and nonlinear algorithms, for both wrist and hip wear locations. Secondarily, we adjusted the linear model classifications using the previously reported acceleration cut-off values of 45 mg/min (wrist) and 47 mg/min (hip) to identify sedentary activities (we refer to as linear-alternate algorithm) [24].
The linear and nonlinear algorithms were assessed based on their coefficient of determination (R2), between measured accelerations and expected VO2 values. To compare the newly fit linear hip and wrist models (i.e., with updated model parameters using additional data collected) to those originally reported, percent differences in VO2 estimates were calculated for typical ranges of acceleration ENMO values: ranging from 0 mg/min to 800 mg/min for hip (0–0.8 g/min) and 0 mg/min to 1400 mg/min for wrist (0–1.4 g/min), in increments of 10 mg.
Comparisons between linear and nonlinear model estimates of energy expenditure were performed to assess for differences in activity classification (sedentary, light, moderate, vigorous) for the newly assessed tasks using Chi-square analyses, taking into account wear location. In addition, agreement between linear and nonlinear models was assessed using Cohen’s kappa statistic for hip- and wrist-wear locations separately. Secondarily, kappa statistics between the linear-alternate and nonlinear models were assessed.
To assess for differences between hip- and wrist-worn accelerations across tasks, three-way repeated measures analysis of variance (RM ANOVA) was used considering wear location, task, and sex. Post-hoc tests for task-specific hip-wrist differences were performed using Bonferroni corrections.
Repeatability of the hip- and wrist-worn accelerations was assessed using two-way, random intra-class correlations (ICC) for absolute agreement between ENMO accelerations for the three repeated tasks (sweeping, treadmill walking, and over-ground walking) for hip- and wrist-wear locations. RM ANOVAs were also performed (task × time) for each wear location to explore for a systematic bias between repeat assessments that may reflect the effects of fatigue as these three tasks were performed prior to and following the most intense treadmill activities. Post-hoc tests were performed as appropriate.
Secondary analyses were performed to assess the relationships between wrist and hip accelerations. Differences between ENMO accelerations obtained from the wrist versus the hip for each of the tasks were assessed using paired t-tests with Bonferroni correction (for 20 comparisons). Correlations between hip and wrist ENMO accelerations collectively and by task were assessed using Pearson correlation coefficients (R).
All statistical analyses were performed using SPSS® v.26.0 (IBM Corp., Armonk, NY). Significance was set at p ≤ 0.05, with adjustment for multiple comparisons as needed. Mean and SD are provided in text and standard errors (SE) are shown in figures unless otherwise noted.
The best fit linear and nonlinear algorithms for the wrist- and hip-based accelerations are provided in Eqs. (4)–(7), below. Using these equations, mean ENMO accelerations from the wrist explained 80% (linear) and 89% (nonlinear) of the variance in expected energy expenditure across tasks (Figure 1A and B). Similarly, for the hip, 81% and 85% of the variation in expected energy expenditure was explained by the mean ENMO acceleration values, using the linear and nonlinear models (Figure 1C and D).
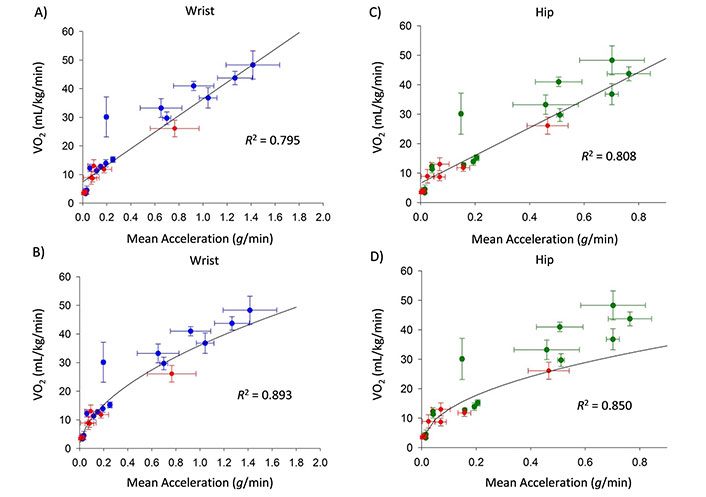
Mean (SD) measured accelerations (g) versus expected oxygen consumption (VO2) for wrist (A and B) and hip (C and D) accelerations collected in the current study (blue or green data) and previously reported mean (SD) accelerations and measured VO2 (Hildebrand, 2014 [19], red). The linear algorithm is shown in panels A and C; the nonlinear algorithm is shown in panels B and D. Equations of the best-fit lines are provided in the text as Eqs. (4)–(7)
The new linear models were similar to the original Hildebrand linear models but with the additional data collected, produced on average 7.3% and 10.9% lower VO2 estimates, and slightly higher R2, than previously reported.
The linear and nonlinear equations resulted in similar task intensity classifications for nearly all tasks at or above the light classification (see Figure 2). However, as expected, the lowest intensity tasks: lying, sitting, and keyboarding were classified as light 100% of the time for both wrist and hip linear algorithms (i.e., sedentary is below the linear model intercept); whereas the nonlinear algorithms classified these tasks as sedentary in 30–70% of individuals (see Figure 2). No other differences between linear and nonlinear approaches were observed at the p ≤ 0.01 level. When considering differences between hip and wrist, sweeping and the lowest MBP stages (1–4) were classified as moderate in more individuals using wrist than hip accelerometry, regardless of the processing method (p ≤ 0.001). However, all other tasks were assigned in proportions that were not different between measurement locations. A graphical representation of the linear-alternate algorithm is provided in Figure S1, showing its improved ability to discern sedentary behavior over the linear algorithm.
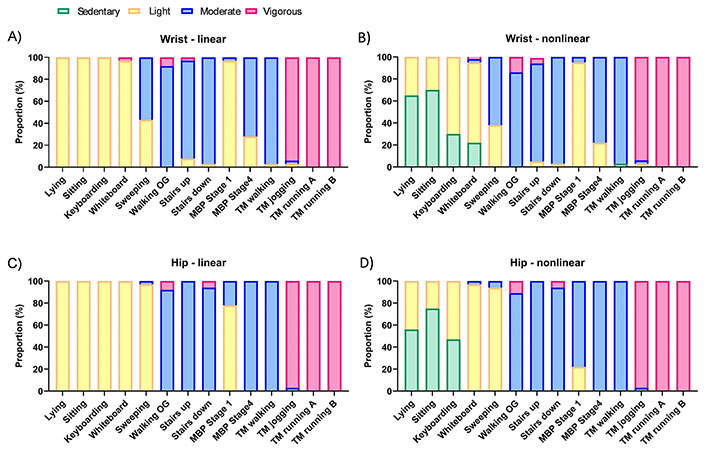
Linear and nonlinear algorithm activity intensity category distribution (% of individuals) for each task, classified as sedentary (green; ≤ 1.5 metabolic equivalents, METs); light (yellow; > 1.5 to < 3.0 METs); moderate (blue; ≥ 3.0 to < 6.0 METs); and vigorous (pink; ≥ 6.0 METs). Note, only the nonlinear model identifies sedentary intensity levels without needing a secondary means to do so. Hip and wrist differed on classification for sweeping and walking at 1.7 mph in the 1st stage of the MBP (p ≤ 0.01). OG: overground; MBP: modified Bruce protocol; TM: treadmill; running A: slower speed (6–8 mph); running B: faster speed (9–10 mph)
When assessing overall agreement across all tasks and intensities, the kappa statistic showed significant moderate agreement between the nonlinear and linear models (e.g., wrist k = 0.76; p < 0.001), due largely to the agreement observed in tasks at or above light intensity. When the sedentary correction was applied to generate the two-step linear-alternate algorithm, the agreement with the nonlinear algorithm increased to k = 0.82 (p < 0.001), with disagreements largely remaining in the lower activity tasks (see Figure S1). Yet, the correction produced somewhat inconsistent results for wrist and hip wear locations (i.e., comparing results for linear-alternate between wrist and hip), with the hip correction more closely matching the nonlinear algorithm than the wrist.
When comparing hip and wrist accelerations within each task (Figure 3), inconsistent differences were observed. The wrist was greater than hip accelerations for 9 of the 14 tasks, and no different for 5 of the tasks. Differences were most notable for tasks at the two ends of the spectrum: light tasks including lying down, sitting, and typing, and higher intensity tasks such as jogging and running (p < 0.001). Functional activities were mixed, with erasing a whiteboard not reaching significance (p = 0.21), whereas sweeping produced the largest difference in wrist versus hip accelerations of any tasks performed (p < 0.001).
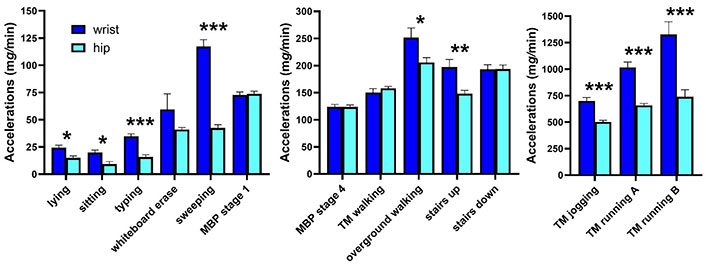
Mean (SE) wrist (dark blue) and wrist (light blue) accelerations per minute (mg/min) for 14 tasks showing similarities and differences between wear locations: 9/14 tasks showed significantly higher wrist than hip accelerations, and 5 showed no difference. MBP: modified Bruce protocol; TM: treadmill; running A: slower speed (6–8 mph); running B: faster speed (9–10 mph). *: p < 0.05; **: p < 0.01; ***: p < 0.001
When plotting hip (y-axis) versus wrist (x-axis) ENMO accelerations for each task, the linear and quadratic fits resulted in similar R2 values of 0.87 and 0.90, respectively (Figure 4). That is, multiplying wrist accelerations by 0.56 explained 87% of the variance in hip measurement. The two curves differed by only 10–15% until reaching wrist acceleration values of approximately 1.8 g/min, when they began to diverge by more than 10%. However, this rarely occurred, with 1% (n = 8) and 0.3% (n = 2) of 703 observations exceeding 1.6 or 1.8 g/min at the wrist, respectively. Thus, differences between the two curve fits were minimal for 99% of the tasks and individuals assessed. Hip and wrist ENMO accelerations were significantly correlated for most tasks of moderate or higher intensity (see Table S2). However, select tasks showed no significant correlation between hip and wrist assessments, particularly lower-intensity tasks: lying, sitting quietly, and keyboarding, and one moderate-intensity task, sweeping (Table S2). Overall, when evaluating all wrist and hip accelerations across individuals and tasks, they were highly correlated (R = 0.93, p < 0.001).
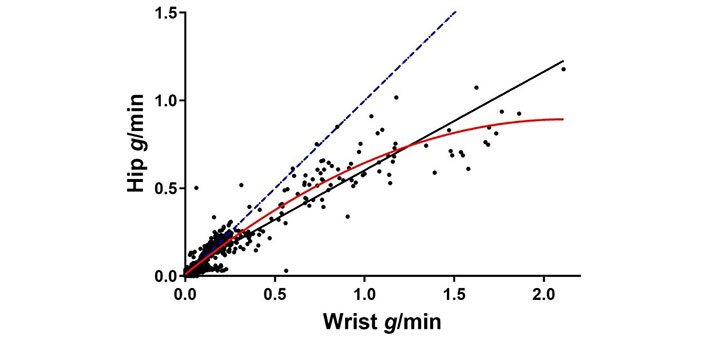
Individual wrist versus hip accelerations per minute for all assessed tasks. The identity line (i.e., if wrist = hip accelerations) is shown as a linear blue dashed line. The quadratic (red, solid) regression line shows the hip vs wrist nonlinear relationship: hip = 0.01 + 0.830 * (wrist) – 0.195 * (wrist)2, R2 = 0.90; the black linear line shows the hip vs. wrist linear relationship: hip = 0.04 + 0.56 * (wrist), R2 = 0.87
The ICCs for the three repeated tasks (sweeping, over-ground walking, and treadmill walking) were consistently excellent for hip: 0.957, 0.899, and 0.902, and good to excellent for wrist: 0.945, 0.684, and 0.947, respectively. Overground walking showed the lowest repeatability of the three tasks, particularly for wrist-worn assessment, indicative of varied arm use during over-ground walking. Pairwise small but significant increases in hip accelerations were observed for the second compared to the first trials (F2,35 = 22.8, p < 0.001). However, no significant effect of time was observed at the wrist overall (F2,36 = 1.02, p = 0.32) or time-by-task interaction (p = 0.38). The hip accelerations were consistently 5–6% higher for the walking and sweeping trials, whereas at the wrist only the overground walking task showed 6% higher accelerations in the second trial. The treadmill walking and sweeping average accelerations were identical (0% different).
While PA is not without risks, it is widely recognized as providing many physical and mental health benefits, including older adults and those with clinical conditions [5, 6, 9, 10, 33]. The use of wearable sensors has great potential to aid clinicians in caring for their patients as well as provide objective assessments for patients to self-monitor their health and provide a degree of locus of control over their self-management. The use of objective wearables may be of value in clinical rehabilitation and/or hospital settings to better track activity levels throughout a patient’s day and not only when nursing or rehabilitation therapies can assist with movement [11]. However, there remains a critical need for researchers to have validated algorithms to accurately interpret the acceleration signals, particularly at the lower PA intensities when targeting patient populations.
A wide range of processing models have been proposed to estimate PA metrics from raw acceleration signals, including simple, linear regression [19] to more complex decision tree models [21]. Following the law of parsimony, which suggests that the simplest model to adequately represent a phenomenon should be chosen, finding the most accurate yet straightforward model is optimal. The current study supports the use of a single nonlinear equation to define activity intensity based simply on the mean accelerometer ENMO output. Indeed, the estimated energy expenditure for light, moderate, and vigorous activities in the current study was nearly identical to the previously validated Hildebrand linear approach, supporting that this basic approach is generalizable. However, the nonlinear algorithm has the added advantage of being able to discriminate sedentary from light activity which is not possible using the original linear Hildebrand approach without implementing a 2nd step, which adds potentially unnecessary complexity. Certainly, identifying specific behaviors as sedentary using techniques such as machine learning is an alternate strategy to assigning low energy expenditures as sedentary, but is beyond the scope of this study.
While linear models provide a simple and traditional approach, their drawback is the intercept value defining the lowest VO2 estimate when accelerations are zero. Hildebrand reported wrist and hip model intercept values of 7.28 and 6.67 mLO2/kg/min, respectively, using a similar methodology as this current study [19]. This translates to 2.1 and 1.9 METs, even when no activity is measured. Thus, sedentary behavior (based on typical cut-offs of < 1.5 METs or < 1.6 METs) would be identified as light activity, regardless of the true energy expenditure required. In recognition of this limitation, they proposed acceleration cut-offs to separately identify sedentary activity before applying their linear model [24]. This correction factor, 45 mg or below for the wrist (47 mg for the hip) in adults was reported to have excellent sensitivity (> 95%) but only moderate specificity (74–78%) [24]. However, the sedentary cut-off values identified: 44.8 mg/min and 47.4 mg/min for wrist and hip, respectively, correspond to 2.49 METs and 2.66 METs using their linear equation [19]. This correction results in erroneously identifying light activity occurring between 1.5 METs and 2.5–2.7 METs as sedentary. Accordingly, this correction factor approach cannot identify any light activity until it exceeds 2.5 METs when this correction is applied. Whereas the nonlinear model provides similar estimates as the linear-alternate model without the limitations associated with this two-step approach.
Crouter and colleagues [16] observed a similar nonlinear phenomenon, addressing the nonlinearities between activity counts measured using hip-worn devices and energy expenditure with the use of two, discontinuous linear equations. While the commonly referred to “Crouter equation” approach relies on the variance of the acceleration signal as the equation determinant, this variance is somewhat collinear with intensity. That is, greater variation was observed at the lower intensities (i.e., lifestyle activities), and less variation was observed with walking, jogging, and running, which were the higher-intensity activities evaluated. Further, this two-regression model approach has not been adapted to process raw accelerometry data, rather it uses only “count” data for the hip and is unavailable for wrist-worn measurement [15, 16]. Corrections available in software platforms, such as ActiLife to adjust wrist-based measurement for use with hip-based algorithms induce greater error than observed differences between hip and wrist wear during walking [34]. Thus, single nonlinear equations that are specific to hip and wrist wear provide easily defined and user-friendly approaches to estimating energy expenditure across the intensity spectrum from acceleration data that can be transparently processed by the end user.
Two studies comparing four different processing algorithms further support the use of this nonlinear modification. The first is similar to the current study, in that it involved lab-based activities but in young adults [23]; the second assessed daily free-living PA in women with fibromyalgia [35]. Both compared the linear and nonlinear approaches included in the current study, relying only on mean accelerations per minute, as well as two more complex approaches that relied on acceleration variability metrics (SD of the signal) and/or random forest methods [21]. Only this nonlinear algorithm resulted in estimates of low, moderate, and high PA that correlated consistently with self-reports in the patient cohort; the linear Hildebrand showed significant correlations only with estimated time spent in MVPA, and the random forest methodology only significantly correlated with sedentary time [35]. In the laboratory-based activities, the nonlinear model was the best algorithm to match measured VO2 for sedentary and light tasks, was excellent at representing moderate walking, but tended to underestimate VO2 for the moderate activities involving disproportionate arm use (i.e., walking while texting on a phone) [23]. Overall, these additional investigations support the current findings suggesting the utility of a simple nonlinear algorithm but also show that no algorithm is perfectly able to reflect all forms of PA.
Studies have demonstrated that wrist- and hip-based measurements are not interchangeable, typically requiring separate algorithms [18–20]. Our findings support that hip and wrist assessments can be significantly different yet show that these differences vary with activity. Overall, we observed wrist ENMO accelerations were approximately 75% greater than hip accelerations, particularly for the sweeping and running activities, with the hip-wrist relationship displaying a strong linear component, particularly through the intensity range of daily activities. Our results suggest that if desired, any wrist correction should be moderate at most and that either a linear or a weak nonlinear curve explains roughly 87–90% of the variance observed between hip and wrist ENMO assessments, making their comparison across studies not as problematic as some have suggested.
The increasing use of wrist-worn devices has clearly outpaced the development of wrist-worn algorithms. While the accuracy of wrist-based measurement has been called into question [20], the current study, along with the previous linear Hildebrand model, collectively suggest that similar if not better estimates can be obtained from wrist-based algorithms. We observed R2 for the wrist that slightly surpassed the hip algorithms when using the nonlinear model. Previous reports using the linear model reported only slightly worse R2 values at the wrist (i.e., 0.75 to 0.76) compared to the hip (i.e., 0.79–0.81) [19]. Accordingly, we can confidently conclude that the nonlinear wrist algorithm is at least as good as the nonlinear hip algorithm across a wide range of activities and intensities.
In addition to the global limitations of accelerometry to assess PA, specific limitations of the current study should be noted. First, we assessed the non-dominant wrist without holding any purses, bags, or assistive devices during ambulation, which may limit generalizability when assessing lifestyle PA estimates under “real world” conditions and in patient cohorts. These results are limited to the wear sites assessed and may not generalize to other sites used such as the thigh, ankle, or low back. Further, we did not assess VO2 at the individual level but used observation and previous literature to generate mean (SD) estimates of energy expenditure. However, we combined our results with previously reported data using indirect calorimetry [19] to minimize this limitation and reduce potential bias. Additionally, in another study using indirect calorimetry to measure VO2, supporting results were reported [23]. Order effects of the controlled tasks cannot be ruled out, but the repeatability of the 3 tasks tested twice—with the second test being at the end of the protocol, suggests order had minimal impact on accelerometry measurements. Lastly, the fact that our linear model closely matched the original Hildebrand linear model, but with extra data at a wider range of task intensities, supports that this limitation minimally affected our outcomes. However, despite the inclusion of young and older adults, these findings may not fully translate to clinical populations. Future studies involving patient cohorts would be beneficial to further assess these models in the populations being targeted.
In conclusion, these findings support the use of a simple nonlinear algorithm for wrist- or hip-worn accelerometry for estimating energy expenditure for most tasks, particularly if sedentary behavior and/or light PA is of interest. However, if only identification of MVPA is needed, the linear algorithms produce nearly identical results and thus are appropriate for this purpose. Recognizing that the acceleration magnitudes can differ between locations, distinct wear location algorithms are optimal to estimate energy expenditure most accurately, and caution should be used when attempting to transform between hip and wrist accelerations due to the nonlinear and inconsistent nature of this relationship, particularly for low intensity or functional tasks.
BMI: body mass index (kg/m2)
ENMO: Euclidian norm minus one (i.e., due to 1g)
g: acceleration due to gravity (9.81 m/s2)
MBP: modified Bruce protocol
METs: metabolic equivalents (1 MET = 3.5 mLO2/kg/min)
mg: milli g units
MVPA: moderate to vigorous physical activity
PA: physical activity
R2: coefficient of determination
SD: standard deviation
VO2: oxygen consumption
The supplementary materials for this article are available at: https://www.explorationpub.com/uploads/Article/file/100766_sup_1.pdf.
The authors would like to acknowledge the efforts of several graduate students in the collection of this data: Henry Byl; Lauren Fleener; Krista Hannasch; Taylor Helms; Nathan Kleckner; Josh Krutsinger; Garrett McGrane; Michael Mueller; Rebecca Spitz; Brittany Treichler; Daniel Vogel; Abe Ward; Leigha Yerk. In addition, salary support for SLM was provide by the U.S. Army. Any citations of commercial organizations and trade names in this article do not constitute an official Department of the Army or DoD endorsement of approval of the products or services of these organizations.
LAFL: Conceptualization, Investigation, Formal analysis, Writing—original draft, Writing—review & editing, Supervision. SLM: Investigation, Writing—review & editing. DD: Validation, Writing—review & editing, Supervision. KAS: Conceptualization, Investigation, Writing—review & editing. All authors read and approved the submitted version.
Prof. Laura A. Frey-Law who is an Associate Editor of Exploration of Musculoskeletal Diseases had no involvement in the decision-making or the review process of this manuscript. The other authors declare that they have no conflicts of interest.
The study was approved by the University of Iowa Biomedical Institutional Review Board (201412729).
Written informed consent to participate in the study was obtained from all participants.
Not applicable.
Data is available upon request to the corresponding author, LAFL.
While this study was not directly supported by external funding, support for REDCap was possible through funding by the National Center for Advancing Translational Sciences of the National Institutes of Health under Award Number [UM1TR004403]. The content is solely the responsibility of the authors and does not necessarily represent the official views of the National Institutes of Health. The funders had no role in study design, data collection and analysis, decision to publish, or preparation of the manuscript.
© The Author(s) 2024.
Copyright: © The Author(s) 2024. This is an Open Access article licensed under a Creative Commons Attribution 4.0 International License (https://creativecommons.org/licenses/by/4.0/), which permits unrestricted use, sharing, adaptation, distribution and reproduction in any medium or format, for any purpose, even commercially, as long as you give appropriate credit to the original author(s) and the source, provide a link to the Creative Commons license, and indicate if changes were made.