Affiliation:
1Department of Neurocutaneous Medicine, Division of Health Sciences, Graduate School of Medicine, Osaka University, Suita, Osaka 565-0871, Japan
ORCID: https://orcid.org/0009-0007-5094-8675
Affiliation:
1Department of Neurocutaneous Medicine, Division of Health Sciences, Graduate School of Medicine, Osaka University, Suita, Osaka 565-0871, Japan
ORCID: https://orcid.org/0000-0002-3977-4332
Affiliation:
2Department of Dermatology, Graduate School of Medicine, Osaka University, Suita, Osaka 565-0871, Japan
ORCID: https://orcid.org/0000-0002-3062-4872
Affiliation:
1Department of Neurocutaneous Medicine, Division of Health Sciences, Graduate School of Medicine, Osaka University, Suita, Osaka 565-0871, Japan
2Department of Dermatology, Graduate School of Medicine, Osaka University, Suita, Osaka 565-0871, Japan
Email: mkaneda@sahs.med.osaka-u.ac.jp
ORCID: https://orcid.org/0000-0001-7280-9560
Explor Neurosci. 2024;3:527–538 DOI: https://doi.org/10.37349/en.2024.00064
Received: August 23, 2024 Accepted: October 11, 2024 Published: October 29, 2024
Academic Editor: Jinwei Zhang, University of Exeter Medical School, UK
The article belongs to the special issue Epilepsy
Aim: Patients with tuberous sclerosis complex (TSC) which is caused by hyperactivation of mechanistic target of rapamycin complex 1 (mTORC1) often show giant cells in the brain. These giant cells are thought to be involved in epileptogenesis, but the underlying mechanisms are unknown. In this study, we focused on mTORC1 activation and γ-amino butyric acid (GABA)ergic signaling in somatostatin-expressing inhibitory neurons (SST-INs) using TSC-related epilepsy model mice.
Methods: We analyzed the 8-week-old Tsc2 conditional knockout (Tsc2 cKO) mice, which have epileptic seizures that are cured by sirolimus, an mTORC1 inhibitor. After the occurrence of epileptic seizures was confirmed, Tsc2 cKO mice were treated with vehicle or sirolimus. Then, their brains were investigated by hematoxylin and eosin staining, immunohistochemical staining and immunoblotting assay.
Results: As in TSC patients, giant cells with hyperactivation of mTORC1 were found in the cerebral cortex of Tsc2 cKO mice. These giant cells were mainly SST-INs in the cortical layers 4/5. Giant cells showed decreased expression of GABA type A receptor subunit α1 (GABAAR-α1) compared with normal size cells in control mice and Tsc2 cKO mice. In addition, decreased GABAAR-α1 expression was also confirmed by immunoblotting assay of the whole cerebral cortex. In the cerebral cortex of sirolimus-treated Tsc2 cKO mice, whose epileptic seizures were cured, decreased GABAAR-α1 expression was recovered to the same level as in control mice.
Conclusions: These results suggest that the epileptic seizures in Tsc2 cKO mice are caused by the deregulation of GABAergic signaling through mTORC1 activation of SST-INs localized in cortical layers 4/5.
Tuberous sclerosis complex (TSC) is known as an autosomal dominant genetic disorder characterized by systemic hamartomas and neuropsychiatric symptoms, such as intractable epilepsy [1–4]. TSC is caused by inactivating mutations in the TSC1 or TSC2 genes [5, 6]. Proteins encoded by the TSC1 (also known as hamartin) and TSC2 genes (tuberin) form a complex that negatively regulates the mechanistic target of rapamycin complex 1 (mTORC1), which regulates protein synthesis, cellular growth, and autophagy [7]. Clinical trials have demonstrated that treatment with mTORC1 inhibitors, such as sirolimus, suppresses TSC-related epileptic seizures, indicating that TSC-related epilepsy is induced by excessive activation of mTORC1 [8–15]. Therefore, the analysis of the molecular and functional changes induced by mTORC1 activation is important for understanding the pathogenesis of TSC-related epilepsy.
Accumulating evidence suggests that one cause of TSC-related epilepsy is dysregulation of γ-amino butyric acid (GABA)ergic signaling resulting from dysfunction of GABAergic inhibitory neurons and altered expression of GABA receptor subunits [16]. Indeed, it has been reported that the expression of the GABA type A receptor subunit α1 (GABAAR-α1) is decreased in TSC patients [17]. GABAergic inhibitory neurons are classified into three major subgroups based on the expression of specific molecular markers, parvalbumin, somatostatin, and calretinin [18]. In the mammalian cerebral cortex, somatostatin-expressing inhibitory neurons (SST-INs) consist of several subclasses that can be distinguished by their layer location, morphology, and firing properties [19]. These subclasses of SST-INs play distinct roles because they have different targets to inhibit [20]. Indeed, layer 4 (L4) SST-INs target nearby L4 parvalbumin expressing inhibitory neurons, while L5 SST-INs target distal L1-4 excitatory neurons [21, 22]. However, little is known about the effects of mTORC1 activation on the layer-specific SST-INs function.
TSC patients often show mTORC1-activated giant cells, derived from neurons and astrocytes, which are thought to be involved in epilepsy [23–26]. Although the role of mTORC1 activation in excitatory neurons has been well studied, its role in inhibitory neurons is relatively unknown. Thus, the investigation of these giant cells derived from inhibitory neurons may help to clarify how mTORC1 activation is involved in epilepsy.
In this study, we found mTORC1-activated giant cells in the cerebral cortex of 8-week-old Tsc2 conditional knockout (Tsc2 cKO) mice exhibiting spontaneous epileptic seizures [27, 28]. Furthermore, we identified these giant cells as primarily L4/5 SST-INs. Here, we suggested that mTORC1 activation in L4/5 SST-INs is one of the causes of epilepsy.
To generate Tsc2 cKO mice, Tsc2flox/flox mice were crossed with microphthalmia-associated transcription factor (Mitf)-Cre mice as reported previously [29]. Both lines were maintained a C57BL/6 inbred background and generated in Osaka University’s animal experiment facility. The genotyping identification results and primer information have been previously reported [28, 29]. In this study, 7-week-old male or female mice weighing over 18 g were used. Control mice were littermates, Tsc2flox/flox, Tsc2flox/+, or Mitf-Cre mice. This study used only Tsc2 cKO mice in which confirmed epileptic seizures. We previously confirmed that Tsc2 knockout occurred in the brain [28]. Mice were housed in 12:12-hour light-dark cycle (light on from 08:00 to 20:00) at room temperatures ranging between 21.5°C and 24.5°C and humidities between 30% and 60%.
Seizures counts, epilepsy score calculations, and sirolimus treatment were performed as previously reported [28]. In briefly, the number of epileptic seizures was assessed three times a day (09:00–10:00, 13:00–14:00, 17:00–18:00), during 7 days of treatment with sirolimus or vehicle. Sirolimus (3 mg/kg/day) or vehicle was intraperitoneally injected into 7-week-old mice once daily for 7 consecutive days.
Mice were intraperitoneally anesthetized with three types of mixed anesthetic agents (0.3 mg/kg medetomidine, 4 mg/kg midazolam, and 5 mg/kg butorphanol) and additionally with inhalation anesthesia (sevoflurane) as necessary. Mice were perfused with 0.9% NaCl and the cerebral cortex was harvested for immunoblotting and stored at –80°C.
For histological analysis, mice brain tissues were fixed in 4% paraformaldehyde in phosphate-buffer saline (PBS) overnight at 4°C, and the brains were cut in the sagittal plane and embedded in paraffin. Three-micrometer-thick sections were stained with hematoxylin and eosin (H&E).
For immunohistochemical staining of mouse tissues, 4% paraformaldehyde-fixed, paraffin-embedded tissue sections were processed for antigen retrieval by oil bath for 10 min at 120°C in 10 mM citrate buffer pH 6.0 or 1 mM EDTA pH 8.0. After blocking with 25% Block Ace (DS Pharma Biochemical CO., Ltd., Japan) containing 5% normal goat serum (ImmunoBioScience Corp., Mukilteo., WA., USA) and 0.1% Triton X-100 in PBS for 1 h at room temperature, the sections were incubated with primary antibodies, overnight at 4°C. After washing with PBS, the sections were incubated with secondary antibodies for 2 h at room temperature. Then, sections were incubated with Hoechst for 5 min at room temperature for nuclear staining and sections were sealed with Mounting Medium (SCR-038447, Dianova, Hamburg, Germany). Fluorescent images were visualized using a BZ-X710 microscope (Keyence, Osaka, Japan). The following primary antibodies were used for immunohistochemistry: anti-phospho-S6 (Ser235/236) (#62016, Cell Signaling Technology, Beverly, MA, USA), anti-NeuN (#24307, Cell Signaling Technology), anti-Cux1+Cux2 (ab309139, Abcam, Cambridge, UK), anti-Satb2 (ab92446, Abcam), anti-Ctip2 (ab18465, Abcam), anti-parvalbumin (ab181086, Abcam), anti-somatostatin (Bioss Inc, BS-8877R, MA, USA), and anti-calretinin (ab244299, Abcam), anti-GABA A receptor alpha 1 (ab252430, Abcam) at 1:100. The following secondary antibodies were used to detect primary antibodies: anti-mouse Alex Fluor 488 (Invitrogen, Waltham, MA, USA) and anti-rabbit Alex Fluor 555 (Invitrogen) or anti-rat Alex Fluor 555 (Invitrogen) at 1:1,000.
After immunohistochemical staining mice brains with anti-phosphorylated S6 (pS6) and anti-NeuN antibodies, we captured fluorescent images (×40) at 6 sections per mice cerebral cortex. Fluorescent images were converted to 8-bit grayscale and measured the corrected total cell fluorescence (CTCF) using ImageJ software (NIH, Bethesda, MD, USA). The CTCF was calculated using the following formula: Integrated Density – (Area of selected cell × Mean fluorescence of background readings). Cells in the anti-pS6 antibody-stained images with CTCF values over 1,000 were counted as mTORC1-activated cells. After H&E staining mice brains, we captured images (×40) at 6 sections per mice cerebral cortex and cell body areas were measured.
Proteins were extracted from tissue using RIPA lysis buffer (100 mg tissue/1 mL RIPA lysis buffer) containing protease inhibitor cocktail (1:100; 25955-11, Nacalai Tesque, Kyoto, Japan) and phosphatase inhibitor (1:100; 07574-61, Nacalai Tesque). Protein concentrations were measured with a BCA protein assay kit (23225, Thermo Fisher Scientific, Waltham, MA, USA) and 5 μg of proteins were used for immunoblotting as described previously [28]. The following primary antibodies were used for immunoblotting: anti-S6 (#2317, Cell Signaling Technology), anti-phospho-S6 (Ser235/236) (#4858, Cell Signaling Technology), anti-Glutamate Receptor 1 (AMPA subtype) (ab183797, Abcam), anti-NMDAR1 (MAB363, Sigma-Aldrich, St. Louis, MO, USA), anti-GluK (ab67316, Abcam), anti-GABA A receptor alpha 1 (ab252430, Abcam) at 1:1,000, and anti-GAPDH (ab8245, Abcam) at 1:5,000. GAPDH was used as a loading control protein. The following HRP-conjugated secondary antibodies were used to detect primary antibodies: anti-mouse IgG (NA931, Cytiva, Marlborough, MA, USA) or anti-rabbit IgG (NA934, Cytiva) at 1:5,000. For semi-quantitative relative protein expression, protein bands were quantified using ImageJ software. GAPDH was used as a control to normalize the protein expression of AMPA receptor subunit (GluA1), NMDA receptor subunit (GluN1), kainate receptor subunit (GluK1), and GABAAR-α1. Ribosomal protein S6 (S6) was used as a control to normalize the protein expression pS6. All original raw data of immunoblotting were provided in Figure S1.
Data were analyzed using GraphPad Prism v.9 (GraphPad Software, San Diego, CA, USA) and expressed as the mean ± standard deviation (SD) or as the medians and interquartile ranges. The normality of all quantitative data was checked using Q-Q plots and then analyzed as parametric data. Parametric data from two groups were compared using Student’s t-test, and more than two groups using unpaired one-way analyses of variance (ANOVAs) with Tukey’s correction. P-values < 0.05 were significant (* P < 0.05; ** P < 0.01; *** P < 0.001).
First, we performed H&E staining on the sagittal brain sections for histological analysis. As in TSC-related epilepsy patients, Tsc2 cKO mice showed giant cells in the cerebral cortex (Figure 1A, c and d). The cell size of giant cells was increased more than 2-fold compared with the normal cells in control mice (Figure 1B). Sirolimus-treated Tsc2 cKO mice showed suppressed epileptic seizures (Figure S2) and reduced the number of giant cells compared with vehicle-treated Tsc2 cKO mice (Figure 1C). Subsequently, we investigated activation of mTORC1. Activation of mTORC1 induces phosphorylation of the S6, thus pS6 is generally regarded as an activation marker of mTORC1. Therefore, pS6-positive cells are described as mTORC1-activated cells in this study. Immunostaining with anti-pS6 antibody exhibited that the number of mTORC1-activated cells was increased in Tsc2 cKO mice compared with control mice, and this increasing was suppressed by sirolimus treatment (Figure 1D and E).
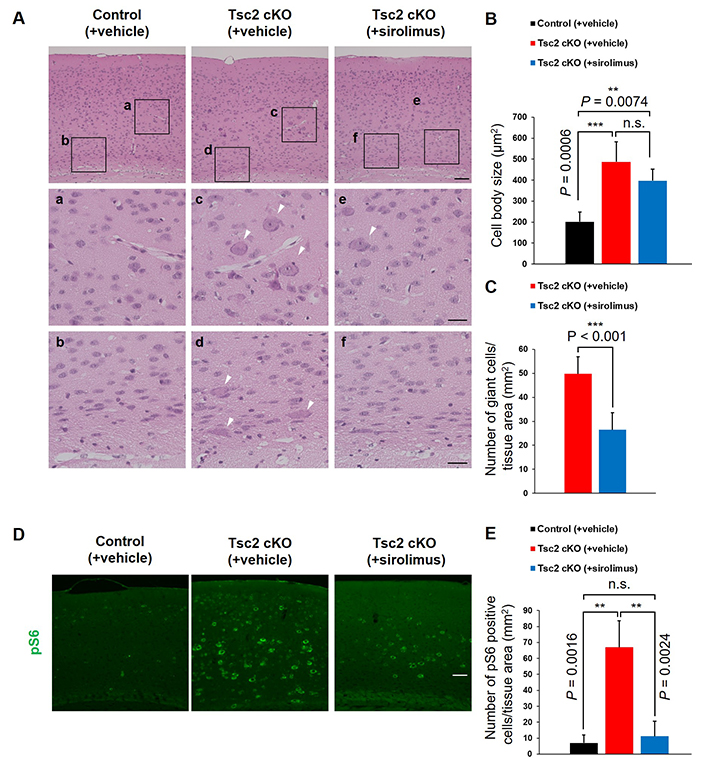
Tsc2 cKO mice showed giant cells in the cerebral cortex. A. Representative hematoxylin and eosin (H&E) staining of the cerebral cortex of 8-week-old mice. White arrowheads indicate giant cells. The bottom panels (a–f) show high-magnification images of the regions designed the black squares outline in the upper panels. Scale bars: upper panel, 400 μm; bottom panel, 100 μm. B. The cell body size. C. The number of large cells (> 400 μm2) per mm2 tissue area. D. Immunostaining of 8-week-old mice cerebral cortex with anti-pS6 (mTORC1 activation marker) antibody. Scale bars: 400 μm. E. Counting the number of mTORC1 activated cells. Asterisks indicate significant differences. n.s.: not significant; pS6: phosphorylated S6; Tsc2 cKO: Tsc2 conditional knockout. Values are the means ± SD of each experiment. Each experiment n = 6
To analyze detail localization of mTORC1-activated cells, we performed double immunostaining for pS6 with nuclear marker genes of layer-specific neurons, Cux1/2 (layers 2–4), Satb2 (layers 2–5), and Ctip2 (layers 5/6) (Figure 2). These results showed mTORC1-activated cells were mainly localized in L4/5 of Tsc2 cKO mice. Moreover, L4/5 mTORC1-activated cells mainly expressed Satb2, indicating that mTORC1-activated cells are neurons. To confirm that L4/5 mTORC1-activated cells are neurons and to observe their cell size, we performed double immunostaining for pS6 and NeuN, a mature neuron marker (Figure 3A). L4/5 mTORC1-activated cells were NeuN-positive, and these cells size were increased more than 2-fold compared with normal neurons size in control mice, which was generally consistent with giant cells size found in H&E staining (Figure 1B and Figure 3B). The number of all L4/5 neurons, including giant cells, was decreased in both vehicle and sirolimus-treated Tsc2 cKO mice compared with control mice (Figure 3C).
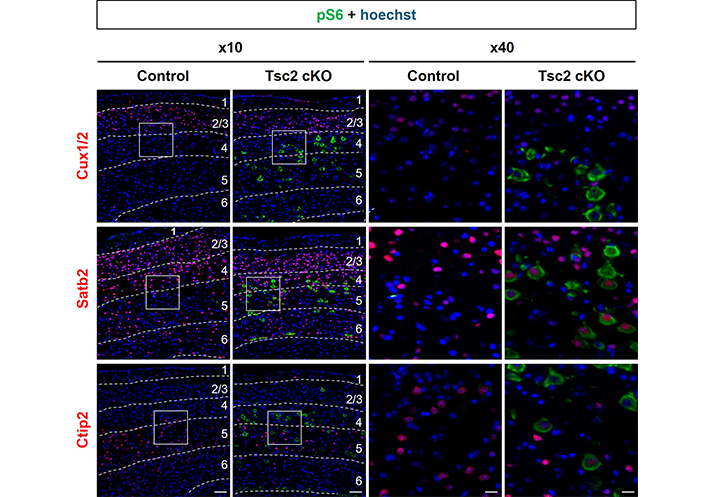
Localization of mTORC1-activated cells in cerebral cortex of Tsc2 cKO mice. Representative double immunostaining of the cerebral cortex of 8-week-old mice with pS6 (green) and neuronal layer markers (red), Cux1/2 (layers 2–4) and Satb2 (layers 2–5) and Ctip2 (layers 5/6), respectively. The numbers in the figures indicate cortical layers. The right panels show high-magnification images of the regions designed the white squares outline in the left panels. Scale bars: left panel, 400 μm; right panel, 100 μm. Each experiment: n = 3. Tsc2 cKO: Tsc2 conditional knockout
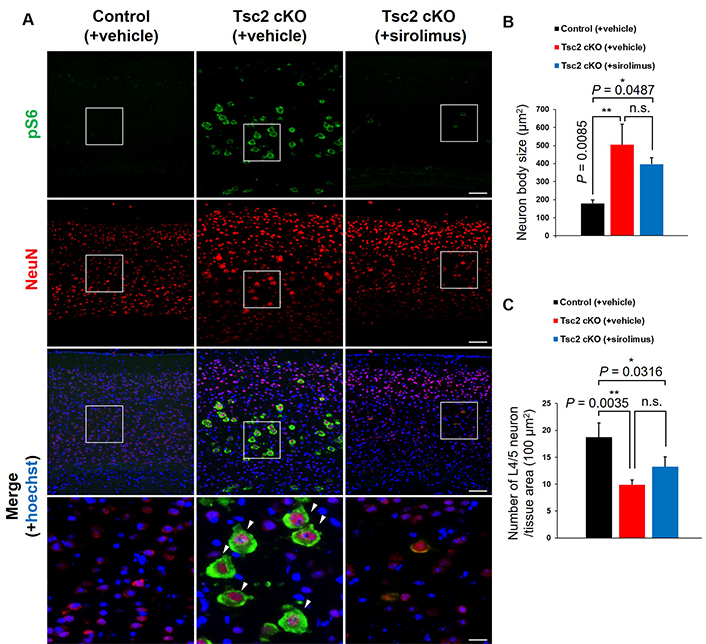
Identification of cell types in giant cells. A. Representative double immunostaining of pS6 (green) and NeuN (mature neuron marker, red) in the cerebral cortex of 8-week-old mice. White arrowheads indicate giant neurons. The bottom panels show high-magnification images of the regions designed the white squares outline in the upper panels. Scale bars: upper panel, 400 μm; bottom panel, 100 μm. B. The neuron body size. C. Counting the number of L4/5 neurons. Asterisks indicate significant differences. n.s.: not significant. Values are the means ± SD of each experiment. Each group n = 6
Subsequently, we investigated whether L4/5 giant neurons are excitatory or inhibitory. Double immunostaining was performed for pS6 and inhibitory neuron markers (parvalbumin, somatostatin, and calretinin) (Figure 4A). These results showed that L4/5 giant neurons are primarily SST-INs. In addition, the number of giant L4/5 SST-INs was increased in Tsc2 cKO mice compared to control mice, and this increasing was suppressed by sirolimus treatment (Figure 4B and C). Finally, we observed the expression of glutamate and GABAARs in the cerebral cortex. Immunoblotting analysis showed no changes in the protein expression level of AMPA receptor subunit (GluA1), NMDA receptor subunit (GluN1), and kainate receptor subunit (GluK1) between any of the mouse groups. In contrast, the expression of GABAAR-α1 was decreased in Tsc2 cKO mice compared with control mice, which was rescued by sirolimus treatment to the same level as control mice (Figure 5A and B). The mTORC1 activation was confirmed by the pS6/S6 expression ratio. Furthermore, double immunostaining for pS6 with GABAAR-α1 showed giant cells in Tsc2 cKO mice had decreased GABAAR-α1 expression compared with normal size cells in control mice and Tsc2 cKO mice (Figure 5C).
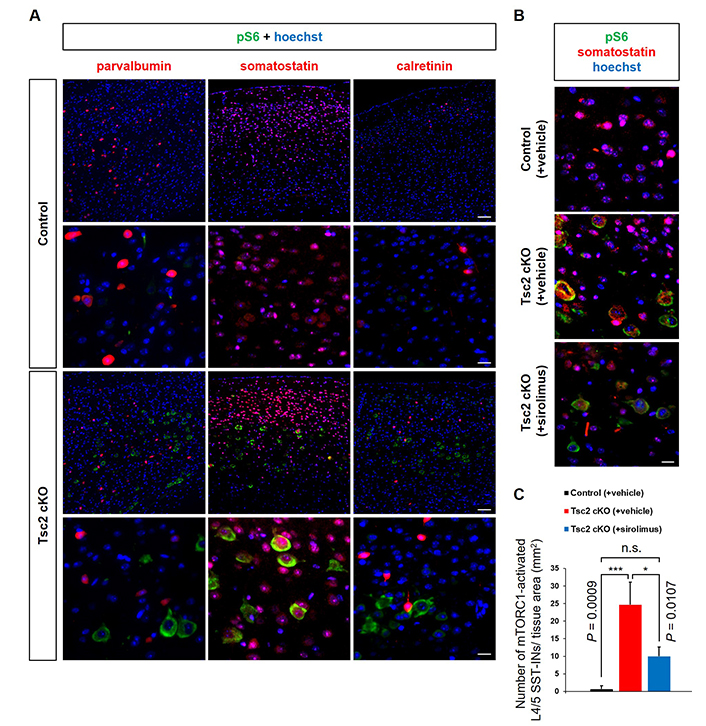
SST-INs hyperactivate mTORC1. A. Representative double immunostaining of the cerebral cortex of 8-week-old mice with pS6 (green) and inhibitory neuron markers; parvalbumin, somatostatin, calretinin (red). The bottom panels show high-magnification images of the regions designed with the white squares outline in the upper panels. White arrowheads indicate somatostatin-expressing mTORC1 activated neurons. Scale bars: upper panel, 400 μm; bottom panel, 100 μm. B. Representative double immunostaining of pS6 (green) and somatostatin (red). Scale bars: 100 μm. C. Counting the number of mTORC1-activated L4/5 SST-INs. Asterisks indicate significant differences. n.s.: not significant; pS6: phosphorylated S6; SST-INs: somatostatin-expressing inhibitory neurons. Each experiment: n = 3
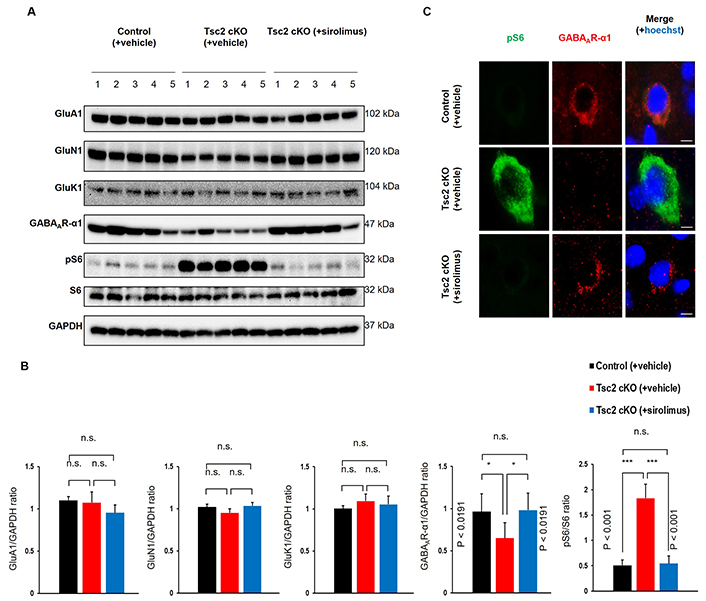
The expression of GABAAR-α1 is decreased in SST-INs depend on hyperactivation of mTORC1. A. Protein expression in the cerebral cortex of 8-week-old mice. Immunoblotting of glutamatergic receptors subunit (GluA1, GluN1, and GluK1) and GABAergic receptor subunit, GABA type A receptor subunit α1 (GABAAR-α1). For verification of mTORC1 activation, pS6 and S6 were confirmed. GAPDH was used for loading control. B. Semi-quantitative analysis of immunoblotting bands. Each group n = 5. C. Representative double immunostaining of pS6 (green) and GABAAR-α1 (red) in the cortical layers 4/5 of 8-week-old mice. Scale bars: 20 μm. Asterisks indicate significant differences. n.s.: not significant; pS6: phosphorylated S6; SST-INs: somatostatin-expressing inhibitory neurons. Values are the means ± SD of each experiment. Each group n = 3
TSC patients often have mTORC1-activated giant cells in their brains, suggesting that these cells are involved in epileptic seizures [24, 25]. In this study, we investigated giant cells in the TSC animal model, Tsc2 cKO mice.
Giant cells were found in the cerebral cortex of Tsc2 cKO mice, but not in control mice (Figure 1A). These giant cells were identified as mTORC1-activated L4/5 neurons, mainly SST-INs (Figures 2–4). Sirolimus-treated Tsc2 cKO mice showed that suppression of epileptic seizures (Figure S2) and reduction of the number of giant cells, including giant L4/5 SST-INs, compared with vehicle-treated Tsc2 cKO mice (Figure 1C; Figure 4B and C). In addition, sirolimus-treated Tsc2 cKO mice did not show decreased the number of L4/5 neurons (Figure 3C), speculating that giant cells were reverted to the original normal cells.
In the whole cerebral cortex, the expression of GluA1, GluN1, and GluK1 did not change between control and Tsc2 cKO mice. In contrast, the expression of GABAAR-α1 was decreased in Tsc2 cKO mice compared with control mice. GABAAR-α1 expression in Tsc2 cKO mice was reversed by sirolimus treatment to the same level as in control mice (Figure 5A and B). Furthermore, giant cells of Tsc2 cKO mice showed decreased GABAAR-α1 expression compared with normal size cells of control mice and Tsc2 cKO mice (Figure 5C). These results suggest that giant L4/5 SST-INs with mTORC1-dependent decreased GABAAR-α1 expression are involved in the epileptogenesis of Tsc2 cKO mice.
A previous study has shown that the strength of inhibitory synaptic transmission is reduced in mTORC1-activated L5 SST-INs [30]. Thus, we speculated that giant L4/5 SST-INs of Tsc2 cKO mice have reduced inhibitory functions targeting nearby L4 parvalbumin-expressing inhibitory neurons and distal L1–4 excitatory neurons, respectively. A limitation of this study is that we used mice in which Tsc2 was conditionally knocked out specifically in some cells, making it difficult to analyze detailed changes in gene expression and function within cells based on tissue-based experiments. Therefore, in the future, it will be necessary to perform cell-based analysis focusing on giant cells of Tsc2 cKO mice through experiments using primary cultured cells or single-cell analysis. The present results were obtained using rodents (mice) and cannot be immediately translated to humans. Therefore, studies using other species closer to humans, such as monkeys and tissues from TSC patients are needed in future studies. In addition, as mTORC1 inhibitors have been used to treat epilepsy in TSC patients, more detailed clinical data from patients responding to these drugs would also be helpful in elucidating the mechanisms.
A recent study of TSC patients suggested that dysfunction of SST-INs with decreased GABAAR-α1 expression are one of the causes of epileptic seizures [31]. Additionally, our research findings further suggested that the activation of mTORC1 in SST-INs within specific cortical layers, leading to a decrease in GABAAR-α1 expression, may be important for epileptogenesis in TSC. In TSC patients, it has been reported that GABAAR-α2 mRNA expression is increased, while GABAAR-α4 mRNA expression is decreased [31]. In addition, it has been suggested that autophagy controlled by mTORC1 activation regulates GABAA receptor expression [32]. Based on our experimental results and these findings, we suggest that mTORC1 inhibitors may be effective for TSC patients exhibiting reduced GABA signaling. Furthermore, since excessive mTORC1 activation has been reported to induce epilepsy associated with focal cortical dysplasia type IIb, this article contributes to an understanding of not only TSC but also epilepsy associated with mTORC1 activation [33].
CTCF: corrected total cell fluorescence
GABA: γ-amino butyric acid
GABAAR-α1: γ-amino butyric acid type A receptor subunit α1
H&E: hematoxylin and eosin
mTORC1: mechanistic target of rapamycin complex 1
PBS: phosphate-buffer saline
pS6: phosphorylated S6
S6: ribosomal protein S6
SD: standard deviation
SST-INs: somatostatin-expressing inhibitory neurons
TSC: tuberous sclerosis complex
Tsc2 cKO: Tsc2 conditional knockout
The supplementary material for this article is available at: https://www.explorationpub.com/uploads/Article/file/100664_sup_1.pdf.
We thank Ms. Tomoko Satomi, Mr. Mamoru Nakano, and Mr. Masami Isaka for their excellent technical assistance. We thank the staff at the Institute of Experimental Animal Sciences, Graduate School of Medicine at Osaka University for breeding, and the laboratory assistants at the Department of Dermatology, Graduate School of Medicine, Osaka University for technical assistance with mouse breeding, genotyping, and immunohistochemical staining.
FY: Conceptualization, Investigation, Data curation, Writing—original draft, Writing—review & editing. MKK: Conceptualization, Writing—review & editing, Validation. MF: Resources, Supervision, Validation, Writing—review & editing. MWK: Conceptualization, Resources, Supervision, Writing—review & editing. All authors read and approved the final version of the manuscript.
The authors declare that they have no conflict of interest.
The animal study was approved by the University of Osaka Animal Experiments Committee (approval no. dou-i-01-061-013), in accordance with the Guiding Principles for the Care and Use of Laboratory Animals.
Not applicable.
Not applicable.
The datasets generated and analyzed in this study are not publicly available but are available from the corresponding author upon reasonable request.
This work was supported in part by JSPS KAKENHI [JP21364075, 22K18392]; Health Labour Sciences Research Grant [23FC1037a]; and AMED [22ym0126809j0001]. The funders had no role in study design, data collection and analysis, decision to publish, or preparation of the manuscript.
© The Author(s) 2024.
Copyright: © The Author(s) 2024. This is an Open Access article licensed under a Creative Commons Attribution 4.0 International License (https://creativecommons.org/licenses/by/4.0/), which permits unrestricted use, sharing, adaptation, distribution and reproduction in any medium or format, for any purpose, even commercially, as long as you give appropriate credit to the original author(s) and the source, provide a link to the Creative Commons license, and indicate if changes were made.
Srilaxmi Vityala ... Swathi Nenavath
Joham Choque-Velasquez ... Alder Fernando Valenzuela-Rangel
Rene Ivan Gonzalez-Fernandez ... Jose Luis Hernandez-Caceres
Kabir Sheikh ... Jeffrey Raskin
Eva Žerovnik
Christine Walker, Chris L. Peterson
Swati Banerjee, Viktor Jirsa
Darrell O. Ricke
Jinwei Zhang
