Affiliation:
1State Key Laboratory of Animal Biotech Breeding, College of Animal Science and Technology, China Agricultural University, Beijing 100193, China
Affiliation:
1State Key Laboratory of Animal Biotech Breeding, College of Animal Science and Technology, China Agricultural University, Beijing 100193, China
Affiliation:
2Department of Molecular Biology and Biophysics, University of Connecticut Health, Farmington, CT 06030, USA
Affiliation:
1State Key Laboratory of Animal Biotech Breeding, College of Animal Science and Technology, China Agricultural University, Beijing 100193, China
Email: zhxb@cau.edu.cn
ORCID: https://orcid.org/0000-0002-5576-349X
Explor Neurosci. 2025;4:100669 DOI: https://doi.org/10.37349/en.2025.100669
Received: September 23, 2024 Accepted: December 23, 2024 Published: January 14, 2025
Academic Editor: Cecilia Giulivi, University of California Davis, USA
The article belongs to the special issue Mitochondria in Glia-neuron Crosstalk
Aim: Mitochondria are essential for brain development, and the presence of different mitochondrial types is called mitochondrial heteroplasmy. Mitochondrial dysfunction is a central aspect of many people’s neurological diseases. Heteroplasmy is commonly observed in eukaryotes due to mitochondrial genome (mtDNA) mutation, paternal leakage, mitochondria transplantation/mitotherapy, and somatic cell nuclear transfer (SCNT). In this study, we developed two novel approaches to construct mitochondrial heteroplasmy cellular models.
Methods: Model 1: the yak cell line (Bos grunniens) was transfected with p-eGFP-neo plasmid while mammary alveolar cell-T (MAC-T) cell line from cattle cells (Bos taurus) was stained with MitoTracker Deep Red FM. The yak cell line was used as recipient cells which fused with enucleated cattle cells. Model 2: The cattle cell line was stained with MitoTracker Green FM while yak cells were stained with MitoTracker Deep Red FM. Cattle cells were used as recipient cells which fused with enucleated yak cells. Following fusions, the single cells exhibiting dual positive fluorescence signals were sorted into 96-well plate by fluorescence-activated cell sorting. Confocal fluorescence examination confirmed that the cells with mitochondrial heteroplasmy were sorted.
Results: The two methods can generate a variety of mitochondrial heteroplasmy cells of interest which can aid in understanding the patterns and influencing factors underlying heteroplasmy changes.
Conclusions: The mitochondrial heteroplasmy cellular model contributes to managing heteroplasmy mitochondrial changes and preventing the development of mitochondrial declines.
In a cell, mitochondrial genomes (mtDNAs) may have the same composition, a state known as homoplasmy [1]. However, different mixes of mtDNAs may also exist due to spontaneous mutations [2], paternal leakage in a hybrid [3], and even in eukaryotic organisms resulting from mitochondria transplantation/mitotherapy [4, 5] and somatic cell nuclear transfer (SCNT) [6], which is termed as heteroplasmy.
The replication of mtDNA occurs throughout the cell cycle, leading to a dynamic and frequently changing level of heteroplasmy that varies across different cell types, tissues, and individuals [7, 8]. The extent of heteroplasmy typically ranges from 60% to 80%, depending on the symptoms and tissues associated with the phenotype. Heteroplasmy can be investigated at multiple levels, including the mitochondrial level [9], cellular level [10], tissue level [11], individual level, and population level [12].
At the present, association of mitochondrial dysfunction and progression of neurological disorders has gained significant attention. Defects in mitochondrial network dynamics, point mutations, deletions, and interaction of pathogenic proteins with mitochondria are some of the possible underlying mechanisms involved in these neurological disorders [13]. Due to the disruption of mitochondrial fusion and fission, mitochondrial morphology heterogeneity has emerged in several neurodegenerative diseases (NDD) [14]. Evidence-based researches indicate that mitochondrial heteroplasmy is a widespread phenomenon [15–20]. Consequently, in order to understand the impact of mitochondrial heterogeneity on neurological health, it is necessary to establish a cell model with heterogeneous mitochondrial DNA. The successful establishment of heteroplasmy cell models can enable the analysis of nuclear and mitochondrial adaptability in mitochondrial heteroplasmy or independent cells, and make known the functions of the heteroplasmy mitochondrial type and intact mitochondrial types.
In this study, we developed two cellular models for mitochondrial heteroplasmy using yak and cattle cell lines, which can be easily distinguished due to obvious species-specific mtDNA differences. The yak (Bos grunniens) is a bovine species native to the Qinghai-Tibet Plateau (QTP), which diverged from cattle (Bos taurus) about 4.9 million years ago [21]. The hybrids of the two bovine species typically exhibit heterosis, such as larger body size, faster growth rate, and higher production of milk and meat [22, 23], but also behave the examples of hybrid male sterility (HMS) [24].
Today many changes in mitochondrial functions beyond loss of ATP synthesis are associated with neurological disorders. It is important to study mitochondria at a subcellular level [25], considering that understanding the dynamics and development patterns of different mtDNAs within cells represents an intriguing biological problem. Currently, although mitochondrial heteroplasmy interventions have been shown to have the potential to rescue disease phenotype, there is no available report regarding the establishment of a heterogeneous cell model in bovine species. This study presents the mitochondrial heteroplasmy cellular models which are accurate, rapid, simple, and intuitive for the aims to guide their proper applications in different areas, especially in neurological disorders.
Yak fibroblast cell line (Yy) derived from the Datong yak breed (Bos grunniens) was generously provided by Dr. Jikun Wang, Southwest Minzu University, Chengdu, China. The bovine mammary alveolar cell-T (MAC-T, Cc) cell line obtained from Holstein dairy cattle (Bos taurus) was kindly gifted by Dr. Fengqi Zhao, University of Vermont, Burlington, USA. Cells were cultured in Dulbecco’s modified eagle medium (DMEM, Gibco, 11965092), supplemented with 10% fetal bovine serum (FBS, Gibco, A5670701), and maintained in 5% CO2/95% air at 37°C.
To achieve green fluorescence, Lipofectamine 3000 reagent (Invitrogen, L3000150) was used to transfect Yy cells at approximately 70% confluency with eGFP-neo plasmid (Beyotime, D2723-1 μg) in a 24-well plate. The transfection procedures were conducted in accordance with the manufacturer’s protocol. Cells were transfected with 0.5 μg of plasmid per well, and the incubation period was set at 15 min. After 48 h of incubation, Yy cells were examined for green fluorescence using confocal microscopy (Nikon, A1 HD25, Japan).
To achieve mitochondrial staining, a 50 μg MitoTracker stock solution was diluted with 1 mL anhydrous dimethylsulfoxide (DMSO), followed by the addition of DMEM to achieve the desired final working concentration (Table 1). Subsequently, a total of 1 × 10⁷ Cc cells were stained with 300 nM MitoTracker Green FM dye, while both 1 × 10⁷ Cc and Yy cells were stained with 500 nM MitoTracker Deep Red FM dye. All stained cells were incubated for 30 min at 37°C. After incubation, cells were washed twice with prewarmed (37°C) Dulbecco’s phosphate-buffered saline (DPBS) before the addition of prewarmed culture medium.
Description of dyes for MitoTracker Green FM and MitoTracker Deep Red FM
| Dye | Manufacturer | Target organelle | Excitation wavelength | Emission wavelength | Stock | Dilution used |
|---|---|---|---|---|---|---|
| MitoTracker Green FM | Thermo Fischer Scientific (catalog No. M7514) | Mitochondria | 490 nm | 516 nm | 50 μg in 1 mL DMSO | 300 nM (diluted in pre-warmed DMEM) |
| MitoTracker Deep Red FM | Thermo Fischer Scientific (catalog No. M22426) | Mitochondria | 644 nm | 665 nm | 50 μg in 1 mL DMSO | 500 nM (diluted in pre-warmed DMEM) |
DMEM: Dulbecco’s modified eagle medium; DMSO: dimethylsulfoxide
The culture medium was supplemented with an additional 50 µg/mL of uridine (Solarbio, 58-96-8) and 1 mM of pyruvate (Solarbio, 113-24-6). Subsequently, the mixture was combined with an equal volume of percoll isolation solution (Solarbio, 65455-52-9) and incubated overnight in a cell incubator. After incubation, cell enucleation working solution was prepared by adding 20 μg/mL of cytochalasin B (Solarbio, 14930-96-2). Cc and Yy cells at 80% confluency in a culture dish were collected and resuspended in 25 mL of the working solution in an ultracentrifugation tube (Beckman, 344057). The tube was then placed into an ultracentrifuge (Beckman, XE-100, USA) and centrifugated at 44,000 g, 37°C for 70 min. After centrifugation, a distinct band indicating successful separation could be observed in the solution. This band was carefully transferred to a new 50 mL centrifuge tube, followed by the addition of ten times the volume of culture medium. Then further centrifuged at 5,000 g for 3.5 min. The cells were resuspended in 1 mL pre-warmed DMEM medium and counted by a cell counter (RWD, C100-SE, China). Subsequently, 106 Yy cells were mixed with 106 enucleated Cc cells while 106 Cc cells were mixed with 106 enucleated Yy cells in a 15 mL centrifuge tube. The mixture was then centrifuged at 500 g for 5 min, followed by addition of 100 μL of 50% polyethylene glycol (PEG). After gentle suspension, the mixture was incubated at 37°C for 1 min to facilitate fusion which was subsequently terminated by the addition of culture medium (10 mL). The cells were then cultured in an incubator [26].
Before performing fluorescence-activated cell sorting (FACS), the following types of samples were prepared:
Unstained sample: Cc cells that were not subjected to any staining procedure.
Single color control samples for compensation purposes: Yy cells expressing GFP, Cc cells stained with MitoTracker Green FM, and both Cc and Yy cells stained with MitoTracker Deep Red FM.
Two-color stained samples: after cell fusion, the surviving cells in the culture dish exhibited dual-color staining.
All samples were collected. Following this, 1 mL of pre-warmed DMEM was evenly distributed by blowing and passed through a 40 μm filter into a 5 mL flow tube (BD Falcon, 352235). FACS was performed using FACSAria Fusion instrument (BD, FACSARIA III, USA), which is equipped with four lasers (488 nm, 640 nm, 405 nm, and 355 nm) and 15 detectors. With the inclusion of the BD automated cell deposition unit (ACDU, BD, FACSARIA III, USA) device, cells can be quantitatively sorted into individual wells in a 96-well plate.
Unstained samples were utilized to optimize side scatter (SSC) and forward scatter (FSC) voltages, while the single staining control was employed to exhibit positive signals. MitoTracker Green FM positive cells were detected using a blue laser and fluorescein isothiocyanate (FITC, Invitrogen, M46752) detector, whereas MitoTracker Deep Red FM positive cells were detected using a red laser and allophycocyanin (APC, Invitrogen, M46750) detector (Table 2). To acquire dual-positive cells, the selection of MitoTracker Deep Red-positive cells was based on the presence of MitoTracker Green-positive signal. The dual-positive cells can be sequentially sorted into preheated culture medium-filled wells in 96-well plates, with each well containing only one cell. Dual-positive cells resulting from fusion between Yy cells and enucleated Cc cells were referred to as Yyc cells, while those resulting from fusion between Cc cells and enucleated Yy cells were referred to as Ccy cells.
Laser and detector settings for MitoTracker Green FM and MitoTracker Deep Red FM
| Stain | Laser | Detector | Detection wavelength |
|---|---|---|---|
| MitoTracker Green FM | Blue laser (488 nm) | FITC | 515–545 nm |
| MitoTracker Deep Red FM | Red laser (640 nm) | APC | 655–685 nm |
APC: allophycocyanin; FITC: fluorescein isothiocyanate
The cells were cultured in 96-well plates for one or two days. Cell fluorescence was observed and captured using super-resolution confocal laser scanning microscopy (CLSM, A1HD25, Nikon, Japan). This microscope is equipped with six lasers (405 nm, 445 nm, 488 nm, 514 nm, 561 nm, and 647 nm) and multiple fluorescence channels. The appropriate laser wavelength for fluorescence imaging was selected. The subsequent transition to confocal mode facilitated the capture of high-resolution images featuring distinct fluorescence signals. Finally, a scale bar was added to the image before outputting.
After a single cell in the well underwent proliferation and formed a clone, polymerase chain reaction (PCR) identification was performed using 5,000 to 10,000 cells from the clone. PCR was performed using the DirectAmp Animal Tissue PCR Kit (Aidlab, PC5301), where the lysis solution was prepared by combining buffer AD1 and double-distilled H2O (ddH2O) in a ratio of 1:9. Each clone received 75 μL of the lysis solution and was thoroughly mixed. The cells were lysed at 98°C for 5 min, rapidly cooled on ice, and then supplemented with 75 μL of buffer AD2. This resulting mixture served as a direct template for PCR amplification. The partial mitochondrial sequence was amplified in a total volume of 25 μL buffer containing 12.5 μL of 2 × DirectAmp PCR Mix, 0.5 μL each forward and reverse primers [27] [10 μM; forward primer: from nucleotide (nt) 682 to nt 701, 5’-GGTCATACGATTAACCCAAG-3’; reverse primer: from nt 1,802 to nt 1,821, 5’-TGGACAACCAGCTATCACCA-3’], along with 4 μL template and 7.5 μL ddH2O with the following program: 95°C for 5 min, followed by 40 cycles of 94°C for 30 s, 53°C for 30 s and 72°C for 70 s. PCR products were sequenced by Sangon Biotech while validation of mtDNA sequences were performed using SnapGene Viewer software (version 4.1.8).
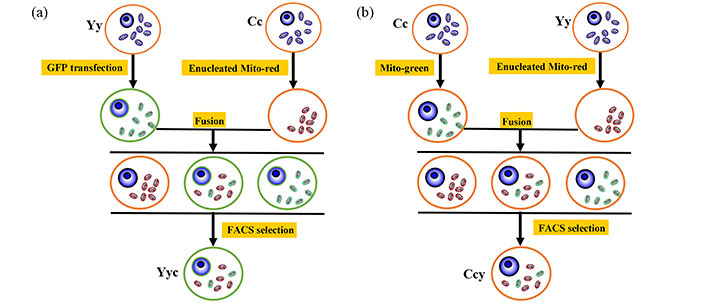
The technical methodology utilized in this study is depicted in Figure 1, illustrating the approximate approach to obtain the mitochondrial heteroplasmy models.

The strategy for construction of mitochondrial heteroplasmy models. (a) Model 1: Yy cells were transfected with p-eGFP-neo plasmid while mitochondria from Cc cells were labeled with MitoTracker Deep Red FM. Cell fusion and FACS selection were performed to obtain a Yyc cell. (b) Model 2: Cc cells were labeled with MitoTracker Green FM, whereas mitochondria from Yy cells were stained with MitoTracker Deep Red FM. Following cell fusion and FACS selection, a Ccy cell was obtained. Y and y denote the nucleus and mitochondria of the yak cell, respectively, while C and c represent the nucleus and mitochondria of the cattle cell. FACS: fluorescence-activated cell sorting
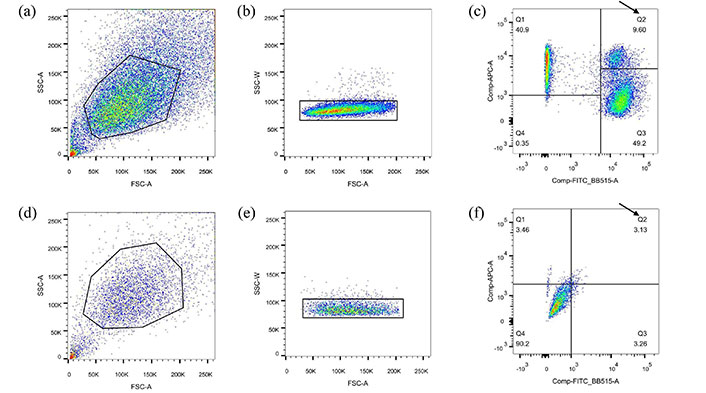
Based on the intensity exceeding 103, mitochondrial staining in a single positive cell can be considered indicative of positive staining. As Yy and Cc cells serve as recipients during cell fusion, it is essential to gate the dual-positive signal cells located in the Q2 region of Figure 2. Compared to Model 2, Model 1 generates a higher proportion of fluorescence signals. Subsequently, these gated cells were individually sorted into the 96-well plate in a sequential order, with each well containing only one cell.

Separating and sorting of Yyc cells (a–c) and Ccy cells (d–f) using FACS. (a–c): Model 1. (d–f): Model 2. Cells with appropriate cell size were selected based on FSC and SSC parameters, as indicated by gates in panels (a) and (d). The A signal is affected by multiple factors that can interfere with the measurement. Select individual cells within the W signal gating region and plot them in figures (b) and (e). The single cell positive for MitoTracker Green FM and MitoTracker Deep Red FM were identified using fluorescence intensity dot plots of FITC and APC, as shown in panels (c) and (f). The arrow indicates the Q2 region. Y and y denote the nucleus and mitochondria of the yak cell, respectively, while C and c represent the nucleus and mitochondria of the cattle cell. APC: allophycocyanin; FACS: fluorescence-activated cell sorting; FSC: forward scatter; SSC: side scatter
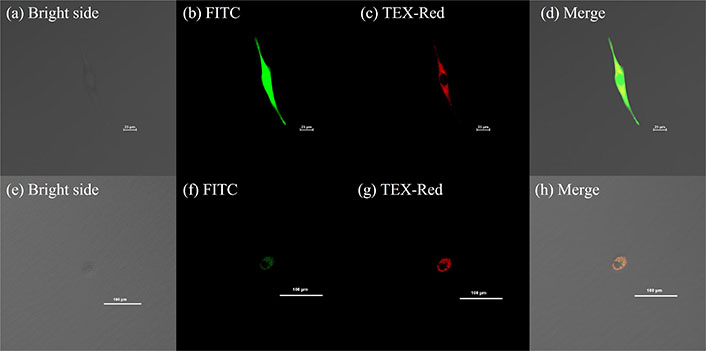
The Yyc cell exhibited overall green fluorescence and cytoplasmic red fluorescence, while the Ccy cell displayed cytoplasmic red and green fluorescence that appeared yellow upon superposition (Figure 3). Consequently, both Yyc and Ccy cell represents mitochondrial heteroplasmy with a combination of cattle and yak mitochondria.

Fluorescence observations of single cells harbored with two types of mitochondria. (a–d) For Yyc cell, GFP fluorescence (FITC) was visualized in green, while cattle mitochondria were stained with MitoTracker Deep Red FM (TEX-Red) and appeared in red. A composite view merging all images together was also obtained. The scale bar represents 25 μm. (e–h) In the case of Ccy cell, cattle mitochondria were labeled with MitoTracker Green FM (FITC) and exhibited green fluorescence, whereas yak mitochondria were stained with MitoTracker Deep Red FM (TEX-Red) and displayed red fluorescence. Similarly, a composite view combining all images was generated. The scale bar corresponds to 100 μm. Y and y denote the nucleus and mitochondria of the yak cell, respectively, while C and c represent the nucleus and mitochondria of the cattle cell. FITC: fluorescein isothiocyanate
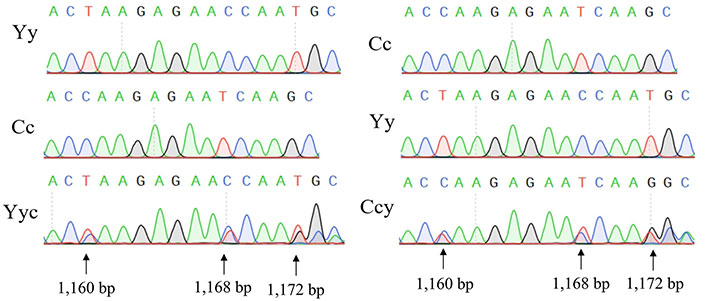
After cell lysis, the mtDNA sequence was amplified using PCR. The mtDNA sequences of Cc cells and Yy cells were consistent with previous research [27]. Subsequent sequencing analysis revealed an overlapping peak map, indicating the presence of two distinct types of mtDNA within the Yyc and Ccy cells (Figure 4), thereby confirming mitochondrial heteroplasmy.

Identification of mitochondrial heteroplasmy in Yyc and CcY cell lines. Three heteroplasmy sites were indicated by arrows. Y and y denote the nucleus and mitochondria of the yak cell, respectively, while C and c represent the nucleus and mitochondria of the cattle cell
With the advancement of imaging technology, organelles can now be detected and visualized under a microscope using fluorescent probes. These probes offer numerous advantages, such as high specificity, biocompatibility, simplicity in operation without requiring further transfection, and ease of fluorescence emission through molecular engineering for studying biological systems [28–31]. MitoTracker probes are commonly employed to label mitochondria, which allows passive diffusion across the plasma membrane and accumulates within active mitochondria [32].
In this study, MitoTracker Green FM and MitoTracker Deep Red FM were employed for mitochondrial labeling. Both dyes are carbocyanine-based and are known for their user-friendly nature. MitoTracker Deep Red FM is particularly suitable for various color labeling experiments due to its distinct red fluorescence, which can be easily distinguished from the green fluorescence emitted by other dyes [32]. The superior fluorescence intensity and resolution of this dye make it ideal for both FACS and CLSM techniques, ensuring accurate and intuitive sorting as well as observation, despite a gradual decrease in fluorescence over time. Studies have shown that Mitotracker dyes can transfer between different cell types and between mitotic deficient and wild-type cells [33]. In the following experiment, mtDNA sequencing of Cc and Yy cells is ultimately the determinant (Figure 4). A higher concentration of mitotracker was selected for use in this study. FACS enables rapid counting and sorting of cells into microwells at a rate of approximately 10,000 cells per second [34]. Despite the large number of cells used, target cells can be isolated within a short period with one cell per well. CLSM is considered one of the most crucial devices in the field of fluorescence imaging [35], capable of generating high-quality images with exceptional resolution [36]. However, prolonged confocal laser irradiation may cause cellular damage; hence, lower laser intensities should be utilized to complete the acquisition of fluorescent images promptly. Both cell models can obtain mitochondrial heterogeneity cells. Compared to Model 2, Model 1 provides simpler steps. Due to GFP transfection, Model 2 requires longer processing time, resulting in a higher proportion of heteroplasmy cells (Figure 2). The vital question is the challenges of the dynamic changes of heteroplasmy mitochondrial type, which is changing over time by bottleneck when mitochondrial fussed, and may affect the reliability and reproducibility of the models.
NDDs are a heterogeneous group of disorders, including Alzheimer’s disease (AD), Parkinson’s disease (PD), amyotrophic lateral sclerosis (ALS), and Huntington’s disease (HD) [37]. It is well accepted that dysfunction of mitochondria underlies the pathogenesis of NDDs, mitochondria are the preferred target for intervention of NDDs [38]. We argue that mitochondrial involvement is likely to be an important common theme in these diseases. Most, if not all, humans contain multiple mtDNA genotypes (heteroplasmy); specific patterns of variants accumulate in different tissues, including cancers, over time; and some variants are preferentially passed down or suppressed in the maternal germ line [39]. For these diseases, heteroplasmy cells containing disease-causing mitochondria can be engineered to investigate their alterations and the impacts of various factors or drugs on mitochondrial variants. In rare instances, the shift in heteroplasmy can be dramatic, and, if pathogenic, higher heteroplasmy levels can cause mitochondrial disease [40]. They can also simulate the changes in mitochondria following hybridization events such as distantly related hybridizations that enable the study of mitonuclear interactions and the specific effects of heteroplasmy in cells. Furthermore, they offer opportunities for identifying strategies to eliminate donor cell mitochondria or enhance transplanted mitochondria proliferation in SCNT and mitochondrial transplantation.
In conclusion, the study delineates two novel methodologies for constructing mitochondrial heteroplasmy cells, which can be employed to investigate the factors and genes influencing mitochondrial alterations. Moreover, targeting mitochondrial dysfunction and its role in various neurological diseases offers an opportunity. By intervening in these processes, we can potentially prevent cellular pathologies and alleviate illnesses. This opens up exciting new possibilities for therapeutic targets.
APC: allophycocyanin
CLSM: confocal laser scanning microscopy
ddH2O: double-distilled H2O
DMEM: Dulbecco’s modified eagle medium
FACS: fluorescence-activated cell sorting
FITC: fluorescein isothiocyanate
mtDNAs: mitochondrial genomes
NDDs: neurodegenerative diseases
nt: nucleotide
PCR: polymerase chain reaction
SCNT: somatic cell nuclear transfer
We thank Dr. Fei Gao, China Agricultural University, for the assistance of FACS. She provided all technical support in the correct operation and use of the instrument.
YH: Methodology, Formal analysis, Investigation, Writing—original draft. LJ: Methodology, Visualization, Writing—original draft. WL: Methodology, Investigation. XZ: Conceptualization, Methodology, Writing—review & editing, Funding acquisition.
The authors declare that they have no known competing financial interests or personal relationships that could have appeared to influence the work reported in this paper.
Not applicable.
Not applicable.
Not applicable.
All other data are available from the corresponding author upon reasonable request.
This research was funded by National Key Research and Development Program of China [2021YFF1000701]. The funder had no role in study design, data collection and analysis, decision to publish, or preparation of the manuscript.
© The Author(s) 2025.
Open Exploration maintains a neutral stance on jurisdictional claims in published institutional affiliations and maps. All opinions expressed in this article are the personal views of the author(s) and do not represent the stance of the editorial team or the publisher.
Copyright: © The Author(s) 2025. This is an Open Access article licensed under a Creative Commons Attribution 4.0 International License (https://creativecommons.org/licenses/by/4.0/), which permits unrestricted use, sharing, adaptation, distribution and reproduction in any medium or format, for any purpose, even commercially, as long as you give appropriate credit to the original author(s) and the source, provide a link to the Creative Commons license, and indicate if changes were made.
View: 3401
Download: 28
Times Cited: 0
