 Original Article

Affiliation:
Orvis School of Nursing, University of Nevada Reno, Reno, NV 89557, USA
Email: eholston@unr.edu
ORCID: https://orcid.org/0000-0003-4268-6330
Explor Neurosci. 2025;4:100677 DOI: https://doi.org/10.37349/en.2025.100677
Received: December 10, 2024 Accepted: February 24, 2025 Published: March 24, 2025
Academic Editor: Ryszard Pluta, Medical University of Lublin, Poland
The article belongs to the special issue Alzheimer's Disease
Aim: Alzheimer’s disease (AD) is associated with several electrophysiological biomarkers. These biomarkers are associated with global decline in cognition and a diagnosis of AD. However, a specific electrophysiological biomarker is not characterized as normal-functioning older adults convert to AD. The longitudinal retrospective study was conducted to describe an electrophysiological biomarker indicator for AD as normal-functioning older adults convert to a diagnosis in the AD continuum over a 2-year period.
Methods: The study was conducted with 54 community-residing older adults, ranging from normal functioning to a diagnosis of AD. All initial and follow-up electrophysiological evaluations were completed in the New York University Brain Research Laboratories, and overall decline assessments with the Global Deterioration Scale (GDS) were completed in the New York University Aging and Dementia Research Center. Data included measurements from the GDS and raw resting-state electroencephalogram (rsEEG), which was transformed into quantitative EEG (qEEG) data. Data analysis consisted of descriptive statistics and a Kruskal-Wallis test. The level of significance was 0.05 with a moderate effect size. Topographic brain images displayed electrophysiological biomarkers.
Results: A consistently increasing rsEEG theta frequency (P ≤ 0.01) occurred as normal-functioning older adults converted to AD across all GDS stages from the frontal to posterior regions with the progressive global decline. No discernible consistent electrophysiological changes were observed for rsEEG delta, alpha, or beta frequencies over all GDS stages. The GDS stages differed at baseline and follow-up (P ≤ 0.01). The rsEEG theta frequency increased with the progressive global decline across the GDS stages.
Conclusions: The consistently increasing rsEEG theta frequency may be an electrophysiological biomarker indicator for AD from normal functioning to a diagnosis within the AD continuum. This biomarker will enhance the assessment of the risk, onset, and progression of AD and potentially inform the treatment of AD.
Alzheimer’s disease (AD) is the most prevalent type of dementia worldwide with over 50 million persons living with diagnoses within the AD continuum [1]. By 2030, the global prevalence is estimated to reach 78 million [1]. In the United States (US) alone, there are currently 19 million persons living with diagnoses within the AD continuum (preclinical, prodromal, and early stages of AD) with an estimate of 25 million by 2030 [2, 3]. Furthermore, AD is the 7th leading cause of death in the US [4]. The cost of caring for persons with AD in the US was $360 billion in 2024, clearly illustrating that AD is a public health issue [5].
Since 1980s, the onset and progression of AD have been characterized by electrophysiological biomarkers. These biomarkers are resting-state electroencephalogram (rsEEG) delta (1.5–3.5 Hz), theta (3.5–7.5 Hz), alpha (7.5–12.5 Hz), and beta (12.5–25 Hz) frequencies [6, 7]. A diagnosis of AD correlates to increased rsEEG theta with a decreased rsEEG alpha [8–12] while the progressing severity is associated with an increased rsEEG delta and theta [11]. An increased rsEEG theta relates to increased cognitive decline indicative of mild cognitive impairment (MCI) or prodromal AD whereas an increased rsEEG delta relates to the stages of moderate to severe AD [13–15]. A decreased rsEEG theta relates to decreased word processing skills, which was also indicative of MCI [16]. An increased rsEEG theta occurred when normal-functioning older adults converted to MCI within 7 years [7]. Physiologically, certain electrophysiological biomarkers are associated with decreased glucose metabolism [17], hypoperfusion [18], and hippocampal atrophy [19].
Electrophysiological biomarkers are useful in differentiating AD from vascular dementia [20], frontotemporal lobar dementia [21], dementia with Lewy bodies [22], and major depression [23]. However, electrophysiological biomarkers did not differentiate frontotemporal lobar dementia from AD with equanimity in the severity of the illnesses [24].
Significant associations are reported between electrophysiological biomarkers and symptoms and/or biologic processes indicative of AD since the mid-2010s. These symptoms and/or biologic processes are indicative of facial recognition, word recognition and/or recall, and the level and progression of cognitive impairment. The increased rsEEG theta with decreased rsEEG alpha is related to an increase in the progression of cognitive impairment and cognitive decline [15, 25]. An increased rsEEG theta correlated to decreased word comprehension and poor recognition of facial expression, both tasks relate to neural activity [16, 22, 26]. These results contribute to the continued investment in the goal of integrating and operationalizing biomarkers in clinical practice [27].
Only a change in rsEEG theta is consistently reported in persons living with a condition within the AD continuum. An increased rsEEG theta is reported as the earliest biomarker in the AD continuum [28]. Changes in rsEEG theta are observed in the parieto-occipital regions [29], the centro-parietal regions [28, 30], and temporo-occipital regions [28] of persons with AD. This biomarker differentiated normal-functioning older adults from those with prodromal and probable AD [28].
Measuring changes in electrophysiological biomarkers is strengthened with the use of other biomarkers [i.e., β-amyloid, tau (τ), and neuroinflammation markers] [31–33]. These biomarkers have historically been used to describe the physiology of AD [31, 33]. They contribute to physiological changes that impact the neural activity within and across neurons, altering the brain’s electrophysiology that is measurable with electrophysiological biomarkers, especially the pattern of oscillation [34, 35]. These biologic biomarkers contribute significantly to the understanding of the pathophysiology related to electrophysiological biomarkers and their association with the risk, onset, and progression of AD.
Nevertheless, a specific electrophysiological biomarker has not been routinely observed as a consistent electrophysiological indicator for the risk of AD in normal-functioning older adults and their conversion to diagnoses within the AD continuum. Identifying such a biomarker has clinical significance in assessing the risk and onset of AD as older adults decline from normal functioning to diagnoses within the AD continuum. Therefore, the purpose of this retrospective analysis was to characterize an electrophysiological biomarker indicator for AD as older adults decline in their global presentation from normal functioning to AD over a 2-year period.
A retrospective, descriptive design was used to analyze extracted data from 54 participants. The extracted data were from two databases with information related to AD, one for electrophysiological data and the other for clinical data. The databases resulted from a collaborative agreement between two research laboratories in a northeast metropolitan city. Participants provided electrophysiological data after providing the clinical data. The present study, a secondary analysis, was approved and received exemption status from the institutional review boards (IRBs) for New York University and New York University School of Medicine. This secondary analysis has ethical approval for informed consent exemption from New York University and New York University School of Medicine.
The extracted baseline (BL) and follow-up (FU) data were analyzed collectively. The FU data had a minimum of two years post-BL. A two-year time interval between BL and FU was selected to ensure enough time for the conversion from normal functioning to diagnoses within the AD continuum, facilitating the identification and analysis of the electrophysiological biomarkers. The median time from BL to FU was 4 years (range = 2–14 years) for the extracted data. There was minimal variability in the data collection over the follow-up period. The procedures/protocols, equipment, and assessment tool were consistently maintained. The software quantifying the rsEEG data was assessed annually to ensure accuracy and consistency. The EEG technicians and clinicians were the same with the same director of the Brain Research Laboratories overseeing data collection over the follow-up period. Therefore, the data obtained from participants over the years was methodologically consistent.
The sample consisted of 54 older adults who were either normal functioning or diagnosed with prodromal AD or an early stage of AD at BL. The sample had a mean age of 67.3 ± 8.1 (range = 53–85). A diagnosis of dementia of the Alzheimer type (DAT) was based on the Diagnostic and Statistical Manual of Mental Disorders, 4th edition (DSM IV) [36] and probable AD according to the National Institute of Neurological and Communicative Disorders and Stroke and the Alzheimer’s Disease and Related Disorders Association (NINCDS-ADRDA) criteria [37]. The sample was grouped according to the stages of the Global Deterioration Scale (GDS). Exclusion criteria included history of head trauma, substance abuse, signs of abnormal structural brain pathology, diagnosis of delirium, depression, or vascular dementia, and failure to discontinue any psychotropic or other cognitive-acting medication at least 2 weeks prior to the evaluation period.
The GDS [38] categorized the sample by overall cognitive decline from normal functioning to a diagnosis of AD. The GDS is a reliability and validity scale to measure the decline of AD [39]. The GDS consists of seven stages. Stage GDS 1, normal functioning, relates to the absence of any subjective complaints or evidence of objective complaints about cognitive impairment. Stage GDS 2, preclinical or early MCI, relates to subjective complaints without evidence of objective cognitive impairment. Stage GDS 3, prodromal or MCI, relates to mild complaints of objective cognitive impairment. Stages GDS 4–GDS 7 meet the DSM IV criteria for DAT. They range from mild AD to severe AD with increasing severity.
Brain activity changes were measured with the EEG. The raw rsEEG data were quantified with Neurometrics [40]. The electrophysiological biomarkers were characterized as rsEEG delta (1.5–3.5 Hz), theta (3.5–7.5 Hz), alpha (7.5–12.5 Hz), and beta (12.5–25 Hz) frequencies [6, 7]. Neurometrics is a reliable method for quantifying the raw rsEEG data from normal-functioning older adults and those with AD [40].
A population-based normative database was used to determine the changes in the electrophysiological biomarkers (rsEEG delta, rsEEG theta, rsEEG alpha, and rsEEG beta frequencies). Using a normative database obviates the need for a control group since the database consists of the biomarkers of individuals without any pathology and from the general population. This normative database is reliable, replicable, and ethnic-free for normal-functioning older adults to those living with a diagnosis within the AD continuum [41]. The normative database is also reliable when determining the changes in the electrophysiological biomarkers for schizophrenia [41], obsessive-compulsive disorder [41], and depression [23].
Participants were assessed by healthcare providers and researchers. These assessments included medical [physical examination, electrocardiogram (EKG), and blood analysis], neurological (assessment of speech, motor system, cranial nerves, sensory function, and extrapyramidal signs), and psychiatric evaluations (psychiatric interview, neuropsychological tests, and cognitive evaluations). Some participants additionally received magnetic resonance imaging (MRI) or computed tomography (CT) imaging to determine if neuropathological changes have occurred. Participants or family members provided medical history, current medications, family history of dementia, and symptoms’ onset, course, and duration.
Participants were seated in a light-attenuated, soundproof room. Nineteen standard Ag/AgCl recording electrodes were attached to the scalp using water-soluble paste, according to the 10/20 International System: Fp1, Fp2, F3, F4, C3, C4, P3, P4, O1, O2, F7, F8, T3, T4, T5, T6, Fz, Cz, and Pz (see Figure 1) [40].
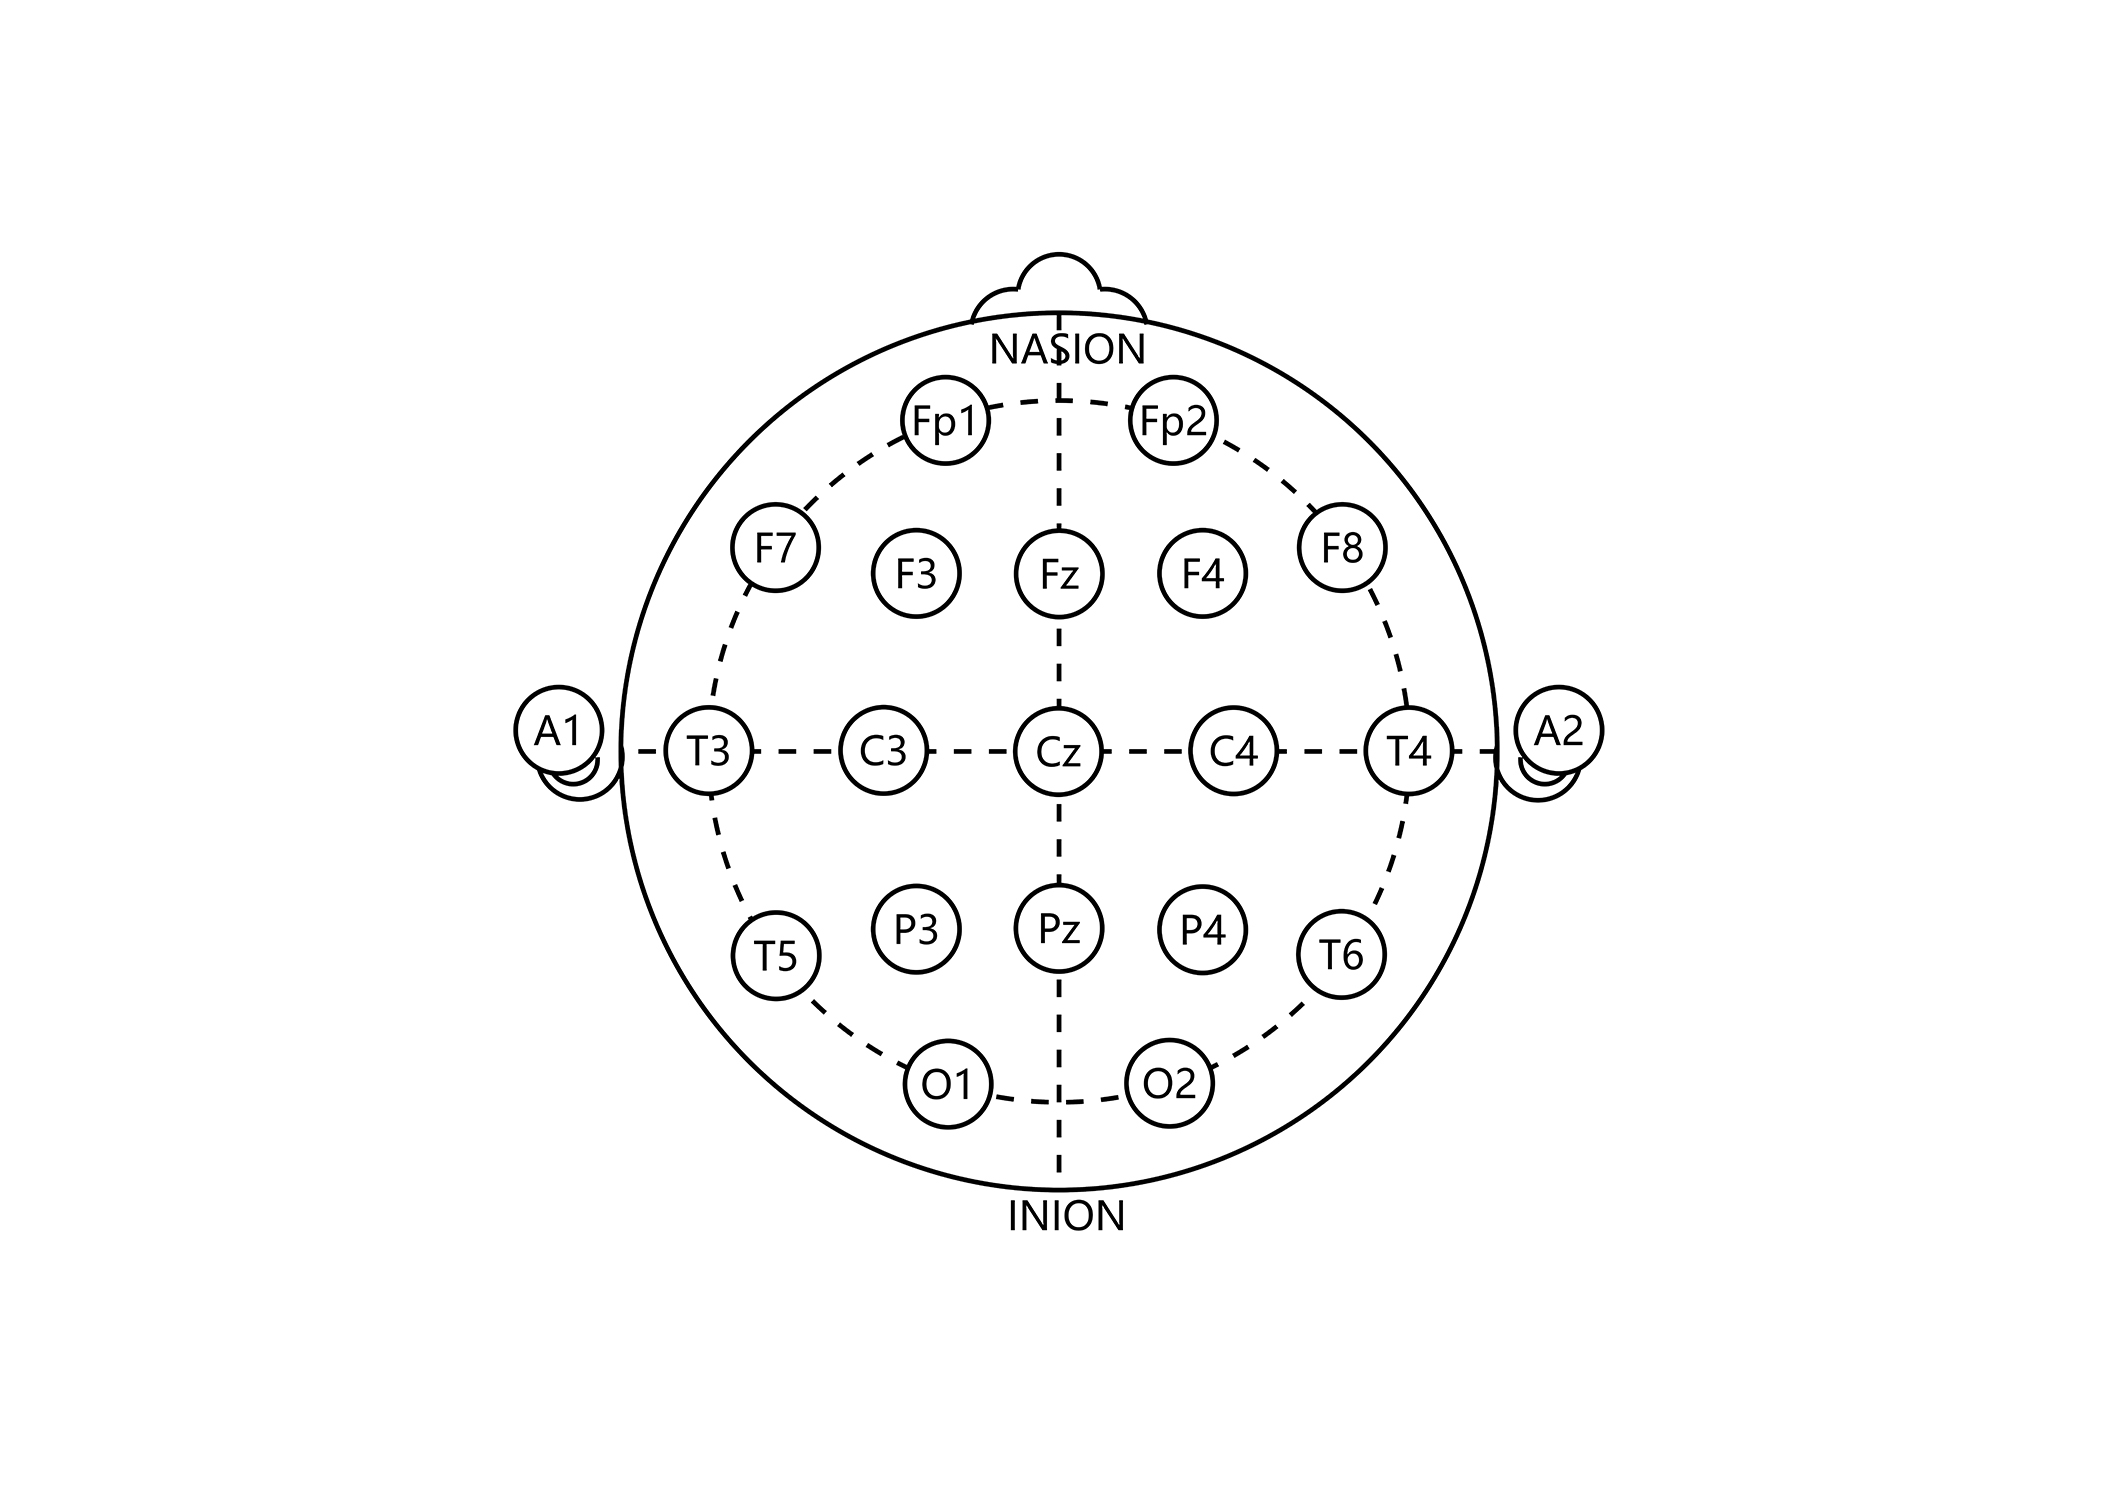
The 10/20 International System for electrode placement in electroencephalogram. The electrode placement indicates the cortical area for the recording of the brain activity. Frontal cortical area = Fp1, Fp2, F3, F4, F7, F8, Fz. Temporal cortical area = T3, T4, T5, T6. Parietal cortical area = C3, C4, Cz, P3, P4, Pz. Occipital cortical area = O1, O2. Reference electrode: A1 = left ear; A2 = right ear
Electro-oculogram electrodes (differential eye channels) were diagonally placed above and below the eyes’ orbit [40] to detect eye movement artifacts. An additional electrode was placed on the thorax to detect cardiac rhythm (EKG). A grounding electrode was placed on the dominant arm. Recordings were collected and referenced to linked earlobes. The EEG amplifiers had a bandpass from 0.5 to 30 Hz (3 dB points) with a 60 Hz notch-filter. Impedances were maintained below 5,000 ohms. The data was digitized with the A/D converter at 200 Hz with 12-bit resolution. Data acquisition was performed on a Spectrum 32 EEG Acquisition System (Cadwell Laboratories, Kennewick, WA.)
Trained EEG technicians collected 20 minutes of eye-closed raw EEG data while the participant remained at rest. This is also known as rsEEG data. The EEG technicians monitored the participant and the EEG recording for artifacts such as sleepiness, muscle movement, or eye movement. The EEG technicians visually edited EEG data for the artifacts because they may affect the quantitative EEG (qEEG) analysis. This quality check procedure was supplemented with an automatic EEG artifact detection algorithm. From the 20 minutes of collected rsEEG data, only 1–2 minutes (24–48 artifact-free epochs, 2.5 seconds long) were randomly selected for qEEG analysis.
All 19 monopolar derivations, absolute (ABS) power, relative (REL) power, mean frequency (MMF), inter- and intra-hemispheric coherence, bilateral symmetry, and intra-hemispheric gradients of power (qEEG dimensions) were computed and characterized as rsEEG delta (1.5–3.5 Hz), rsEEG theta (3.5–7.5 Hz), rsEEG alpha (7.5–12.5 Hz), rsEEG beta (12.5–25 Hz), and total power. Neurometrics is previously described in detail [40]. The essential features are briefly provided. Power spectral analysis was performed on the artifact-free raw rsEEG data using Fast Fourier Transform (FFT) and log transformation to achieve Gaussianity [40]. Univariate analysis was used to statistically evaluate the relative distributions of every biomarker [40]. Age regressions were used to control for any variance from age [40], and Z-transformation was used to standardize the values relative to age-expected normal values. The Z-transformation includes this step:
Data were analyzed with SPSS 28.0 (Windows). The study had a power of 0.80 to detect a moderate effect size at an a priori alpha of 0.05 (adjusted for post-hoc analyses). Parametric and nonparametric statistics were used to analyze the data distribution, demographics, and electrophysiological biomarkers, all at BL and FU. Descriptive statistics were used to characterize age and gender. Kruskal-Wallis test was used to analyze the difference among the GDS stages, age, and gender at BL and FU. Group average topographic brain images were only used to display the distribution of electrophysiological biomarkers.
The sample consisted of 23 males (43%) and 31 females (57%) with an average age of 67.3 ± 8.1 (range = 53–85) (see Table 1). At BL, 21 (39%) participants were normal functioning (GDS 1 and GDS 2), 20 (37%) diagnosed with MCI (GDS 3), and 13 (24%) diagnosed with probable AD (GDS 4 and GDS 5). Age and gender were not significantly different across GDS stages (age: χ2 = 0.94, df = 4, P ≥ 0.7; gender: χ2 = 1.5, df = 4, P ≥ 0.83).
Demographics at baseline with mean age (± SD)
| Variables | Entire sample | GDS 1 | GDS 2 | GDS 3 | GDS 4 | GDS 5 |
|---|---|---|---|---|---|---|
| Sample, n | 54 (100%) | 4 (7%) | 17 (32%) | 20 (37%) | 10 (18%) | 3 (6%) |
| Age | 67.3 ± 8.1 | 66.7 ± 6.2 | 68 ± 7.8 | 66.2 ± 8.3 | 67.8 ± 8.1 | 68 ± 14.7 |
| Male, n | 23 (43%) | 2 (9%) | 7 (30%) | 9 (39%) | 3 (13%) | 2 (9%) |
| Age (male) | 68.9 ± 8.6 | 71.5 ± 4.9 | 68.6 ± 8.6 | 65.9 ± 8.8 | 74 ± 6.2 | 74 ± 15.6 |
| Female, n | 31 (57%) | 2 (6%) | 10 (32%) | 11 (36%) | 7 (23%) | 1 (3%) |
| Age (female) | 66 ± 7.6 | 62 ± 0.0 | 68.2 ± 7.7 | 66.4 ± 8.3 | 65 ± 7.6 | 57 ± 0.0 |
SD: standard deviation; GDS: Global Deterioration Scale
The brain images indicate that only ABS rsEEG theta and REL rsEEG theta electrophysiological biomarkers were increasing across the GDS stages from the frontal to the posterior region (P ≤ 0.01) of the head (see Figure 2). The MMF rsEEG delta significantly increased from GDS 4 and 5 (P ≤ 0.01) while the ABS total power and REL rsEEG alpha remained within normal ranges. The absence of a significant change in REL rsEEG theta from REL rsEEG alpha suggests that the increasing rsEEG theta is not a result of a decrease in rsEEG alpha-it is an independent process.
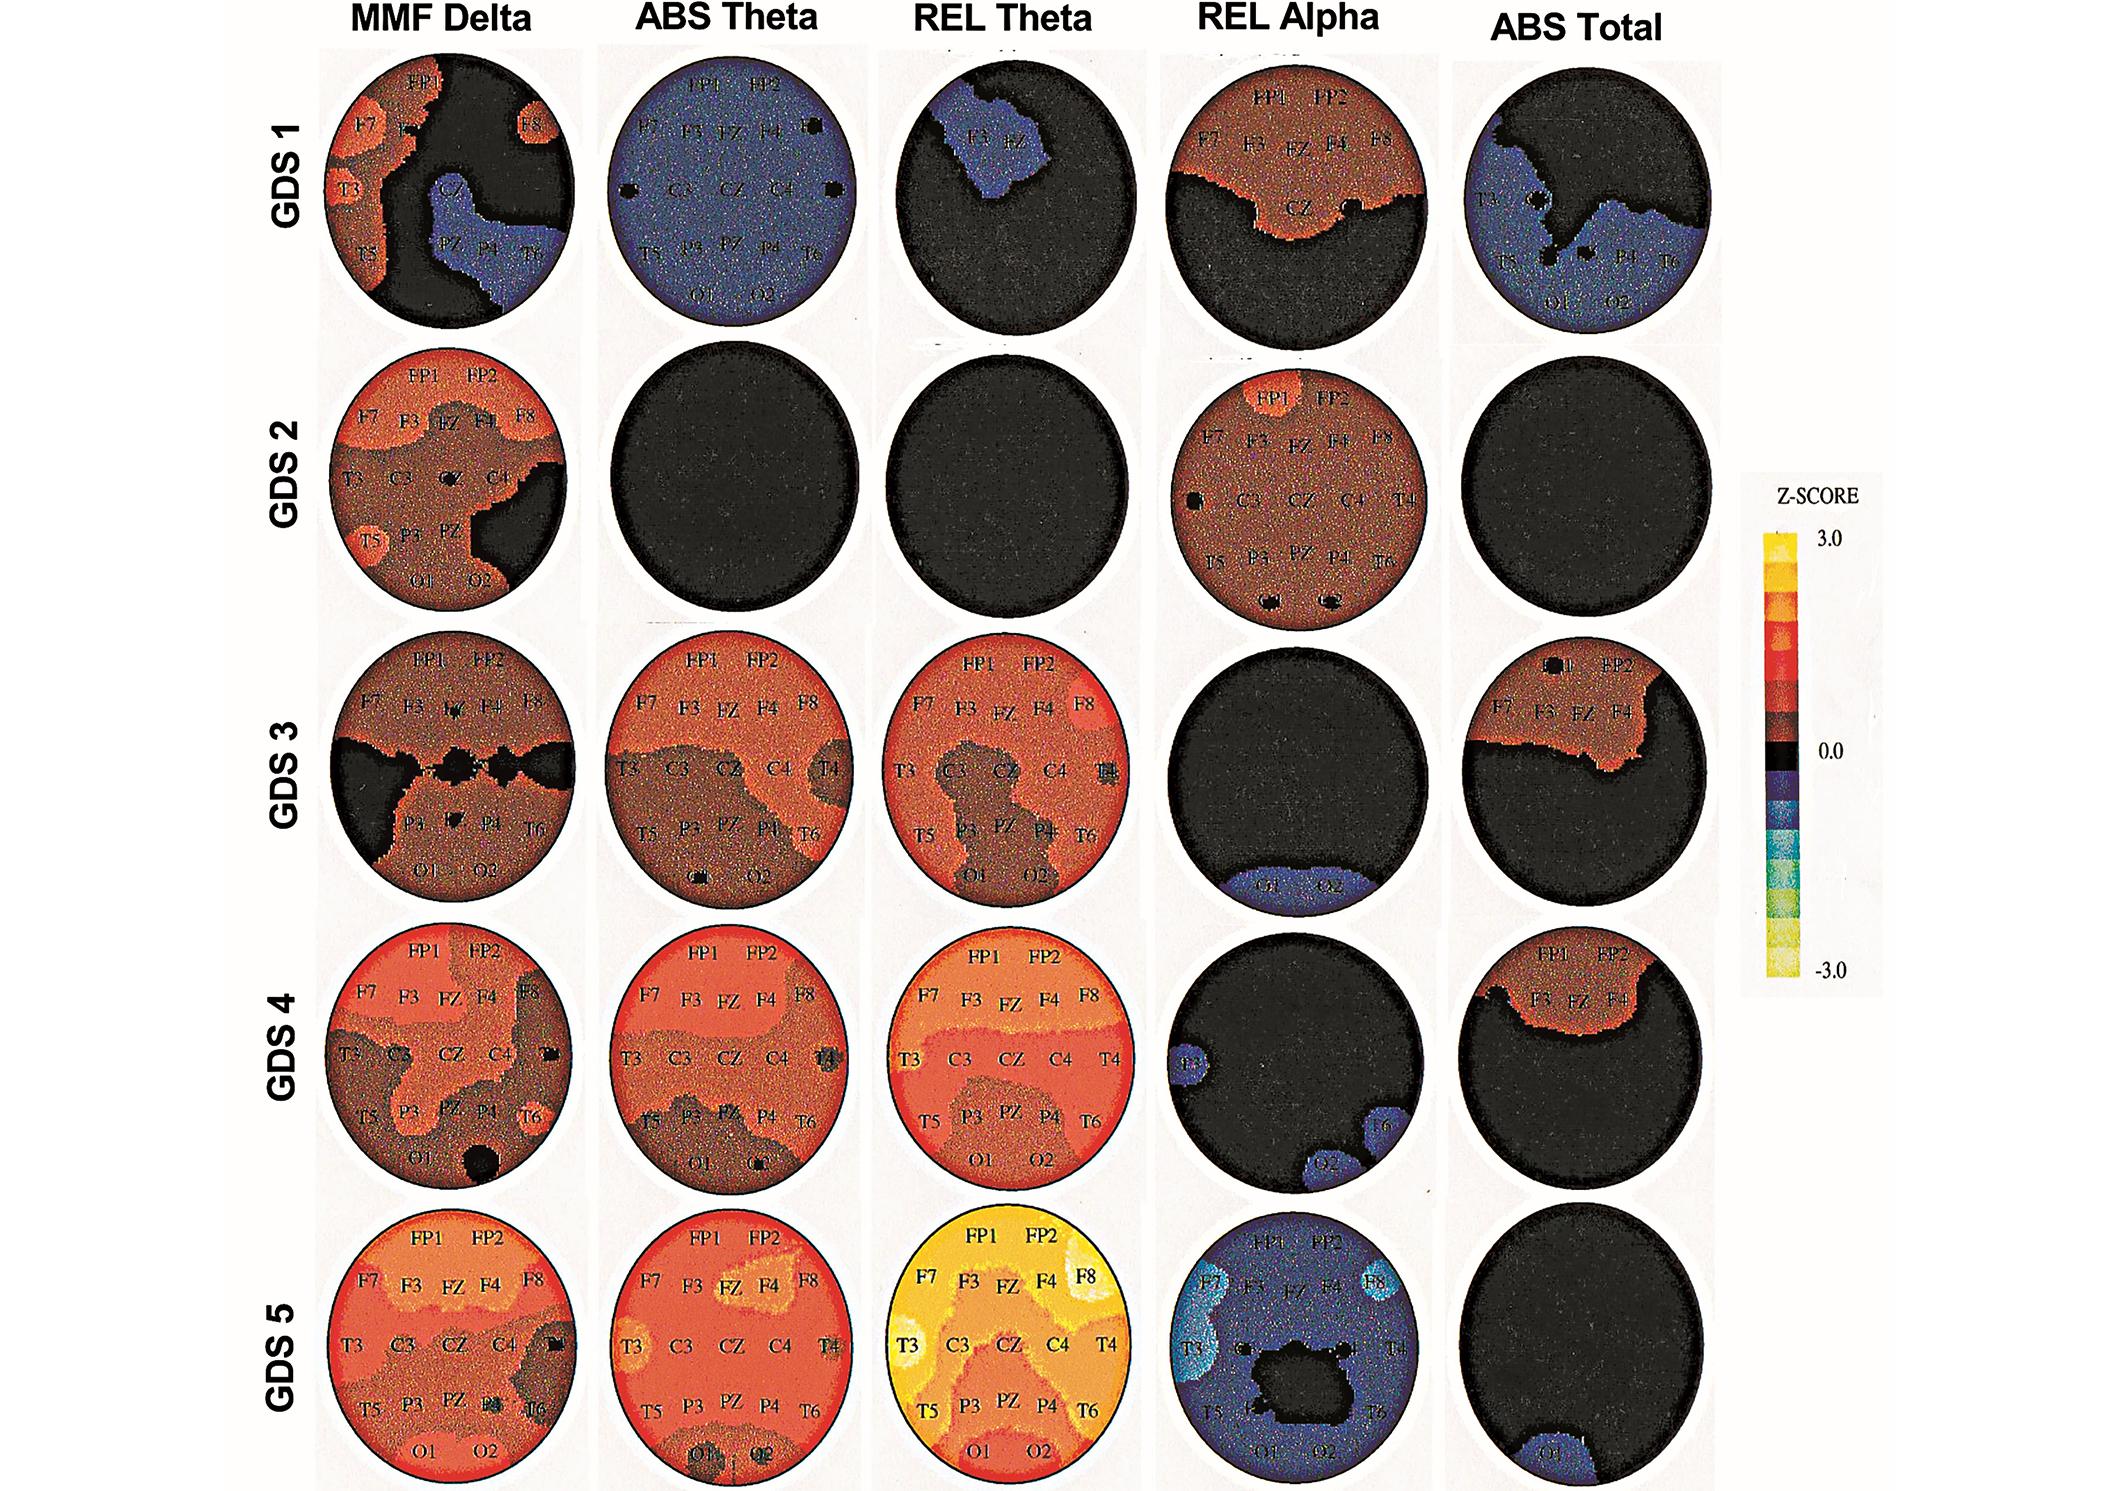
Topographic brain images in Global Deterioration Scale stages 1–5 at baseline (BL). MMF: mean frequency; ABS: absolute; REL: relative; GDS: Global Deterioration Scale
Cortical areas with electrophysiological changes correspond to the electrode placements as diagrammed in Figure 1. MMF delta = mean frequency delta, ABS theta = absolute theta, REL theta = relative theta, REL alpha = relative alpha, and ABS total = absolute total power. Steps of the Z-score scale (± 1.5) were adjusted for the “n” in each GDS stage. GDS 1 Z-score step = 0.4. GDS 2 Z-score step = 1. GDS 3 Z-score step = 1. GDS 4 Z-score step = 0.7, and GDS 5 Z-score step = 0.4. To estimate the significance of any regional Z-score for this group’s average data, the Z-score should be multiplied by the square root of the number of participants in the group. For example, for n = 25, the probability associated with an average Z value of 1.25 that corresponds to a standard normal deviation of approximately
Forty-four (81%) of the BL participants converted to a diagnosis within the AD continuum with a mean age of 73 ± 8.5 (range = 52–89) (see Table 2). Normal-functioning older adults at BL (n = 21) developed MCI (GDS 3: 13, 30%) and probable AD (GDS 4–GDS 5: 4, 9%) at FU. Those with BL MCI (n = 20) converted to probable AD (GDS 4–GDS 5: 15, 34%) and severe AD (GDS 6–GDS 7: 4, 9%) at FU. Older adults with BL probable AD (n = 13) converted to severe AD (GDS 6–GDS 7: 8, 18%) at FU. Age was the only demographic that significantly differed across GDS stages (χ2 = 14.6, df = 6, P = 0.02). Gender did not significantly differ across GDS stages (χ2 = 4.4, df = 6, P = 0.62).
Demographics at FU with mean age (± SD)
| Variables | Entire sample | No converting | Converting to diagnosis in AD continuum | |||||
|---|---|---|---|---|---|---|---|---|
| GDS 1 | GDS 2 | GDS 3 | GDS 4 | GDS 5 | GDS 6 | GDS 7 | ||
| Sample, n | 54 (100%) | 2 (4%) | 8 (15%) | 13 (24%) | 11 (20%) | 8 (15%) | 10 (18%) | 2 (4%) |
| Age | 73 ± 8.5 | 71 ± 7.1 | 68.1 ± 1 | 75 ± 7.5 | 76 ± 0.7 | 78 ± 5.3 | 66 ± 4.5 | 71 ± 6 |
| Male, n | 23 (43%) | 0 | 3 (6%) | 7 (13%) | 6 (11%) | 3 (6%) | 4 (7%) | 0 |
| Age (male) | 74 ± 8 | - | 65 ± 9 | 69 ± 8 | 70 ± 11 | 77 ± 2 | 63 ± 4 | - |
| Female, n | 31 (57%) | 2 (4%) | 5 (9%) | 6 (11%) | 5 (9%) | 5 (9%) | 6 (11%) | 2 (4%) |
| Age (female) | 71 ± 9 | 71 ± 7.1 | 61 ± 5 | 65 ± 7 | 73 ± 6 | 74 ± 7 | 59 ± 3 | 71 ± 6 |
SD: standard deviation; GDS: Global Deterioration Scale; FU: follow-up; AD: Alzheimer’s disease. -: no data
The FU brain images display that only ABS rsEEG theta and REL rsEEG theta significantly and consistently increase across the GDS stages from the frontal to the posterior regions (P ≤ 0.01) of the head (see Figure 3). There were changes in other electrophysiological biomarkers but the changes did not occur across all GDS stages. The MMF rsEEG delta significantly increased only from GDS 2 to GDS 3 in the pre-frontal regions (Fp1, Fp2, F3, F4, Fz; P ≤ 0.01), and only at GDS 4 in the left posterior temporal region (T3, T4). The REL rsEEG alpha significant decreased only from GDS 6 to GDS 7 in the frontal arc (Fp1, Fp2, F3, F4, F7, F8, T3, T4; P ≤ 0.01). The ABS total power significantly increased only at GDS 5 in the entire head (P ≤ 0.01). The rsEEG theta was the only electrophysiological biomarker with a consistent change from normal functioning to severe AD, independent of any significant decrease in REL rsEEG alpha, which occurred only in severe AD.
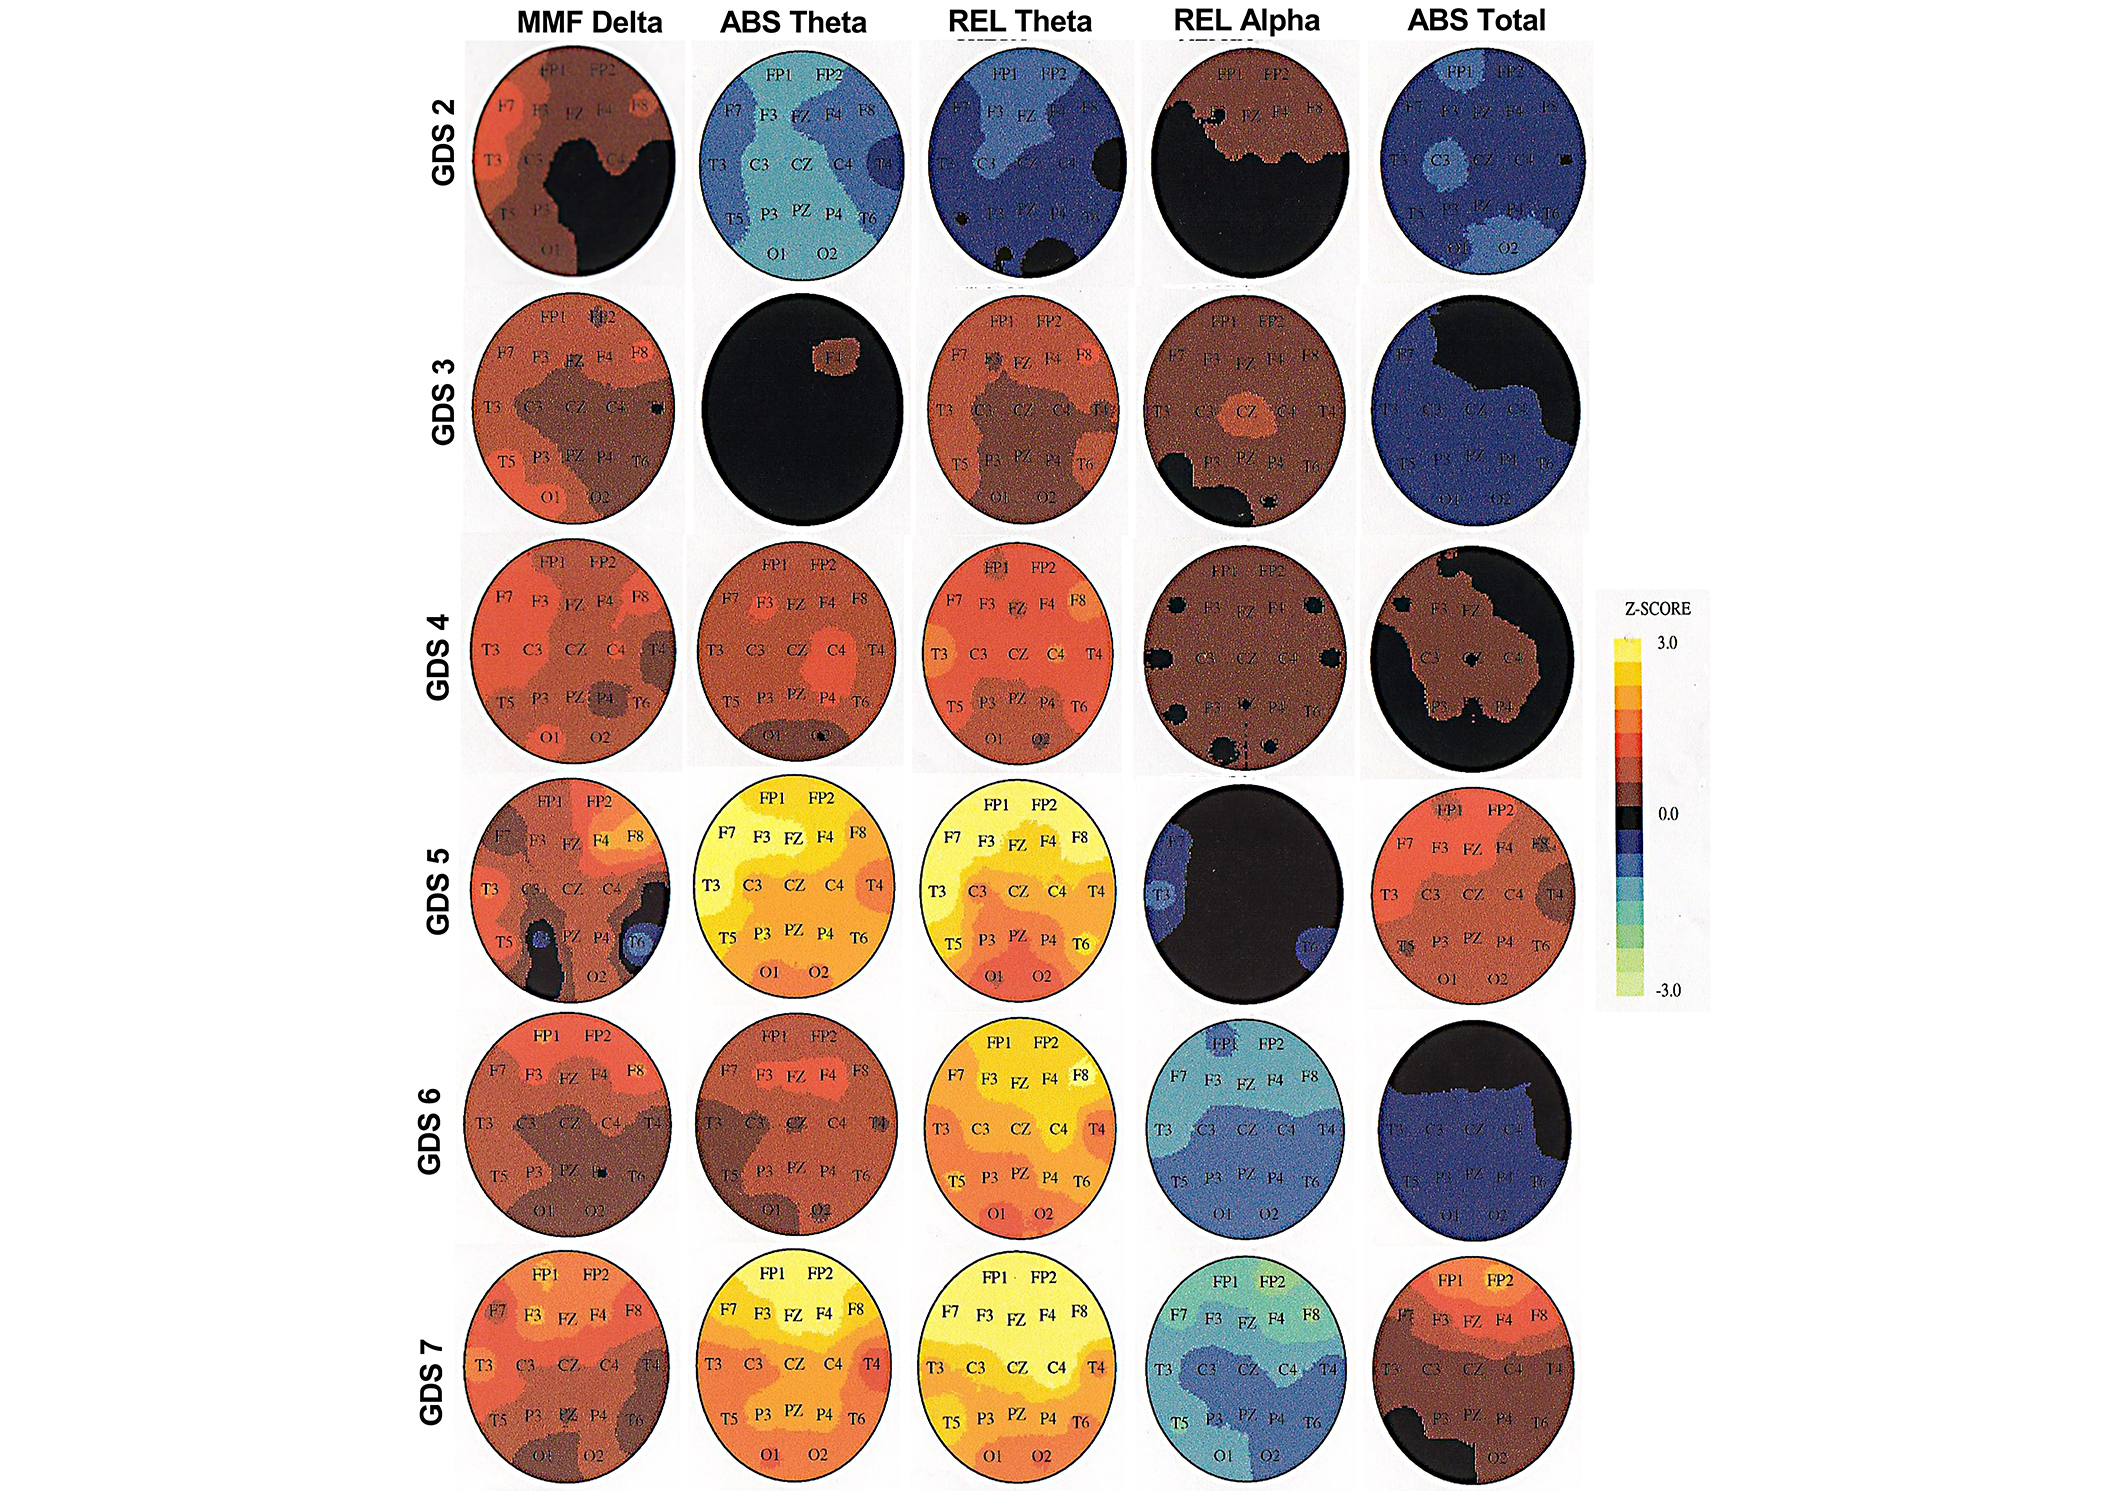
Topographic brain images in Global Deterioration Scale (GDS) stages 1–7 at follow-up (FU). MMF: mean frequency; ABS: absolute; REL: relative
Cortical areas with electrophysiological changes correspond to the electrode placements as diagrammed in Figure 1. MMF delta = mean frequency delta, ABS theta = absolute theta, REL theta = relative theta, REL alpha =relative alpha, and ABS total = absolute total power. Steps of the Z-score scale (± 3.0) were adjusted for each GDS stage. GDS 2 Z-score step = 1.2. GDS 3 Z-score step = 1.6. GDS 4 Z-score step = 1.4. GDS 5 Z-score step = 1.2. GDS 6 Z-score step = 1.4. GDS 7 Z-score step = 0.6. To estimate the significance of any regional Z-score for this group’s average data, the Z-score should be multiplied by the square root of the number of participants in the group. For example, for n = 25, the probability associated with an average Z value of 1.25 that corresponds to a standard normal deviation of approximately
The figures provide a visual representation of the increasing rsEEG theta occurring consistently in several cortical areas at FU for participants who converted to a diagnosis within the AD continuum. Summarizing these occurrences by gender and age groups may show a pattern for absolute and relative rsEEG theta in the cortical areas.
Absolute rsEEG theta increased for both males and females at GDS 5 as a frontal arc (see Table 3). While the relative rsEEG theta increased for both males and females at GDS 5, females had an increasing rsEEG theta at GDS 6 and GDS 7 as a frontal-lateral arc. The relative rsEEG theta increased in more cortical areas for females who were in the mild to severe stages of AD (GDS 5–GDS 7). The summary indicates more increasing rsEEG theta in females, which can be described as a measure discerning the level of cognitive deficits by gender.
Cortical regions with increasing rsEEG theta (P ≤ 0.05) by gender
| GDS stages for gender groups | Absolute theta | Relative theta |
|---|---|---|
| Males, n = 23 | ||
| GDS 1, n = 0 | - | - |
| GDS 2, n = 3 | - | - |
| GDS 3, n = 7 | - | - |
| GDS 4, n = 6 | - | Right frontal pole, left frontal, left & right lateral central, left & right lateral frontal, left temporal lobe |
| GDS 5, n = 3 | Left & right frontal pole, left frontal, right parietal, left & right lateral frontal, left temporal, left & right lateral temporal, frontal-central-parietal midline | - |
| GDS 6, n = 4 | - | - |
| GDS 7, n = 0 | - | - |
| Females, n = 31 | ||
| GDS 1, n = 2 | - | - |
| GDS 2, n = 5 | - | - |
| GDS 3, n = 6 | - | - |
| GDS 4, n = 5 | - | - |
| GDS 5, n = 5 | Left & right frontal pole, left & right frontal, left & right lateral central, left & right parietal, left & right lateral frontal, left temporal, left frontal-central midline | Left & right frontal pole, left & right frontal, left & right lateral frontal, left temporal, left lateral temporal, frontal midline |
| GDS 6, n = 6 | - | Left & right frontal pole, left & right frontal, left & right lateral central, left & right parietal, left & right lateral frontal, left temporal, left & right lateral temporal, frontal-central-parietal midline |
| GDS 7, n = 2 | Left & right frontal pole, left & right frontal, frontal midline | Left & right frontal pole, left & right frontal, right lateral central, left & right lateral frontal, left lateral temporal, frontal-central midline |
Italicized means non-converters. GDS: Global Deterioration Scale; rsEEG: resting-state electroencephalogram. -: no data
The identification of the increasing rsEEG theta may be more pronounced when grouping the data by age groups. The age groups were created by splitting the ages into four equal groups (see Table 4).
Cortical regions with increasing rsEEG theta (P ≤ 0.05) by age groups
| GDS stages for age groups | Absolute theta | Relative theta |
|---|---|---|
| Group 1, n = 14 | ||
| GDS 1, n = 0 | - | - |
| GDS 2, n = 3 | - | Left lateral central, left temporal, right lateral central |
| GDS 3, n = 3 | - | - |
| GDS 4, n = 2 | - | Left & right frontal pole, left & right frontal, left & right lateral central, left & right parietal, left & right lateral frontal, left temporal, left & right lateral temporal, frontal-central midline |
| GDS 5, n = 0 | - | - |
| GDS 6, n = 6 | - | Left & right frontal pole, left & right frontal, left & right lateral central, left & right parietal, left & right lateral frontal, left temporal, left & right lateral temporal, frontal-central midline |
| GDS 7, n = 0 | - | - |
| Group 2, n = 13 | ||
| GDS 1, n = 1 | - | - |
| GDS 2, n = 3 | - | - |
| GDS 3, n = 1 | - | - |
| GDS 4, n = 2 | - | - |
| GDS 5, n = 1 | Left & right frontal, frontal midline | Left & right frontal pole, left & right frontal, right lateral central, left & right lateral frontal, left temporal, right lateral temporal, frontal midline |
| GDS 6, n = 4 | - | - |
| GDS 7, n = 1 | Left & right frontal pole, left & right frontal, left & right lateral central, left & right parietal, left & right occipital, left & right lateral frontal, left temporal, left lateral temporal, frontal-central-parietal midline | Entire head (all cortical regions) |
| Group 3, n = 14 | ||
| GDS 1, n = 1 | Left & right frontal, left & right lateral central, left & right parietal | - |
| GDS 2, n = 0 | - | - |
| GDS 3, n = 4 | - | - |
| GDS 4, n = 2 | Left & right frontal, left & right lateral central, left & right parietal, left lateral frontal, left temporal, right lateral temporal, central-parietal midline | Left temporal |
| GDS 5, n = 6 | Left & right frontal pole, left & right frontal, left & right lateral central, left & right parietal, left & right occipital, left & right lateral frontal, left temporal, left & right lateral temporal, frontal-central-parietal midline | Left & right frontal pole, left & right frontal, left lateral central, left & right lateral frontal, left & right temporal, left & right lateral temporal, frontal-central midline |
| GDS 6, n = 0 | - | - |
| GDS 7, n = 1 | - | - |
| Group 4, n = 13 | ||
| GDS 1, n = 0 | - | - |
| GDS 2, n = 2 | - | - |
| GDS 3, n = 5 | - | - |
| GDS 4, n = 5 | - | - |
| GDS 5, n = 1 | Left temporal | Right lateral frontal, left temporal |
| GDS 6, n = 0 | - | - |
| GDS 7, n = 0 | - | - |
Italicized means non-converters. Age groups: Group 1 = age 58.26–66.40; Group 2 = age 66.48–73.58; Group 3 = age 73.79–80.07; Group 4 = age 80.82–89.51. GDS: Global Deterioration Scale; rsEEG: resting-state electroencephalogram. -: no data
Absolute rsEEG theta increased mostly in participants who were between 66.48 to 80.07 years of age. The increase occurred in age Group 2 (GDS 7) and in age Group 3 (GDS 4 and GDS 5) as a frontal-lateral arc. Relative rsEEG theta increased in age Groups 1–3 (GDS 5) with the increase also occurring in age Group 1 (GDS 4) as a frontal-lateral arc. The increase occurred over the entire head for age Group 2 in GDS 7. For age Group 3, the absolute and relative rsEEG theta had a pattern of increasing activity in GDS 5. This pattern occurred in absolute rsEEG for age Group 2 (GDS 7). It was also evident in relative rsEEG theta for age Group 1 (GDS 4 and GDS 6) and age Group 2 (GDS 5). The increasing rsEEG theta may have been more evident in age Groups 2 and 3. The summary indicates more increasing rsEEG theta in age Groups 2 and 3, which can be described as a measure discerning the level of cognitive deficits by age groups.
This summary is another way to understand the findings. There is a pattern of increasing rsEEG in several cortical areas across GDS 5–GDS 7 for females. This pattern is driven by the increasing rsEEG theta in GDS 5–GDS 7. This pattern is also evident in several cortical areas for age Groups 2 and 3, but it is not specific to absolute rsEEG theta, relative rsEEG theta, or the combination of the two. For certain ages, the pattern is in absolute rsEEG theta and for others in relative rsEEG theta.
The amount of change in ABS and REL rsEEG theta was significantly increasing (Z-scoresAVG CHANGE = –0.2 to 1.3, P ≤ 0.01) across all GDS stages in the entire head (see Figure 4). For REL rsEEG alpha, a significant decrease only occurred from GDS 4 to GDS 7 (Z-scoresAVG CHANGE = –1.1 to 0.5, P ≤ 0.01), indicative of only a change from probable AD to severe AD. The MMF rsEEG delta and ABS total power did not have a significant amount of change across the GDS stages. Only ABS and REL theta had a significant amount of change that demonstrated consistent and increasing changes in brain activity from normal functioning to severe AD.
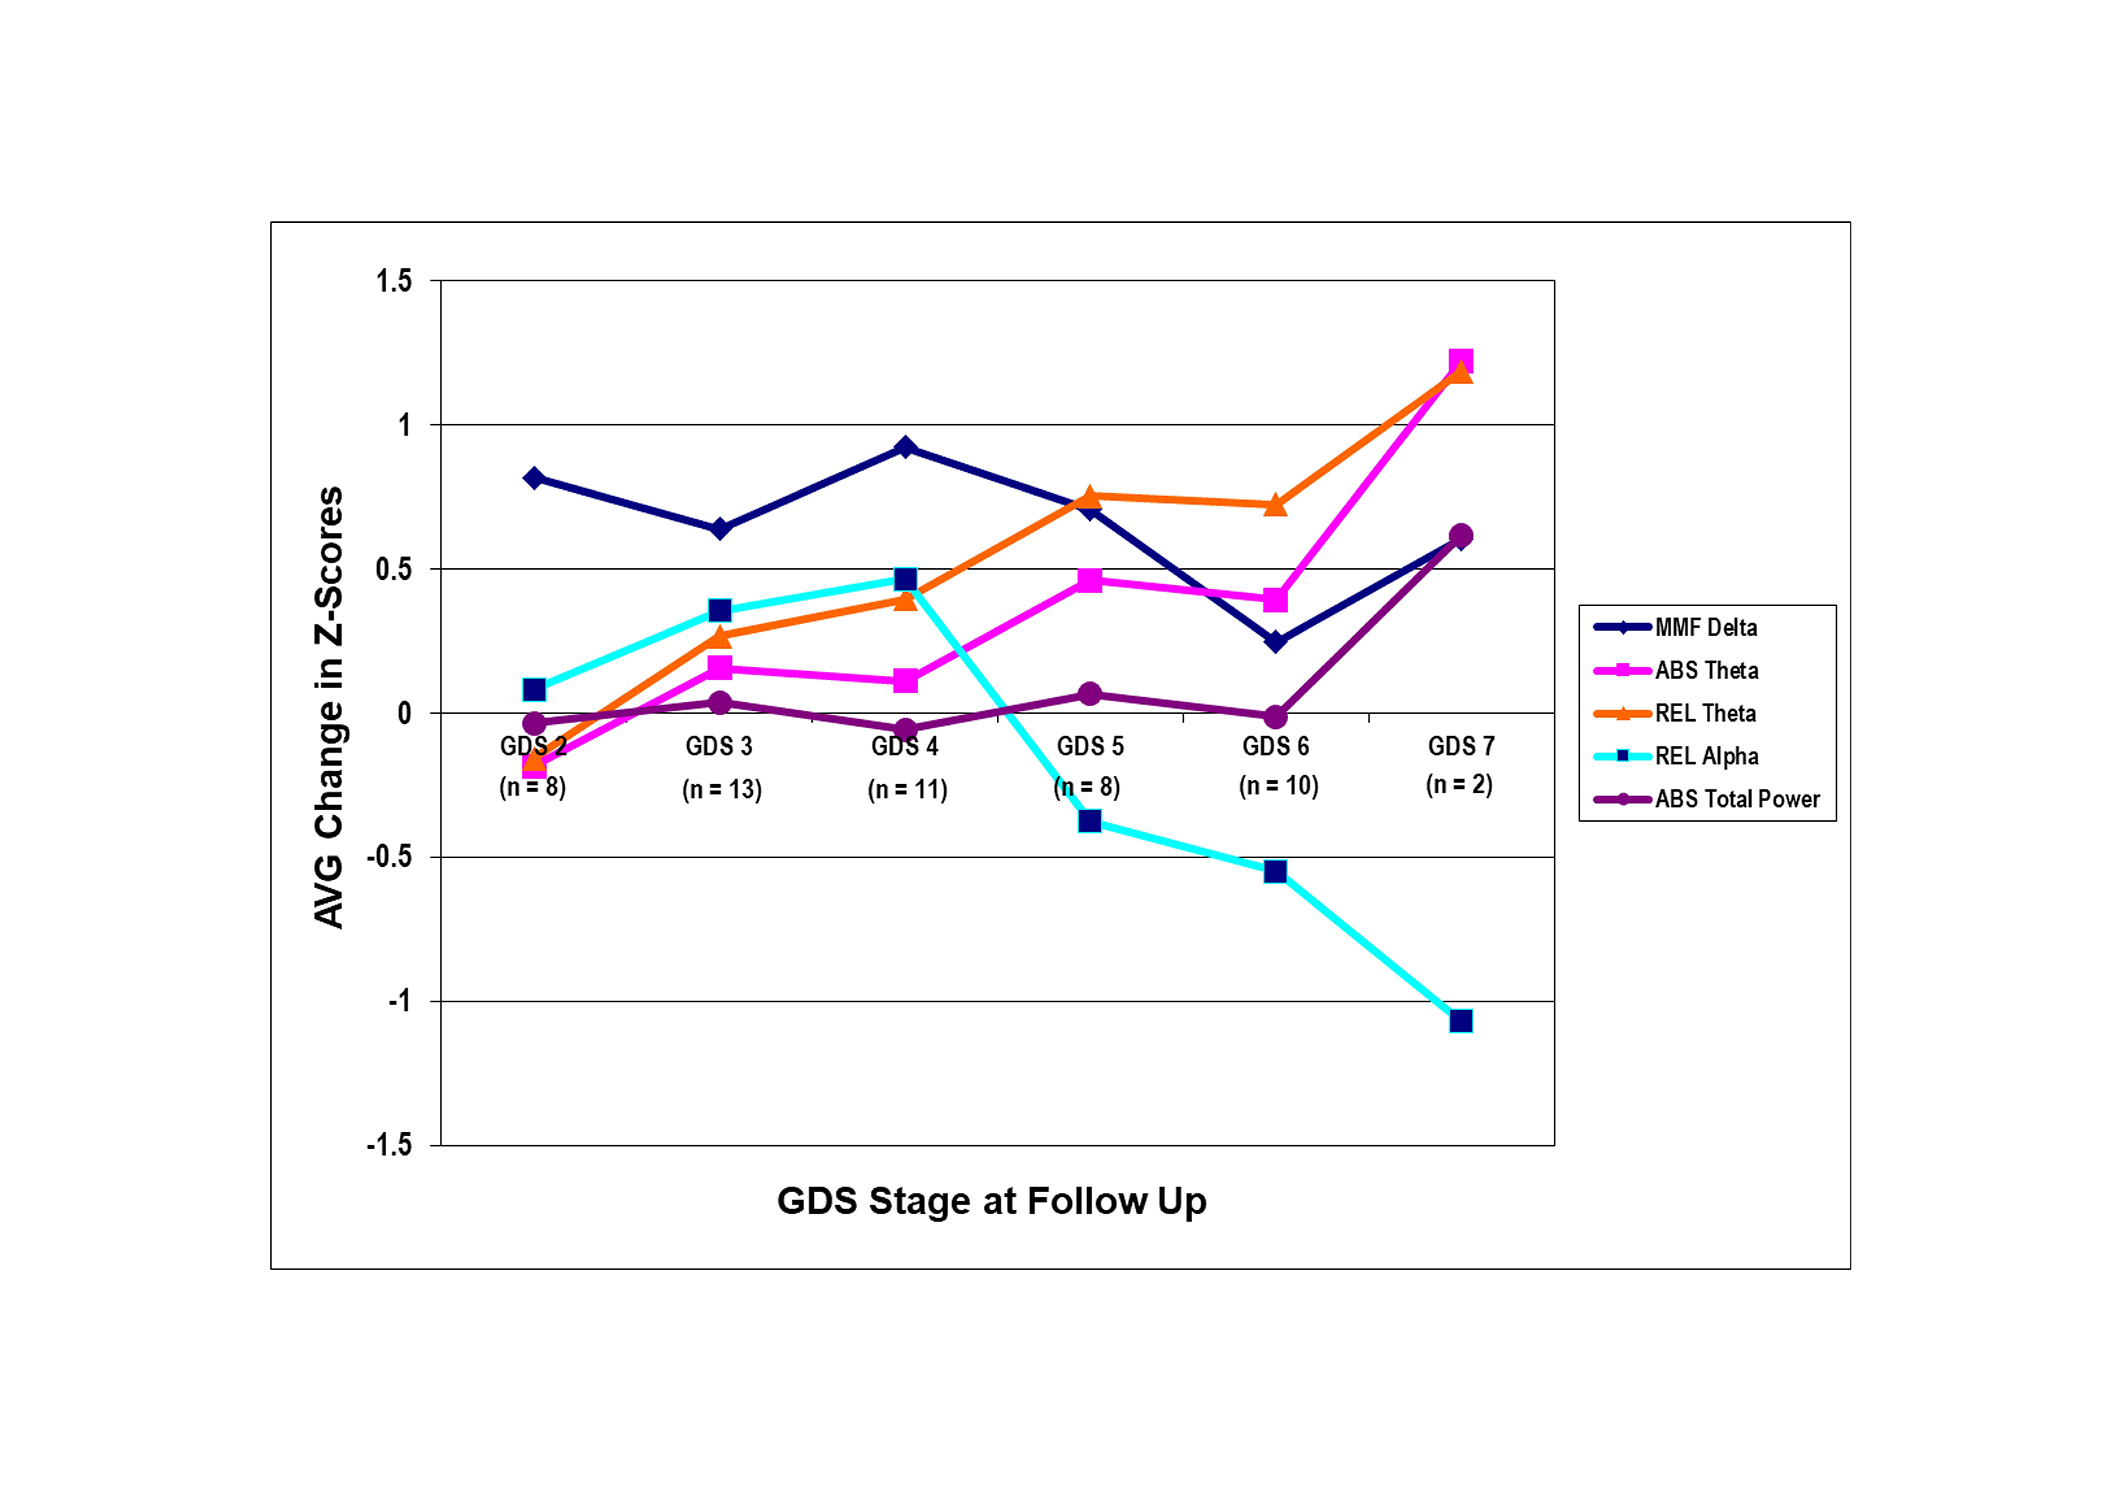
The amount of change in the qEEG features in the Global Deterioration Scale (GDS) stages at follow-up (FU). The average (AVG) amount of change in Z-score was computed by taking the summation of the change score (Z-scoreFU – Z-scoreBL) for each qEEG feature in the selected regions and dividing by the number of qEEG features in the regions. MMF delta = mean frequency delta, ABS theta = absolute theta, REL theta = relative theta, REL alpha = relative alpha, and ABS total power = absolute total power. The regions of interest are the prefrontal region (Fp1, Fp2, F3, F4, Fz) for MMF delta, the entire head (Fp1, Fp2, F3, F4, C3, C4, P3, P4, O1, O2, F7, F8, T3, T4, T5, T6, Fz, Cz, Pz) for ABS and REL theta, frontal arc (Fp1, Fp2, F3, F4, F7, F8, T3, T4, Fz) for REL alpha, and the entire head for ABS total power. The level of significance was 0.01. qEEG: quantitative electroencephalogram; BL: baseline
The present study, to the author’s knowledge, is one of the first studies to report a consistently increasing electrophysiological biomarker as a possible indicator of older adults declining from normal functioning to a diagnosis within the AD continuum. In the present study, rsEEG theta was the only electrophysiological biomarker to increase across all GDS stages from BL to FU with an increasing amount of change over time. The increase progressively moved from the frontal region of the head to the posterior region. There was no discernible change in rsEEG delta, alpha, or beta. These findings suggest that the increasing rsEEG theta from normal functioning to a diagnosis of AD may be an electrophysiological biomarker indicator of the onset and progression of AD.
An electrophysiological biomarker indicator serves as a measure of the changes in the electrophysiology of AD, which is evident in the biological mechanism underlying the change in rsEEG theta frequency. The change revolves around the association among β-amyloid, tau (τ), inflammatory proteins, and neural activity. The proteins increase at the cellular level, affecting the brain’s neurochemistry, metabolism, and neuropathology, which alters the neural activity in the brain. Electrophysiological biomarkers detect these cellular-level alterations or disruptions [41]. Excessive amyloid-β and tau (τ) proteins lead to the production and overproduction of neuritic plaques and neurofibrillary tangles, which is contributed by inflammatory proteins in response to any disruptions of the brain [31, 33, 41]. Eventually, the overproduction of plaques and tangles significantly impacts the oscillation and functional connectivity of the neural activity (or neural transmission) in the limbic system, altering the neural activity for cognitive processing [34, 35]. The progression of these neuropathological changes is associated with manifested cognitive impairment that links to the onset of AD [41]. Electrophysiological biomarkers detect these structural changes, altered cognitive processing, and manifested cognitive impairment. During the disruption of the brain’s neurochemistry, metabolism, and neuropathology, the proteins disrupt the neural activity, generating electrophysiological biomarkers based on the brain activity changes in certain cortical areas [41]. For rsEEG theta, it is occurring in the limbic system. The neuropathological changes inhibit the ventral tegmental area so that the septal nuclei and the nucleus accumbens activate the hippocampus and cingulate, generating rsEEG theta frequency [41]. This frequency is manifested as electrophysiological brain changes.
The correlation between the increasing neuropathological changes and cognitive impairment defines electrophysiological brain changes and the electrophysiological biomarker in the rsEEG theta frequency [42]. An increasing rsEEG theta can be described as an indicator of a change in the brain’s electrophysiology from plaques and tangles negatively impacting neural activity [43, 44]. This rsEEG theta can be described as a way to detect and measure cognitive impairment in persons with MCI and AD without being dependent on brain activity changes reaching a certain threshold for detection [43, 44]. Thus, the electrophysiological biomarker indicator measures the brain activity changes at the cellular and structural level for cognitive impairment.
The electrophysiological biomarker can function as an early indicator because it is not dependent on achieving a specific threshold for detection. With the neuropathological changes from β-amyloid, tau (τ), and/or inflammatory proteins, a certain threshold or level of production and overproduction has to occur for a discernible measure of the neuropathological change that is associated with a person’s cognition, affective complications, or possible genetic factors [41]. Overproduction of the proteins leads to the production and excessive presence of plaques and tangles, facilitating their detection [41]. The rsEEG theta biomarker lacks this threshold dependency, indicating that it can detect disruption before structural changes. Importantly, the electrophysiological biomarker can function as an early indicator of the risk and onset of manifested cognitive impairment, where the risk may be associated with the electrophysiological biomarker’s detection of the cellular disruption that leads to structural changes [41].
The results of the current study are in accordance with another study that characterized electrophysiological biomarkers from normal functioning older adults to those with a diagnosis of AD. An increased ABS and REL rsEEG theta occurred at the 7-year FU evaluations for 44 participants who were normal-functioning older adults (GDS 2) at BL [7]. The increased rsEEG theta is associated with declining cognition for participants with a FU diagnosis of MCI (GDS 3) or DAT (GDS ≥ 4). This biomarker may be a potential predictor for cognitive decline [7]. In another study, certain biomarkers were reported in participants who ranged from normal functioning to a diagnosis of AD [42]. An increase in ABS and REL rsEEG theta occurred in the frontal regions and advanced to the posterior [42]. Interestingly, an increase in rsEEG delta was reported, which was not observed in the current study. Both studies substantiate the increasing rsEEG theta as a possible electrophysiological indicator of AD across the stages of GDS.
A diagnosis of AD is associated with electrophysiological biomarkers such as increased rsEEG delta or theta, and/or a decreased rsEEG alpha and beta [8, 45, 46]. Changes in these electrophysiological biomarkers may be occurring after a diagnosis within the AD continuum, and progressing with extensive pathological changes [47]. However, a consistent electrophysiological biomarker was not an indicator of the participants’ decline from normal functioning to a diagnosis of AD either at BL or FU.
Some studies have demonstrated an association between the progression of AD with only an increase in rsEEG theta frequency in parieto-occipital regions [29], the centro-parietal regions [28, 30], temporo-occipital regions [28], and the entire head [48]. Yet, an electrophysiological biomarker indicator for AD was not reported as characterized in the current study. Interestingly, a “normal” group instead of a population-based normative database was used for comparison when characterizing electrophysiological biomarkers of AD. The “normal” groups were often reported as persons with at least subjective cognitive impairment [9, 48]. Interestingly, age was a contributing factor to a change in rsEEG alpha [25]. This finding was not reported in the current study.
The consistently increasing rsEEG theta as a possible electrophysiological indicator for AD may aid in the treatment of the risk, onset, and progression of the AD continuum. Monitoring any significant changes in rsEEG theta may be useful in assessing the effectiveness of cholinesterase inhibitors in treating persons diagnosed with AD. A decrease in rsEEG theta is observed with the administration of tacrine hydrochloride (Cognex) and donepezil (Aricept) [49, 50]. Only the consistent change in rsEEG theta significantly correlated with improved cognition for persons diagnosed with probable AD when examining long-term tacrine treatment [49]. In addition, a consistent decrease in rsEEG theta was observed with the long-term treatment of donepezil in the frontal, temporo-parietal, and occipital regions of persons diagnosed with mild dementia [50]. While these findings are promising in regard to the potential clinical utility of this electrophysiological biomarker, further investigation is warranted.
The present study is one of the first to report on an electrophysiological biomarker indicator for AD progression across the GDS stages (from normal functioning to severe stages of AD). It is conceivable with this electrophysiological biomarker to objectively measure the risk, onset, and progression of AD; moreover, the biomarker will be critical to understanding the etiology of AD.
A limitation of this study was that it was a secondary analysis; however, using databases based on a 20-year collaboration optimized the quantity and quality of accessible data. Because of the extended period of data collection that occurred over time (1979–2003), the electrophysiological and neuropsychological data are not attributed to temporal, social, or environmental factors. In addition, the study’s aims were within the scope of both databases. Hence, these strengths enhanced the findings’ generalizability. Another limitation was the categorization of the participants with the GDS. This method assumed that GDS is a linear measurement and that each GDS stage is equal to a specific increase in the abnormal electrophysiological feature. Further examination and quantification of this association are needed.
An electrophysiological biomarker indicator for AD was detected from the electrophysiological data of normal-functioning older adults who developed a diagnosis within the AD continuum. The indicator emerged as the increasing rsEEG theta progressed across all GDS stages. This increasing rsEEG theta initiated in the frontal region and progressed to the posterior region of the head. This electrophysiological biomarker may enhance the current assessment of AD; nevertheless, further analyses are needed to expound on the clinical utility of this electrophysiological indicator of AD. With further examination, a diagnosis within the AD continuum is not solely dependent on subjective assessment of presenting clinical symptoms. The electrophysiological biomarker will enhance the treatment of persons diagnosed with AD and the identification of interventions to prevent the onset of the illness. Thus, the findings from this study may initiate other studies so that contributions can be made to the implementation of proactive care across GDS stages, transforming the current prognosis from total loss of independence to improved quality of life.
A1: left ear
A2: right ear
ABS: absolute
AD: Alzheimer’s disease
BL: baseline
C3: left central
C4: right central
Cz: midline central
DAT: dementia of the Alzheimer type
DSM IV: Diagnostic and Statistical Manual of Mental Disorders, 4th edition
EKG: electrocardiogram
F3: left frontal
F4: right frontal
F7: left anterior temporal
F8: right anterior temporal
Fp1: left frontopolar
Fp2: right frontopolar
FU: follow-up
Fz: frontal midline
GDS: global deterioration scale
MCI: mild cognitive impairment
MMF: mean frequency
O1: left occipital
O2: right occipital
P3: left parietal
P4: right parietal
Pz: midline parietal
REL: relative
rsEEG: resting-state electroencephalogram
T3: left mid temporal
T4: right mid temporal
T5: left posterior temporal
T6: right posterior temporal
The author acknowledges contextual support from Dr. Leslie S. Prichep (Chief Scientific Officer, BrainScope), Dr. Toni Tripp-Reimer, deceased in December 13, 2021 (The University of Iowa College of Nursing), and Dr. Faye A. Gary (Professor, Case Western Reserve University, FPB School of Nursing).
ECH: Conceptualization, Data curation, Writing—original draft, Writing—review & editing, Visualization.
The author of this article does not have any conflicts of interest to disclose.
This present study, secondary analysis, had ethical approval and received exemption status from the New York University Institutional Review Board and the New York University School of Medicine Institutional Review Board. The ethical approval and exemption status was on April 15, 2002, with the date serving as the ethical approval number.
This secondary analysis had ethical approval for informed consent exemption by the New York University Institutional Review Board and New York University School of Medicine Institutional Review Board.
Not applicable.
The datasets for this manuscript are not publicly available because this option for data sharing was not included in the IRB applications or ethically approved by New York University and New York University School of Medicine. Request for accessing the datasets should be directed to Dr. Leslie S. Prichep (leslie.prichep@brainscope.com).
Funded by the Substance Abuse and Mental Health Services Administration Minority Fellowship Program [2 T06 SM 151555] at the American Nurses Association and the Brain Research Laboratories, New York University School of Medicine. The funder had no role in study design, data collection and analysis, decision to publish, or preparation of the manuscript.
© The Author(s) 2025.
Open Exploration maintains a neutral stance on jurisdictional claims in published institutional affiliations and maps. All opinions expressed in this article are the personal views of the author(s) and do not represent the stance of the editorial team or the publisher.
Copyright: © The Author(s) 2025. This is an Open Access article licensed under a Creative Commons Attribution 4.0 International License (https://creativecommons.org/licenses/by/4.0/), which permits unrestricted use, sharing, adaptation, distribution and reproduction in any medium or format, for any purpose, even commercially, as long as you give appropriate credit to the original author(s) and the source, provide a link to the Creative Commons license, and indicate if changes were made.

Janusz Wiesław Błaszczyk
Tatsushi Yuri ... Hisashi Nojima
Priyanka Sengupta ... Debashis Mukhopadhyay
Danqing Xiao, Chen Zhang
Carlos Gutierrez-Merino
Julius Mulumba ... Yong Yang
Felipe P. Perez ... Maher Rizkalla
Jorge Medeiros
Ryszard Pluta
