 Original Article

Affiliation:
1Experimental and Clinical Research Center, Max Delbrück Center for Molecular Medicine, Charité – Universitätsmedizin Berlin, 13125 Berlin, Germany
ORCID: https://orcid.org/0000-0002-8044-4538
Affiliation:
2Institut für Neuroimmunologie und Multiple Sklerose (INIMS), Klinik und Poliklinik für Neurologie, Universitätsklinikum Hamburg-Eppendorf, 20251 Hamburg, Germany
Affiliation:
1Experimental and Clinical Research Center, Max Delbrück Center for Molecular Medicine, Charité – Universitätsmedizin Berlin, 13125 Berlin, Germany
3Neuroscience Clinical Research Center, Charité – Universitätsmedizin Berlin, Freie Universität Berlin and Humboldt-Universität zu Berlin, 10117 Berlin, Germany
ORCID: https://orcid.org/0009-0002-5872-1268
Affiliation:
1Experimental and Clinical Research Center, Max Delbrück Center for Molecular Medicine, Charité – Universitätsmedizin Berlin, 13125 Berlin, Germany
4Department of Physical Medicine and Rehabilitation, Charité – Universitätsmedizin Berlin, Freie Universität Berlin and Humboldt-Universität zu Berlin, 10117 Berlin, Germany
ORCID: https://orcid.org/0000-0002-5958-2872
Affiliation:
1Experimental and Clinical Research Center, Max Delbrück Center for Molecular Medicine, Charité – Universitätsmedizin Berlin, 13125 Berlin, Germany
Affiliation:
1Experimental and Clinical Research Center, Max Delbrück Center for Molecular Medicine, Charité – Universitätsmedizin Berlin, 13125 Berlin, Germany
ORCID: https://orcid.org/0000-0002-5246-3635
Affiliation:
2Institut für Neuroimmunologie und Multiple Sklerose (INIMS), Klinik und Poliklinik für Neurologie, Universitätsklinikum Hamburg-Eppendorf, 20251 Hamburg, Germany
ORCID: https://orcid.org/0000-0002-5228-4266
Affiliation:
1Experimental and Clinical Research Center, Max Delbrück Center for Molecular Medicine, Charité – Universitätsmedizin Berlin, 13125 Berlin, Germany
3Neuroscience Clinical Research Center, Charité – Universitätsmedizin Berlin, Freie Universität Berlin and Humboldt-Universität zu Berlin, 10117 Berlin, Germany
Affiliation:
2Institut für Neuroimmunologie und Multiple Sklerose (INIMS), Klinik und Poliklinik für Neurologie, Universitätsklinikum Hamburg-Eppendorf, 20251 Hamburg, Germany
Affiliation:
1Experimental and Clinical Research Center, Max Delbrück Center for Molecular Medicine, Charité – Universitätsmedizin Berlin, 13125 Berlin, Germany
3Neuroscience Clinical Research Center, Charité – Universitätsmedizin Berlin, Freie Universität Berlin and Humboldt-Universität zu Berlin, 10117 Berlin, Germany
5Department of Neurology and Experimental Neurology, Charité – Universitätsmedizin Berlin, Freie Universität Berlin and Humboldt-Universität zu Berlin, 10117 Berlin, Germany
ORCID: https://orcid.org/0000-0002-6378-0070
Affiliation:
1Experimental and Clinical Research Center, Max Delbrück Center for Molecular Medicine, Charité – Universitätsmedizin Berlin, 13125 Berlin, Germany
ORCID: https://orcid.org/0000-0001-9962-4582
Affiliation:
1Experimental and Clinical Research Center, Max Delbrück Center for Molecular Medicine, Charité – Universitätsmedizin Berlin, 13125 Berlin, Germany
3Neuroscience Clinical Research Center, Charité – Universitätsmedizin Berlin, Freie Universität Berlin and Humboldt-Universität zu Berlin, 10117 Berlin, Germany
Email: tanja.schmitz-huebsch@charite.de
ORCID: https://orcid.org/0000-0003-4833-5937
Explor Neuroprot Ther. 2024;4:273–287 DOI: https://doi.org/10.37349/ent.2024.00082
Received: January 20, 2024 Accepted: May 30, 2024 Published: June 12, 2024
Academic Editor: Rafael Franco, Universidad de Barcelona, Spain
Aim: This article is based on our previous research, which was presented as a poster at the ECTRIMS Congress 2018 and published as a conference abstract (https://www.professionalabstracts.com/ectrims2018/iplanner/#/presentation/1698). Cognitive-motor interference (CMI) has been observed in both healthy controls (HC) and persons with multiple sclerosis (pwMS), but limited and contradictory data is making it difficult to assess the impact of motor and cognitive functioning levels on CMI. The aim of this study was to investigate CMI in pwMS and HC by means of a dual task postural paradigm, to compare them between groups and to analyse the influence of motor and cognitive functioning levels assessed with complementary instruments on observed CMI.
Methods: The dual task posturography paradigm serves to quantify the impact of a cognitive (i.e., performing serial subtractions), a motor challenge (closing eyes), or both challenges combined (triple task) on body sway during standing in an upright position feet closed. The data analysed were acquired in one interventional and four observational studies and selected based on predefined criteria and by systematic quality control. A total of 113 pwMS and 42 HC were selected for analysis.
Results: Comparable changes in motor and cognitive performance due to cognitive or combined cognitive-motor challenges were observed in both HC and pwMS. Combining both tasks did not result in further changes in motor performance but resulted in a decrease in cognitive performance. This reduction in cognitive performance with an additional motor challenge correlated with lower levels of cognitive and motor functioning in pwMS. Unexpectedly, an increase in body sway due to a cognitive or combined cognitive-motor challenges was primarily observed in pwMS and HC with better cognitive and motor functioning.
Conclusions: The results suggest that dual-task effects are not disease-specific but rather reflect individually different adaptation strategies depending on the specific motor and cognitive functioning levels.
Multiple sclerosis (MS) is a chronic inflammatory, neurodegenerative disease characterized by a variety of symptoms, including sensory, motor and cognitive, on the clinical level [1].
Motor and cognitive symptoms are predominantly measured as independent factors although studies show that both can be related—attentional resources, for example, can influence the control of posture and gait. This relation becomes especially evident under conditions of declining attentional resources and cognitive-motor interferences (CMIs) are thus prominently studied with so-called dual task (DT) paradigms [2] in healthy ageing and neurodegenerative disease including MS [3–6]. In these tasks, the performance achieved during execution of either a cognitive or a motor task [“single-task” (ST) condition] is contrasted against those during their simultaneous execution (DT condition) and the difference between the ST and DT conditions is treated as “dual-task cost” and serves as a measure of CMI.
Several studies have employed such paradigms to measure CMI in persons with MS (pwMS). For example, the review of Wajda and Sosnoff [5] summarizes 21 studies among which seven specifically investigated the impact of CMI on postural control. Six of these seven show an increase of 20–95% in body sway in the DT condition. However, there are two issues regarding the interpretation of existing data: first, changes in cognitive performance are only reported very rarely, such that the interaction between motor and cognitive performance in terms of CMI is not fully described [7–10]. The second issue is that in most studies on DT posturography in pwMS, an increase in body sway during the DT experiment is predominantly interpreted as a disease-specific effect indicative of impaired postural control. Nonetheless, the inference from such evidence on an MS-specific impact on CMI might be premature as the results obtained across studies are contradictory [4, 5] and notably similar DT costs were observed in pwMS and healthy controls (HC) [3, 11]. This rather suggests that the CMI in MS is a generic physiological effect primarily depending on task complexity and individual resources [11].
For these reasons and given the small to moderate sample sizes of previous studies, we conducted a study aiming to investigate CMI in DT posturography in a larger cohort of pwMS and HC. We examined motor and cognitive performance in four conditions: standing with feet closed and eyes open (EO) (ST condition), standing with eyes closed (EC) (motor DT challenge), standing while performing serial subtraction in increments of 3 (cognitive DT challenge) and standing with a motor/cognitive challenge and the other challenge added, resulting in a triple task condition (combined task). We aimed to describe not only the changes in motor performance but also those in cognitive performance. To achieve this, motor and cognitive performance observed in each of the four conditions were described as change to the respective baseline condition and evaluated to address CMI. To clarify whether CMI is a physiological or disease-specific effect in MS, these changes in motor and cognitive performance were compared between both groups. Finally, correlation analyses were conducted to test how CMI is related to the participants’ motor and cognitive functional levels.
This retrospective analysis was based on data acquired from June 2016 to April 2019 within five studies conducted at two study centers [Experimental and Clinical Research Center, a cooperation of Max Delbrueck Center for Molecular Medicine and Charité – Universitätsmedizin Berlin; Institute for Neuroimmunology and Multiple Sclerosis (INIMS), Universitätsklinikum Hamburg-Eppendorf, cf. Supplementary material], in which a DT posturography was performed as part of the study protocol. The data collection was partially conducted by the authors as described in the section ‘Author contributions’. All studies included pwMS (relapsing remitting and progressive forms) with two studies (AMBOS, OPRIMS) including primarily progressive forms. Two studies included healthy subjects (VALKINECT, VIMS). All study protocols were approved by the ethics committees of the conducting institutions (CIS EA1/182/10, VALKINECT EA1/339/16, VIMS EA1/163/12 by Charité – Universitätsmedizin Berlin; AMBOS PV5408, OPRIMS PV3961, by Universitätsklinikum Hamburg-Eppendorf). Written informed consent was obtained from all participants at both study centers. Consent did not include the publication of individual data (open data).
From the total pool of patients acquired within these individual studies, patients were selected for inclusion in the present study within two steps. Firstly, patients were chosen based on predefined criteria which required fully protocol-compliant performance and documentation of the single digits modalities test (SDMT, 90 s) as a measure of cognitive processing speed [12], the expanded disability status scale (EDSS) scores as a measure of disability [13], and instrumental recording of DT posturography, as well as maximum walking speed following procedures described below. Applying these criteria resulted in 247 datasets. Subsequently, a systematic quality control (QC) of the posturography recordings was conducted, as described previously [14]. This involved the inspection of visual presentations for deviations from the test protocol and technical errors. The most common reason for exclusion was standing with open feet. The proportion of excluded data largely aligns with those reported on the original publication of the QC process [14]. This step resulted in exclusion of data from 72 pwMS and 20 HC, resulting in 155 datasets for analysis (113 pwMS and 42 HC).
Posturography was conducted with the same commercial infrared depth sensor (RGB-D camera, Microsoft Kinect V2, Redmond, WA, USA) and software for acquisition and analysis (Motognosis Labs, Motognosis GmbH, Berlin, Germany) across studies. Technical set-up and details on analysis, as well as normative data have been published previously [14–17]. In the case of longitudinal observations, the first visit which fulfilled above selection criteria was included.
A DT posturography paradigm was used to quantify CMI. In this approach, the impact of a motor challenge (i.e., closing one’s eyes) or a cognitive challenge (performing serial subtractions) or both together on postural stability in a closed feet stance is assessed in terms of the omnidirectional sway of the body center (hip center) given as the Mean angular Sway Velocity in 3D (MSV3D; °/s). The paradigm comprised two consecutively conducted runs in which the participants wore their usual footwear and were positioned at approximately 1.5 m distance from the camera:
In the first run, participants stood with their feet together and EO for 20 s followed by continued recording with EC for 20 s.
In the second run, participants stood with their feet together and were instructed to perform serial subtractions of three, starting from 100 with the start of recording, through both phases of continued recording with open eyes and closed eyes, each of 20 s duration. Additionally, the cognitive performance, measured as the number of correct subtraction steps, was documented by the operator for each phase separately.
Based on the data measured in the two runs, five parameters of CMI were computed characterizing the change in performance during a (combination of) challenge(s) relative to a given reference condition:
Romberg ratio ST: changes in motor performance caused by the sole motor challenge (i.e., postural sway during the EC with no serial subtraction condition relative to postural sway during the EO with no serial subtraction condition).
Motor DT ratio with EO: changes in motor performance resulting from the sole cognitive challenge (i.e., postural sway during the EO with serial subtraction condition relative to postural sway during the EO with no serial subtraction condition).
Romberg ratio DT: changes in motor performance with motor challenge added to a cognitive challenge (i.e., postural sway during the EC with serial subtraction condition relative to postural sway during the EO with serial subtraction condition).
Motor DT ratio with EC: changes in motor performance with cognitive challenge added to a motor challenge (i.e., postural sway during EC with serial subtraction condition to postural sway during the EC with no serial subtraction condition).
Cognitive DT ratio: Additionally, changes in cognitive performance (number of subtraction steps) caused by the motor challenge were expressed as cognitive DT ratio (Calculation Steps EO relative to Calculation Steps EC). To enable the calculation when there were no subtraction steps with EC (equal to 0), this value was changed to 1 to avoid division by 0.
Hence, ratios greater than 1 indicate an increase in body sway between two conditions or a decrease in the number of subtraction steps between two conditions. For an illustration, see Figure 1.
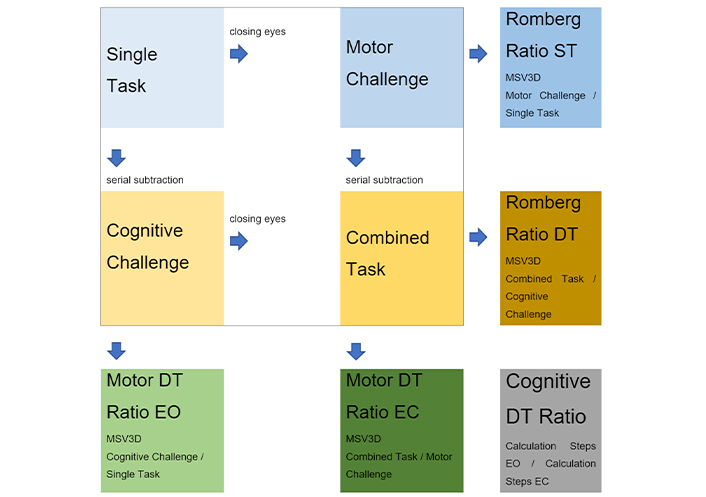
Scheme of the four posturography recording conditions [single task (ST) condition, dual task (DT) conditions, i.e., cognitive and motor challenge, and triple task condition, i.e., combined task] along with resulting data points and derivates used for analysis: Romberg ratios in ST and DT, and different DT ratios in open (EO) or closed eyes (EC) stance with usual footwear and closed feet. MSV3D: Mean angular Sway Velocity in 3D
In summary, CMI was investigated by analysis of postural stability (MSV3D) in closed feet stance with EO (ST) with two additional tasks: a motor challenge by occlusion of visual input (Romberg test), and a cognitive challenge involving serial subtractions. As a novelty over previous reports, we also report on postural stability and cognitive performance when both challenges were combined.
We employed established descriptors for levels of cognitive and motor functioning in pwMS: the number of correct answers in SDMT (90 s version) for cognitive functioning and the maximum walking speed in m/s for motor functioning, obtained as mean forward progression of the hip center from three consecutive short distance walks (SMSW) in the Motognosis Labs protocol. Finally, the EDSS step was used as a measure of clinical disability or disease severity, respectively.
A descriptive analysis of both demographic data and levels of motor and cognitive functioning was conducted for HCs, once across all pwMS irrespective of disease type [relapsing remitting multiple sclerosis (RRMS), primary progressive multiple sclerosis (PPMS), secondary progressive multiple-sclerosis (SPMS)], and once for each of these MS subtypes specifically. Due to documentation errors, information regarding sex and age was missing in five cases in the final dataset (3 RRMS, 2 HC). To differentiate pathological postural control, the 95% confidence interval of HC was suggested as previously published [15]. Accordingly, impaired postural control was assumed at an MSV3D of 0.51 °/s or higher in closed feet EC (no serial subtraction) condition. A statistical group comparison between HC and pwMS regarding their motor and cognitive functional levels was conducted for the baseline evaluation as described in Table 1 and Table S1.
Furthermore, a descriptive analysis and a statistical group comparison of motor and cognitive performances across the four measurement conditions of static posturography were conducted for both HC and pwMS. The Mann-Whitney U test was employed for this analysis as described in Table 2.
To statistically examine the effect of CMI, the posturography results between the individual conditions as described in
Lastly, correlations between the motor and cognitive functioning levels of the participants and the respective ratios (Romberg ratio ST and DT, motor DT ratio EO and EC, cognitive DT ratio) were examined using the Spearman correlation separately for HC and pwMS (Table 4).
Given the skewed distribution of the motor DT ratio EO, which exhibited a secondary peak above 2 as seen in Figure S1, we conducted an exploratory group comparison based on a motor DT ratio EO smaller or greater than 2. This comparison considered age, motor and cognitive functioning levels, along with relative performance changes in motor and cognitive tasks (Table 5).
The statistical analysis was carried out using IBM SPSS Statistics 24 (International Business Machines Corporation, Armonk, New York, US). A priori sample size analysis was not conducted.
The median age of pwMS was approximately 10 years higher than the mean age of HC, yet both groups covered a wide, similar age range. As expected, pwMS as a group showed lower cognitive functional levels than HC (SDMT mean 56 vs. 62, P = 0.004). With respect to motor function, 42% of individuals in the pwMS group featured impaired postural stability as defined above (MSV3D EC of > 0.51 °/s) and featured lower maximum walking speed than HC (median 1.53 vs. 1.68 m/s, P < 0.0001). Please see Table 1 and Table S1 for a detailed overview.
Demographic data as well as cognitive function level (SDMT), motor function level (percentage of participants with impaired postural control, maximum walking speed) and disease severity (EDSS) in comparison between healthy controls (HC) and people with multiple sclerosis (pwMS)
| Characteristics | HC | pwMS | Test value* (P) |
|---|---|---|---|
| n | 42 | 113 | na |
| Age (median, min–max) | 36 (22–80) | 46 (21–64) | 1,565 3 (0.004) |
| Sex (F; M) | 22; 18 | 52; 58 | 0.027 2 (0.870) |
| Years since diagnosis (median, min–max) | na | 5 (0–26) | na |
| EDSS (median, min–max) | na | 2.5 (0–6.5) | na |
| SDMT: correct answers in 90 s (mean, min–max) | 62 (35–83) | 56 (20–91) | 2.93 1 (0.004) |
| Percentage of participants with postural stability deviation from 95% of the norm (number, % of the total group) | 1 (2 %) | 47 (42 %) | 44.1 2 (< 0.0001) |
| SMSW in m/s (median, min–max) | 1.68 (1.19–2.21) | 1.53 (0.68–2.07) | 1,381 3 (< 0.0001) |
* Statistical tests for group comparison: 1 unpaired t-test (t-value), 2 chi-square test (chi2-value), 3 Mann-Whitney U test (Mann-Whitney U value). EDSS: expanded disability status scale; SDMT: single digits modalities test; na: not applicable
The motor and cognitive performance in all four DT posturography conditions was compared between pwMS and HC. Persons with MS as a group exhibited higher sway measures (MSV3D) in all four test conditions compared to HC. Comparison of cognitive performance (number of calculation steps) did not reach significance, yet medians were numerically lower in pwMS for calculation steps in EO condition as well as total calculation steps. Descriptives and results of between-group comparison are provided in Table 2, Figure 2A–D and Figure 3.
Results of motor and cognitive performance (median, min–max) in the dual-task experiment in group comparison: Cognitive performance was measured by the number of arithmetic steps completed with and without a motor challenge (with eyes open and closed, respectively), as well as the total number of arithmetic steps. Motor performance was measured by the mean speed of body sway in °/s (MSV3D) under the single-task, motor challenge, cognitive challenge, and combined task conditions
| Feature | HC | pwMS | Test value* (P) |
|---|---|---|---|
| Motor feature | |||
| MSV3D single task in °/s | 0.21 (0.11–0.35) | 0.26 (0.08–1.01) | 1,264 (< 0.0001) |
| MSV3D motor challenge in °/s | 0.30 (0.11–0.51) | 0.44 (0.16–1.89) | 1,045 (< 0.0001) |
| MSV3D cognitive challenge in °/s | 0.25 (0.07–1.13) | 0.41 (0.12–3.98) | 1,576 (0.001) |
| MSV3D combined task in °/s | 0.29 (0.11–1.25) | 0.45 (0.10–2.31) | 1,315 (< 0.0001) |
| Cognitive feature | |||
| Complete calculation steps | 22 (13–39) | 20 (3–36) | 1,878 (0.046) |
| Calculation steps EO | 12 (5–21) | 10 (1–21) | 1,690 (0.006) |
| Calculation steps EC | 10 (4–18) | 9 (2–17) | 2,036.5 (0.174) |
* Statistical tests for group comparison: Mann-Whitney U test (Mann-Whitney U value). EC: eyes closed; EO: eyes open; HC: healthy controls; MSV3D: Mean angular Sway Velocity in 3D; pwMS: persons with multiple sclerosis
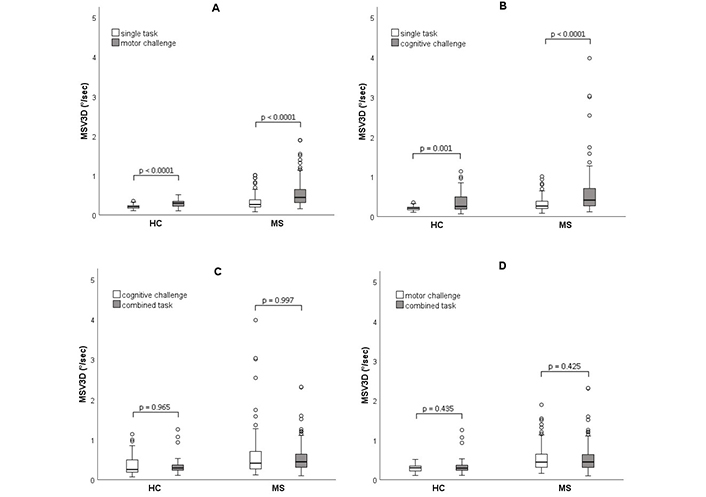
Changes in motor performance between the respective conditions due to (A) a motor challenge (eye closure), (B) a cognitive challenge (serial subtraction), (C) a motor challenge added to a cognitive task, and (D) a cognitive challenge added to a motor task were presented using boxplot diagrams. The bar represents the range from the 25th to the 75th percentile, with the black line inside the bar indicating the median. The whiskers display the range from the minimum to the maximum except for outlier values > 1.5 times the length of the box which are depicted as circles. Statistical test for group comparison: Wilcoxon test. Test values (Z): (A) HC: –4.7, MS: –8.8; (B) HC: –3.4, MS: –6.5; (C) HC: –0.4, MS: –0.004; (D) HC: –0.8, MS: –0.8. HC: healthy controls; MS: multiple sclerosis; MSV3D: Mean angular Sway Velocity in 3D
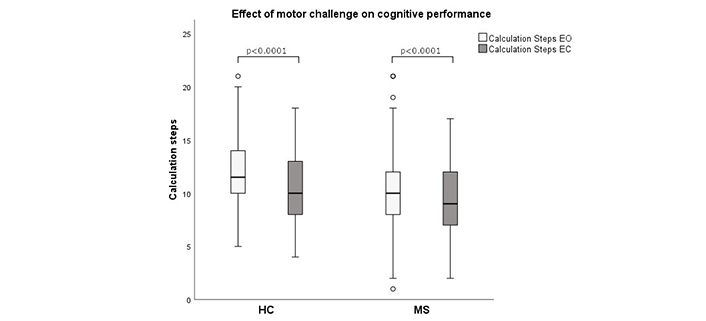
The impact of the motor challenge (eye closure) on cognitive performance (number of calculation steps) was illustrated using boxplot diagrams. The bar represents the range from the 25th to the 75th percentile, with the black line inside the bar indicates the median. The whisker displays the range from minimum to maximum except for outlier values outside 1.5 times the length of the box which are depicted as circles. Statistical test for group comparison: Wilcoxon test. Test value (Z): HC: –3.9, MS: –3.5. EC: eyes closed; EO: eyes open; HC: healthy controls; MS: multiple sclerosis
To analyse CMI, changes in both motor and cognitive performance with test conditions were described per group and respective ratios (see Figure 1) compared between groups. Results are provided in Table 3 and illustrated in Figures 2 and 3.
Presentation of changes in motor (changes in MSV3D expressed as Romberg ratio ST, motor DT ratio, Romberg ratio DT, and motor DT ratio EC) and cognitive (change in the number of arithmetic steps expressed as cognitive DT ratio) performance between the different conditions relative to their defined baseline condition (see Figure 1), expressed as a ratio (median, min–max)
| Ratios | HC | pwMS | Test value* (P) |
|---|---|---|---|
| Changes in motor performance | |||
| Romberg ratio ST | 1.38 (0.71–2.26) | 1.55 (0.63–5.91) | 1,749 (0.012) |
| Motor DT ratio EO | 1.19 (0.61–5.17) | 1.43 (0.64–17.08) | 2,813 (0.444) |
| Romberg ratio DT | 1.08 (0.32–2.50) | 1.09 (0.13–2.95) | 2,313 (0.809) |
| Motor DT ratio EC | 1.03 (0.31–4.04) | 0.97 (0.39–6.07) | 2,107 (0.284) |
| Changes in cognitive performance | |||
| Cognitive DT ratio | 1.17 (0.63–2.25) | 1.10 (0.50–2.75) | 1,932 (0.075) |
* Statistical tests for group comparison: Mann-Whitney U test (Mann-Whitney U value). DT: dual task; EC: eyes closed; EO: eyes open; HC: healthy controls; MSV3D: Mean angular Sway Velocity in 3D; pwMS: persons with multiple sclerosis; ST: single-task
For the singular motor challenge, both groups exhibited a median increase in body sway when standing with closed eyes compared to open eyes (Figure 2A), reflected in a median Romberg ratio ST of 1.55 in pwMS and 1.38 in HC (P = 0.012 for group difference).
For singular cognitive challenge, both groups showed a median increase in body sway with serial subtraction tasks performed while standing (Figure 2B). This resulted in a median motor DT ratio EO of > 1.4 in pwMS and 1.2 in HC. Few participants in the pwMS group exhibited excessive increase in body sway in this condition (Figure 2B). However, group differences were not statistically significant.
Next, the combined effect of both challenges on motor performance was investigated:
Introducing a motor challenge to the cognitive challenge (eye closure during serial subtraction) did not yield further median increases in body sway compared to single cognitive challenge condition in both groups (Figure 2C). This was reflected in a similar median Romberg ratio DT below 1.1 without difference between HC and pwMS.
Similarly, augmenting the motor challenge with the cognitive challenge (i.e., adding serial subtraction to closed eyes stance) did not result in additional increases in body sway compared to single motor challenge (i.e., closed eyes alone) in both groups (Figure 2D). This was reflected in a median motor DT ratio EC around 1 in both HC and pwMS, again showing no difference between the two groups.
Finally, concerning the effect of the motor challenge on cognitive performance, i.e., cognitive DT cost, the number of calculation steps decreased after eye closure in both groups (Figure 3). This resulted in a cognitive DT ratio around 1.1 for both groups, with no difference between pwMS and HC.
In sum, both the singular motor and cognitive challenges led to an increase in body sway and consequently altered motor performance in both groups. The motor challenge also resulted in a decrease in calculation steps, impacting cognitive performance. Group differences were observed solely for the increase in body sway due to the singular motor challenge, i.e., the classical Romberg ratio. A combined application of both challenges had no added effect on motor performance (body sway in closed stance) in either the HC or pwMS group, but rather induced a decrease in sway (ratios < 1) in a considerable number of subjects.
In a complementary analysis, we tested the link between CMI and clinical parameters. To this end, changes in motor and cognitive performance in our paradigm expressed as ratios were correlated to measures of general disability (EDSS) and cognitive and motor functioning levels (SDMT, MSV3D EC, maximum walking speed).
In brief, for Romberg ratio ST, both groups exhibited a strong correlation with MSV3D EC. This indicates a major contribution of weaker postural control to higher increases of sway with motor challenge (eye closure) while no other correlations were seen with other parameters of motor function (maximum walking speed) or cognitive function (SDMT) in both groups.
In the conventional DT test condition, both groups showed an increase in body sway with an additional cognitive challenge (motor DT ratio EO > 1) which was not correlated with the participants’ motor or cognitive functional levels or disease severity (EDSS). Conversely, in pwMS, a larger decrease in calculation steps with eye closure (higher cognitive DT ratio) was associated with lower motor and cognitive functional levels. Interestingly, further increases in body sway with the combined challenge were associated with higher functional levels, namely better postural stability in both groups and faster maximum walking speed and higher SDMT count in pwMS. For a detailed report of findings obtained in these analyses, please see Table 4.
The results of Spearman’s rank correlations between changes in motor and cognitive performance expressed as ratios (see Figure 1) with disease severity (EDSS), motor (maximum walking speed, MSV3D in EC condition), and cognitive (SDMT) functional levels. The correlation coefficient rho and the P-value are provided. Significant results are highlighted using asterisks: P of 0.05–0.001 (*) and P < 0.001 (**)
| Ratios | Correlation coefficient (rho) and P value (P) | EDSS | SMSW | MSV3D EC | SDMT |
|---|---|---|---|---|---|
| Ratios in pwMS | |||||
| Romberg ratio ST | Rho | 0.003 | 0.056 | 0.526** | 0.018 |
| P | 0.978 | 0.564 | < 0.0001 | 0.848 | |
| Motor DT ratio EO | Rho | –0.114 | 0.021 | –0.089 | 0.147 |
| P | 0.23 | 0.829 | 0.348 | 0.120 | |
| Romberg ratio DT | Rho | –0.005 | 0.212* | 0.134 | 0.067 |
| P | 0.958 | 0.026 | 0.158 | 0.480 | |
| Motor DT ratio EC | Rho | –0.14 | 0.186 | –0.338** | 0.237* |
| P | 0.14 | 0.051 | < 0.0001 | 0.012 | |
| Cognitive DT ratio | Rho | 0.139 | –0.018 | 0.226* | –0.214* |
| P | 0.143 | 0.850 | 0.016 | 0.023 | |
| Ratios in HC | |||||
| Romberg ratio ST | Rho | 0.098 | 0.737** | 0.068 | |
| P | 0.537 | < 0.001 | 0.667 | ||
| Motor DT ratio EO | Rho | –0.13 | –0.147 | –0.055 | |
| P | 0.413 | 0.353 | 0.732 | ||
| Romberg ratio DT | Rho | 0.049 | 0.203 | 0.037 | |
| P | 0.758 | 0.197 | 0.848 | ||
| Motor DT ratio EC | Rho | –0.027 | –0.496* | –0.177 | |
| P | 0.867 | 0.001 | 0.263 | ||
| Cognitive DT ratio | Rho | 0.037 | 0.083 | –0.197 | |
| P | 0.818 | 0.600 | 0.211 | ||
DT: dual task; EC: eyes closed; EDSS: expanded disability status scale; EO: eyes open; HC: healthy controls; MSV3D: Mean angular Sway Velocity in 3D; pwMS: persons with multiple sclerosis; SDMT: single digits modalities test; SMSW: short distance maximum walking speed in m/s; ST: single-task
To investigate this finding further, we compared demographics, motor and cognitive functional levels, and outcomes of combined DT posturography between groups classified according to their motor DT cost, i.e., increase in body sway under classical DT conditions (motor DT ratio EO). To this end, participants were divided into two groups according to motor DT ratio EO smaller or larger than 2 (26% of HC and 28% of pwMS for the latter). The threshold was set after inspection of the histogram (Figure S1). Those with larger increase in sway with motor challenge (motor DT ratio EO > 2) were nominally younger (not significant) in both groups and showed a trend for higher SDMT count in pwMS (60 vs. 55, P = 0.089) and a trend for fewer DT calculation steps in HC (20 vs. 23, P = 0.087). Most notably, there was a consistent reduction in sway when a motor challenge was added to the cognitive challenge with median Romberg ratio DT well below 1 in both groups (0.72 in pwMS and 0.57 in HC) that was not observed in the subgroup with motor DT ratio EO of < 2 (P < 0.0001 for comparison between subgroups). The opposite pattern was seen when a cognitive challenge was added to the motor challenge (motor DT ratio EC). Descriptives for these subgroups are provided in Table 5 and Figure S2.
Explorative comparison between subgroups with a motor DT ratio EO of less or greater than 2. Comparison of demographic data, cognitive and motor functional levels as well as comparison of the relative performance changes in motor and cognitive tasks between the conditions of DT posturography
| Characteristics | pwMS | HC | |||
|---|---|---|---|---|---|
| Motor DT ratio EO | Motor DT ratio EO | ||||
| < 2 (n = 81) | > 2 (n = 32) | < 2 (n = 31) | > 2 (n = 11) | ||
| Cognitive and motor functional levels | |||||
| Age | Median (min–max) | 49 (21–64) | 40 (24–64) | 41 (22–80) | 32 (23–67) |
| Test value 1 (P) | 945.5 (0.064)* | 109.5 (0.102)* | |||
| SDMT | Mean (min–max) | 55 (20–91) | 60 (30–87) | 62 (35–83) | 62 (52–76) |
| Test value 2 (P) | –1.725 (0.089)* | –0.077 (0.939) | |||
| SMSW in m/s | median (min–max) | 1.54 (0.68–2.07) | 1.53 (0.80–1.92) | 1.68 (1.23–2.21) | 1.72 (1.19–1.98) |
| Test value 1 (P) | 1,230.0 (0.906) | 169.0 (0.978) | |||
| Relative performance changes in motor and cognitive tasks | |||||
| Romberg ratio ST | Median (min–max) | 1.64 (0.63–3.65) | 2.12 (0.97–5.91) | 1.44 (0.71–2.26) | 1.31 (0.92–1.96) |
| Test value 1 (P) | 929.0 (0.019)* | 137.0 (0.350)* | |||
| Romberg ratio DT | Median (min–max) | 1.18 (0.45–2.95) | 0.72 (0.13–1.51) | 1.31 (0.49–2.50) | 0.57 (0.32–1.48) |
| Test value 1 (P) | 508.0 (< 0.0001)* | 49.0 (< 0.0001)* | |||
| Motor DT ratio EC | Median (min–max) | 0.88 (0.39–1.97) | 1.15 (0.47–6.07) | 0.96 (0.31–2.23) | 1.59 (0.56–4.04) |
| Test value 1 (P) | 617.0 (< 0.0001)* | 67.0 (0.002)* | |||
| Cognitive DT ratio | Median (min–max) | 1.10 (0.50–2.75) | 1.06 (0.71–1.83) | 1.15 (0.63–1.83) | 1.33 (0.69–2.25) |
| Test value 1 (P) | 1,245.0 (0.747) | 128.0 (0.233) | |||
* Graphical representation in Figure S2; 1 Mann-Whitney U test (Mann-Whitney U value); 2 unpaired t-test (t-value). DT: dual task; EC: eyes closed; EO: eyes open; HC: healthy controls; pwMS: persons with multiple sclerosis; SDMT: single digits modalities test; SMSW: short distance maximum walking speed in m/s; ST: single-task
The physiological and disease-specific effects of CMI are controversial. Specifically, the interpretation of the current data is complicated by two points: firstly, due to the scarcity of reported changes in cognitive performance, the interaction between motor and cognitive performance alterations cannot be adequately depicted. Secondly, conflicting information exists in the existing literature regarding whether and to what extent CMI represents a disease-specific or physiological effect. In addition, for posturography results, there is some inconsistency regarding the interpretation of increased postural sway as reflective of impaired postural control, which may depend on stance condition. The aim of this study was to contribute to the understanding of CMI in pwMS. To achieve this, CMI was examined in a posturography paradigm in HC and pwMS. Extending previous work, we report both, cognitive and motor performance in single and in combined motor and cognitive tasks. The sample size was higher than in similar studies that employed a comparable measurement paradigm [3, 5] to allow robust statements.
In our study, postural sway was consistently higher in pwMS than HC in all conditions, with fewer calculation steps in serial subtractions. An effect of CMI was demonstrated in both HC and pwMS without significant group differences.
An explanation for the lack of group differences could be that the examined pwMS population, especially those with RRMS, exhibited relatively mild disease severity, possibly not representing motor and cognitive functional levels on a wider scale. Studies on CMI typically involve participants who can still walk and stand, leading to a selection bias and a distortion of results in the pwMS group compared to the overall population, where a higher severity of the disease is often associated with greater limitations in mobility. However, the measured degrees of motor and cognitive impairment in the pwMS group were clinically relevant compared to HC. This suggests that the effect of CMI occurs physiologically.
Further, correlation results point to dependency of CMI behaviour on the individual’s motor and cognitive functioning level as well as the complexity of the task, which leads to a prioritization of either the motor or the cognitive task. This is likely related to heterogeneous, unconsciously selected adaptation strategies. Alternatively, it should be discussed that the body sway itself may have an impact on postural control, potentially resulting in an improvement in postural control under increased demand. Particularly, an increase in body sway results in greater sensory input conveyed to the brain. Increased sensory input corresponds to greater neuronal engagement, potentially enabling the brain to enhance processing of the task involving upright standing position, thereby compensating for the additional neural recruitment necessitated by the interfering tasks.
In contrast to previous studies that interpreted an increase in body sway due to a cognitive task as a disease-specific effect related to motor and cognitive deficits [5], our results show that persons with lower motor or cognitive functioning levels tend to show a smaller increase in body sway with cognitive challenge. This can be interpreted such that balance may be controlled at the expense of efforts allocated to cognitive performance in this task which would form an appropriate strategy to stabilize upright posture in these circumstances. Increased attention for maintaining balance may lead to a limitation of resources for cognitive processing and thus to lower performance in the competing cognitive task [6]. In addition, our findings indicate a greater CMI only for cognitive, but not motor performance in more impaired individuals reflected in a higher cognitive DT ratio in those individuals.
Conversely, an exploratory subgroup comparison showed that pwMS who presented more than a doubling in body sway due to a cognitive challenge tended to be younger, had better postural stability (MSV3D) and a higher level of cognitive function. This might allow for a prioritization of the cognitive task, as an increase in body sway can be tolerated without risking instability or fall. However, it should be noted that only data sets were included where DT posturography was performed without falls or stepping, which represents a selection bias and ceiling effects cannot be adequately assessed.
Interestingly, in this analysis step, those HC and pwMS who presented a more than twofold increase in body sway due to a cognitive task showed no further increase or even a decrease in body sway when a motor task had to be mastered in addition. This suggests that with increasing complexity of the required tasks, a physiological adaptation of postural control occurs even in the test subjects with a better motor and cognitive functional level (and healthy subjects). Ultimately, the more complex task also resulted in an increasing prioritization of the motor task in this study group, which could explain the decrease in calculation steps with closed eyes. It can therefore be assumed that there was an initial prioritization of the cognitive task when standing with EO, resulting in increase of body sway, which could be tolerated due to the good level of function. With an additional motor challenge in the sense of closing the eyes, it was then also necessary for this group to prioritize the motor task. It is worth mentioning at this point that the SDMT is primarily regarded as a measure of cognitive processing speed. Further studies are needed to investigate whether this association also holds true for cognitive deficits in other domains.
Our results suggest that a sole assessment of the motor performance in a cognitive DT paradigm without assessment of the cognitive performance is not sufficient to represent the effect of CMI as a whole. The lack of assessment of changes in cognitive performance can be considered a major flaw in previous studies, in which increase in body sway due to a cognitive challenge was interpreted as a deterioration in motor performance in the sense of a disease-specific effect and a corresponding prioritization may have been overlooked.
With respect to the correlation analysis, observed correlations between motor and cognitive function levels in our study were not reflected in correlations with severity of the disease in terms of the EDSS. This could be due to the ordinal scaling property and the lack of normal distribution of the EDSS. Especially in the low score range, there might not be sufficient differentiation regarding causal motor or cognitive impairments. Further correlation analyses with respect to specific individual impairments (measured through quantitative functional tests or patient questionnaires), rather than relying solely on the total EDSS score, could potentially provide more valuable insights and should be explored in future studies.
The infrared depth sensor method used to record the posturography paradigm has the advantage of easy handling and largely automated calculation of essential parameters. While theoretically more error-prone compared to the gold standard of three-dimensional motion analysis systems (e.g., Mx3þ VICON, California, USA), previous comparative studies have demonstrated sufficient accuracy and reliability, particularly concerning the movement of the body axis [17]. Additionally, the infrared depth sensor-based posturography allows for post-analysis visualization and verification of movement execution which was used here to apply a rigorous quality control of measurements. Unfortunately, this resulted in considerable number of exclusions from analysis due to deviations of protocol but in turn, added more robustness to our findings. Data exclusion by QC may be mitigated in future prospective studies by improved standard operating procedures and appropriate flagging of recordings by trained operators.
It should be noted that the CMI effect and the observed prioritization strategies can indeed be relevant in daily life, as DT demands are frequent and may occur unexpectedly in everyday life. For example, it has been demonstrated that the mean walking speed in everyday life corresponds more closely to the DT walking speed rather than the mean walking speed in lab assessments [18]. If a patient with cognitive or motor limitation chooses to prioritize cognitive tasks in such situations, this could increase fall risk if motor compensation is insufficient. In this context, DT posturography and specifically higher cognitive DT along with rather low motor DT cost should be further explored in relation to risk of falls.
Further research and comprehensive reporting in subgroups with and without cognitive limitations in different disorders, preferably including assessment of everyday locomotor functioning, could contribute to our understanding and improved detection of compromised DT-functioning. Importantly, the better prediction will help to allocate recently evolving DT-based training concepts [19–22].
In conclusion, CMI was observed in both HC and pwMS, with evidence of changes in both motor and cognitive performance in the dual and triple task condition. As no group differences were observed, CMI can be interpreted as a physiological way to adapt performance to task demands. Still, results indicate some influence of cognitive and motor functional levels. It is noteworthy that the well-known increase in body sway with DT was observed in younger and higher-functioning individuals in both groups. In contrast, the decrease in cognitive performance with triple task, which has been scarcely reported in previous studies, was associated with lower cognitive and motor functional levels only in pwMS. This suggests that in this CMI posturography paradigm, it is not the increase of postural sway, i.e., the motor DT cost, but the cognitive DT cost in the sense of de-priorisation of cognitive task, that reflects disease-related impairment in pwMS.
CMI: cognitive-motor interference
DT: dual task
EC: eyes closed
EDSS: expanded disability status scale
EO: eyes open
HC: healthy controls
MS: multiple sclerosis
MSV3D: Mean angular Sway Velocity in 3D
RRMS: relapsing remitting multiple sclerosis
pwMS: persons with multiple sclerosis
PPMS: primary progressive multiple sclerosis
QC: quality control
SDMT: single digits modalities test
SPMS: secondary progressive multiple sclerosis
ST: single-task
The supplementary materials for this article are available at: https://www.explorationpub.com/uploads/Article/file/100482_sup_1.pdf.
We express our sincere gratitude to Karen Otte for her invaluable support and expertise and her contributions in regard of data curation, formal analysis, resources and software. We further acknowledge institutional support for study conduct at Berlin site by NCRC - Neuroscience Clinical Research Center funded by the Deutsche Forschungsgemeinschaft (DFG, German Research Foundation) under Germany’s Excellence Strategy – EXC-2049–390688087 and Charité-BIH Clinical Study Center.
PA: Conceptualization, Data curation, Formal analysis, Investigation, Visualization, Writing—original draft, Writing—review & editing. FR and SCR: Investigation, Writing—review & editing. EMD and MW: Writing—original draft, Writing—review & editing. DD: Data curation, Investigation, Resources, Writing—review & editing. RA and AC: Data curation, Investigation, Writing—review & editing. JBS: Project administration, Resources, Writing—review & editing. CH: Project administration, Resources, Supervision, Writing—review & editing. FP: Funding acquisition, Project administration, Resources, Supervision, Writing—review & editing. TSH: Conceptualization, Project administration, Data curation, Formal analysis, Investigation, Resources, Supervision, Writing—original draft, Writing—review & editing.
The authors declare that they have no conflicts of interest.
All study protocols were approved by the ethics committees of the conducting institutions (CIS EA1/182/10, VALKINECT EA1/339/16, VIMS EA1/163/12 by Charité – Universitätsmedizin Berlin; AMBOS PV5408, OPRIMS PV3961, by Universitätsklinikum Hamburg-Eppendorf).
All participants at both study centers provided informed consent for data acquisition and data sharing and analysis.
Not applicable.
Raw data for this analysis are archived at the institution which acquired the data without consent for open sharing. Requests for data sharing should be addressed to the corresponding author and decisions will be made in accordance with the principal investigators of concerned studies.
Not applicable.
© The Authors 2024.
Copyright: © The Author(s) 2024. This is an Open Access article licensed under a Creative Commons Attribution 4.0 International License (https://creativecommons.org/licenses/by/4.0/), which permits unrestricted use, sharing, adaptation, distribution and reproduction in any medium or format, for any purpose, even commercially, as long as you give appropriate credit to the original author(s) and the source, provide a link to the Creative Commons license, and indicate if changes were made.

View: 2918
Download: 31
Times Cited: 0
