Original Article

Affiliation:
1Molecular Neurobiology Laboratory, Department of Biochemistry and Molecular Biomedicine, Universitat de Barcelona, 08028 Barcelona, Spain
†These authors contributed equally to this work.
Affiliation:
1Molecular Neurobiology Laboratory, Department of Biochemistry and Molecular Biomedicine, Universitat de Barcelona, 08028 Barcelona, Spain
†These authors contributed equally to this work.
ORCID: https://orcid.org/0000-0001-9316-0721
Affiliation:
1Molecular Neurobiology Laboratory, Department of Biochemistry and Molecular Biomedicine, Universitat de Barcelona, 08028 Barcelona, Spain
Affiliation:
2Independent Researcher, Pintor Joaquín 17, 30009 Murcia, Spain
Affiliation:
3Department of Ophtalmology, Oftalmedic Salvà and I.P.O. Institute of Ophthalmology, 07013 Palma de Mallorca, Spain
Affiliation:
4Department of Optometry, College of Applied Medical Sciences, Qassim University, 52571 Buraidah, Saudi Arabia
ORCID: https://orcid.org/0000-0002-7452-9287
Affiliation:
5Independent Researcher, 08018 Barcelona, Spain
Email: bernalcdub1@gmail.com
ORCID: https://orcid.org/0000-0002-4623-5935
Affiliation:
1Molecular Neurobiology Laboratory, Department of Biochemistry and Molecular Biomedicine, Universitat de Barcelona, 08028 Barcelona, Spain
6CiberNed, Network Center for Neurodegenerative Diseases, Spanish National Health Institute Carlos III (ISCIII), 28029 Madrid, Spain
7School of Chemistry, Universitat de Barcelona, 08028 Barcelona, Spain
Email: rfranco123@gmail.com; rfranco@ub.edu
ORCID: https://orcid.org/0000-0003-2549-4919
Explor Neuroprot Ther. 2025;5:100497 DOI: https://doi.org/10.37349/ent.2025.100497
Received: December 15, 2024 Accepted: February 06, 2025 Published: February 24, 2025
Academic Editor: Ta-Yuan Chang, Geisel School of Medicine at Dartmouth College, USA
Aim: This study investigates the association between ApoE genotype, plasma cholesteryl ester (CE) levels, and Alzheimer’s disease (AD) status, with a focus on CE(20:4) and CE(22:5) levels as potential indicators of lipid metabolism alterations in AD patients.
Methods: Publicly available metabolomics data (DOI: 10.3233/JAD-215448) from 94 AD patients and 62 controls aged 55 and older were re-analyzed. CE levels were examined using non-parametric tests due to the non-normal overall data distribution. Comparisons were stratified by ApoE genotypes (ε3/ε3 and ε3/ε4).
Results: Significant increases in CE(20:4) and CE(22:5) levels were observed in AD patients with the ApoE ε3/ε4 genotype compared to controls (p-values 0.0387 and 0.0348, respectively). No significant differences were found for other CEs or among ε3/ε3 carriers (except for sex). Overlap between CE levels in AD and control groups limits their potential as diagnostic biomarkers but underscores their role in lipid dysregulation in AD pathophysiology.
Conclusions: Elevated CE(20:4) and CE(22:5) levels in ε3/ε4 AD patients highlight lipid metabolism alterations associated with ApoE genotype. While not providing standalone biomarkers, these findings offer insights into AD-related lipid dysregulation and warrant further investigation in high-risk ε4/ε4 carriers and therapeutic targeting of lipid metabolism.
Alzheimer’s disease (AD) is the most prevalent form of dementia, affecting millions of individuals worldwide. It is characterized by progressive cognitive decline, memory loss, and behavioral impairments, with hallmark pathological features including amyloid-beta (Aβ) plaques, tau neurofibrillary tangles, neuroinflammation, and synaptic dysfunction [1]. While the etiology of AD remains multifactorial, genetic predisposition plays a critical role in modulating risk and progression. Among the genetic factors, the apolipoprotein E (ApoE) gene is the most significant determinant of late-onset AD risk [2]. ApoE is a lipid transport protein involved in the regulation of cholesterol and lipid homeostasis, as well as the clearance of Aβ from the brain. The three major ApoE isoforms—ε2, ε3 and ε4—exert differential effects on these processes, with ApoE ε4 associated with an increased risk of AD, while ApoE ε2 provides protection [3]. Despite significant progress in understanding the role of ApoE in AD, its influence on systemic metabolic alterations remains underexplored.
Emerging evidence indicates that lipid metabolism is intricately linked to AD pathophysiology, particularly through its impact on membrane integrity, synaptic function, and amyloid deposition. Cholesteryl esters (CEs), the storage form of cholesterol in plasma, are increasingly recognized as key metabolites that may bridge the gap between ApoE function and AD pathology [4]. Transported within lipoproteins, CEs are influenced by the lipid-handling capacity of ApoE isoforms, suggesting that CE profiles may reflect both systemic and brain-specific lipid perturbations in AD [5]. Recent advances in metabolomics have enabled the comprehensive profiling of plasma metabolites, providing an opportunity to identify biomarkers and metabolic pathways associated with AD. In particular, lipidomics has highlighted changes in specific CE species that may inform disease mechanisms or predict risk in genetically predisposed individuals [6].
For this study, we took advantage of data obtained using novel metabolomics technologies that are available in the report by Kalecký et al., (2022) [7]. We re-analyzed data to investigate the relationship between ApoE genotype, plasma metabolite levels, and AD status. The dataset includes comparable data on the levels of multiple metabolites measured in the plasma from controls and AD patients, with the ApoE genotype recorded for everyone. While the dataset contains one case with an ApoE ε2/ε2 genotype and few cases with the ApoE ε4/ε4 (6 AD and 2 controls) genotype, it provides sufficient sample size to analyze metabolic differences in ε3/ε3 and ε3/ε4 combinations. Among the analyzed metabolites, we identified a significant increase in cholesteryl esters CE(20:4) and CE(22:5) in the plasma of AD patients with the ApoE ε3/ε4 genotype compared to controls with the same genotype. Importantly, no significant differences were observed between patients and controls for other metabolites in either ε3/ε3 or ε3/ε4 combinations.
The identification of a novel association between two CEs and AD in ApoE ε3/ε4 patients provides new insights into the interplay between lipid metabolism, ApoE genotype, and AD pathology. By leveraging metabolomics data from Kalecký et al., (2022) [7], we illustrate the potential of re-analyzing existing datasets to uncover genotype-specific metabolic signatures that can advance our understanding of AD mechanisms. Further studies are needed to confirm this finding and to investigate its relevance in high-risk individuals with the ApoE ε4/ε4 genotype.
Data was retrieved from a previous study [7] in which a targeted metabolomics approach using the Biocrates MxP® Quant 500 system was undertaken using plasma and cerebral cortex samples from AD patients and healthy controls. In this study, we re-analyzed only the data coming from plasma samples. The cohort is described as follows: “Plasma samples were obtained from 94 AD cases and 64 control subjects, which were part of a longitudinal study conducted by the Texas Alzheimer’s Research and Care Consortium (TARCC). The study was performed in 2005–2018 with participants, older than 55 years, recruited at dementia clinics of the TARCC member institutions. Controls included volunteers and family members” [7]. For the purposes of our analysis, the data was retrieved from the supplementary files; data from two controls (PX009 and PX025) were excluded due to missing metabolite levels, suggesting issues in the collection and/or processing of these samples. The set of data we have used and that is provided as Table S1, contains demographic data, ApoE genotype and comparable values of the level of the CEs that can be determined using Biocrates MxP® Quant 500. All individuals were older than 55 and part of a study conducted by TARCC (Texas Alzheimer’s Research and Care Consortium) [8].
Using plasma from controls and patients, a targeted metabolomic approach was followed using the Biocrates MxP® Quant 500 targeted kit (Biocrates Life Sciences AG, Innsbruck, Austria). This kit can potentially quantify up to 524 lipids in flow-injection mode (FIA-MS/MS) and 106 small molecules in chromatography mode. Mass spectrometry is the procedure allowing the production of quantitative data. For this purpose, a triple quadrupole ultra-high-resolution liquid chromatograph and a tandem mass spectrometry coupled to a mass spectrometer were used. For our analysis, only data corresponding to the CEs detectable with the Biocrates kit were retrieved.
The study by Kalecký et al., (2022) [7] used Biocrates MetIDQ™ Oxygen-DB110-3005 for peak identification and computation of area under the peak. Further details of data production are given in the Kalecký et al., (2022) [7].
The analysis was performed in RStudio (2024.09.0+375), and included the usage of packages such as dplyr, tidyr, and ggplot2.
Taking the raw data in Table S1, normality tests were performed to select the methods for comparing data from patients and controls. For each CE mean was computed and comparisons were done using the Student’s t test in case of normality of data; otherwise the Mann-Whitney test was used. It is important to note that for most CEs, the data did not follow a normal distribution.
Due to the low number of samples from ε2/ε2 and ε4/ε4 carriers, subsequent analysis focused on data filtered for ε3/ε3 and ε3/ε4 genotypes. Means and medians were calculated separately for each genotype and then for genotype and clinical condition. In this step, some CE metabolites such as CE(20:0), CE(22:2), and CE(22:6) showed a discrepancy between mean and median, suggesting asymmetric distributions or the presence of outliers. To confirm these observations, data distributions were assessed using the Shapiro-Wilk test for normality and the Levene test for homogeneity of variances. Only 5 out of 44 metabolite/genotype combinations met the criteria for normality and homogeneity of variance. For most data, non-parametric tests were required, confirming the non-normal nature of the distributions.
To evaluate the effect of sex on CE levels, we performed a separate analysis considering only subgroups where both males and females were present. Wilcoxon tests were applied to compare CE levels between sexes in patients and control subgroups with ε3/ε3 and ε3/ε4 genotypes. p-values were adjusted for multiple testing using the Benjamin-Hochberg method.
Fold changes [Alzheimer’s disease/control (AD/NC)] were calculated for each metabolite in each genotype. The Kruskal-Wallis test was used to compare AD and NC for each metabolite within each genotype.
The data used for comparing CE data between samples of AD patients and control individuals and for statistical analysis considering ApoE genotype is provided in Table S1. Table S1 contains data retrieved from the supplementary files of the Kalecký et al., (2022) [7]. With few exceptions, the values for both AD and control groups do not follow a Gaussian distribution. The list with means for all the CEs is in Table 1, which also shows the fold change of the mean of AD versus controls. While the mean levels of many CEs are similar between AD and control groups, the most pronounced differences were observed for CE(16:1), CE(20:0), CE(20:1), CE(22:2) and CE(22:5). Setting the threshold in 0.8 and 1.2, the compounds with lower fold change (AD versus controls) were CE(20:0), CE(20:1) and CE(22:2), and those with greater fold change were CE(16:1) and CE(22:5) (Table 1). Table 2 provides the statistical parameters for the CEs that have more distant mean comparing patients and controls, regardless of ApoE genotype. By ANOVA in case of normal distribution or by the Kruskal-Wallis test in the absence of normality the p-values for all comparisons were > 0.05. This indicates that no CE could be identified to distinguish between patients and healthy controls based on mean difference alone.
Comparative mean values for CEs and fold change [Alzheimer’s disease (AD) versus control (NC)]
| CE | Mean_AD | Mean_NC | Fold_Change |
|---|---|---|---|
| CE(14:0) | 0.0257 | 0.0246 | 1.0460 |
| CE(14:1) | 0.0013 | 0.0012 | 1.0662 |
| CE(15:0) | 0.0060 | 0.0061 | 0.9747 |
| CE(15:1) | 0.0006 | 0.0005 | 1.1022 |
| CE(16:0) | 0.1442 | 0.1451 | 0.9939 |
| CE(16:1) | 0.0821 | 0.0697 | 1.1787 |
| CE(17:0) | 0.0046 | 0.0046 | 0.9983 |
| CE(17:1) | 0.0048 | 0.0046 | 1.0605 |
| CE(18:0) | 0.0221 | 0.0219 | 1.0072 |
| CE(18:1) | 0.2928 | 0.2839 | 1.0311 |
| CE(18:2) | 1.7756 | 1.7135 | 1.0363 |
| CE(18:3) | 0.0944 | 0.0865 | 1.0910 |
| CE(20:0) | 0.0048 | 0.0072 | 0.6701 |
| CE(20:1) | 0.0024 | 0.0037 | 0.6431 |
| CE(20:3) | 0.0355 | 0.0339 | 1.0502 |
| CE(20:4) | 0.4732 | 0.4286 | 1.1039 |
| CE(20:5) | 0.0717 | 0.0736 | 0.9737 |
| CE(22:0) | 0.0004 | 0.0005 | 0.8597 |
| CE(22:1) | 0.0004 | 0.0004 | 0.8790 |
| CE(22:2) | 0.0011 | 0.0015 | 0.7194 |
| CE(22:5) | 0.0047 | 0.0041 | 1.1495 |
| CE(22:6) | 0.0414 | 0.0428 | 0.9677 |
Mean, standard deviation (SD), and statistical parameters in Alzheimer’s disease (AD) and control cases for CE(16:1), CE(20:0), CE(20:1), CE(22:2), and CE(22:5)
| CE | AD (SD) | Control (SD) | T-statistic | p-value |
|---|---|---|---|---|
| CE(16:1) | 0.082 (0.040) | 0.067 (0.042) | 0.784 | 0.436 |
| CE(20:0) | 0.0050 (0.0038) | 0.0069 (0.026) | –0.961 | 0.343 |
| CE(20:1) | 0.0024 (0.0018) | 0.0036 (0.013) | –1.011 | 0.319 |
| CE(22:2) | 0.0011 (0.00078) | 0.0014 (0.0060) | –0.840 | 0.406 |
| CE(22:5) | 0.0047 (0.0016) | 0.0039 (0.0020) | 1.040 | 0.302 |
Subsequently, a similar approach was undertaken but stratifying by ApoE genotype. Since in the cohort there were only one individual with ApoE ε2/ε2 genotype and two controls with ApoE ε4/ε4 genotype, we focused solely on data from those individuals having ε3/ε3 and ε3/ε4 genotypes. The number of samples of AD patients with ε3/ε3 and ε3/ε4 genotypes was, respectively, 50 and 37. The number of control samples with ε3/ε3 and ε3/ε4 genotypes was 36 and 24, respectively. The median value for each CE was computed for all individuals and stratified by ApoE genotype. Due to the large variability of data, pairwise comparisons were performed using the Kruskal-Wallis test. Table 3 shows the median stratified by genotype.
Median depending on disease [Alzheimer’s disease (AD) or healthy control (NC)] and genotype
| Metabolite | AD (ε3/ε3) | AD (ε3/ε4) | NC (ε3/ε3) | NC (ε3/ε4) |
|---|---|---|---|---|
| CE(14:0) | 0.023643 | 0.024007 | 0.023225 | 0.017911 |
| CE(14:1) | 0.001242 | 0.001078 | 0.001151 | 0.000897 |
| CE(15:0) | 0.005566 | 0.006095 | 0.005907 | 0.005832 |
| CE(15:1) | 0.000476 | 0.000526 | 0.000471 | 0.000480 |
| CE(16:0) | 0.122656 | 0.128423 | 0.130894 | 0.134049 |
| CE(16:1) | 0.072250 | 0.062645 | 0.064884 | 0.049666 |
| CE(17:0) | 0.004572 | 0.004669 | 0.004495 | 0.004566 |
| CE(17:1) | 0.004720 | 0.004743 | 0.004483 | 0.003734 |
| CE(18:0) | 0.020752 | 0.021065 | 0.021088 | 0.020039 |
| CE(18:1) | 0.277685 | 0.274327 | 0.278495 | 0.247032 |
| CE(18:2) | 1.788830 | 1.763925 | 1.749266 | 1.566733 |
| CE(18:3) | 0.084403 | 0.080391 | 0.082900 | 0.069042 |
| CE(20:0) | 0.003211 | 0.003029 | 0.002426 | 0.002688 |
| CE(20:1) | 0.001617 | 0.001664 | 0.001423 | 0.001393 |
| CE(20:3) | 0.034856 | 0.033943 | 0.034998 | 0.027941 |
| CE(20:4) | 0.432905 | 0.516135 | 0.378761 | 0.412623 |
| CE(20:5) | 0.052278 | 0.046796 | 0.057388 | 0.064487 |
| CE(22:0) | 0.000407 | 0.000386 | 0.000357 | 0.000324 |
| CE(22:1) | 0.000305 | 0.000280 | 0.000290 | 0.000341 |
| CE(22:2) | 0.000652 | 0.000651 | 0.000443 | 0.000450 |
| CE(22:5) | 0.004363 | 0.004429 | 0.003872 | 0.003546 |
| CE(22:6) | 0.036965 | 0.034429 | 0.040133 | 0.043817 |
No significant differences in CE levels were detected between AD patients and controls carrying the ε3/ε3 genotype. The statistical analysis considered some less relevant comparisons, such as comparing AD with ε3/ε3 versus controls with ε3/ε4 (or vice versa), which were not informative. In contrast, when the ε3/ε4 was considered, significantly different medians were found for CE(20:4) and CE(22:5) with p-values of 0.0387 and 0.0348, respectively.
Box plots of the levels of these two CEs for patients and controls with the ε3/ε4 genotype (Figure 1) show marked overlap meaning that none of these two CEs can be considered as a biomarker of AD. While the levels of these two CEs tend to be higher in AD patients with ε3/ε4 genotype compared to controls, no threshold could achieve enough sensitivity and specificity to make them useful diagnostic markers. In the box plots in Figure 1 it is noticeable the difference in median between patients (red) and controls (blue) in the case of CE(20:4) and of CE(22:5). In contrast, the median value of the box plot for CE(18:0) is very similar in AD and controls. The median values for the remaining CEs were similar when comparing patients and controls with the same genotype. In summary, although no CE can be considered a biomarker for AD, the median levels of CE(20:4) and CE(22:5) were significantly different between AD cases and controls with the ε3/ε4 genotype.
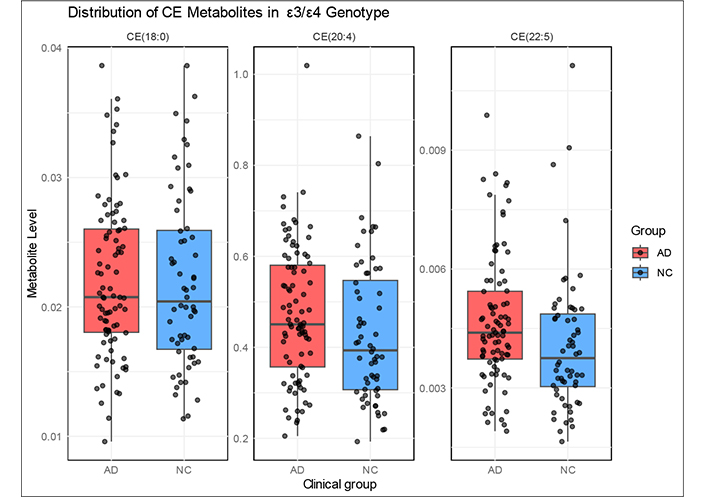
Box and whiskers plots of the plasma levels of CE(18:0), CE(20:4), and CE(22:5) in controls and in patients. The horizontal line in each box is the media, which indicates the middle quantile (50th percentile). Top and bottom extremes of the boxes indicate, respectively, the 75% and 25% quartiles. The points extending outside the whiskers are outliers
The analysis of sex differences in CE levels revealed that most CEs did not show significant variation between males and females. However, CE(22:5) exhibited significant sex differences in both controls and patients with the ApoE ε3/ε3 genotype (p-values of 0.0370 and 0.0239, respectively), while CE(20:4) showed no significant differences.
In this study, we re-analyzed publicly available metabolomics data from [7], which includes plasma metabolite levels from controls and AD patients with known ApoE genotypes. This dataset provides a robust sample size for analyzing metabolic changes in individuals carrying the ApoE ε3/ε3 and ε3/ε4 genotypes. Among the metabolites analyzed, we identified a significant increase in the median of CE(20:4) and CE(22:5) in AD patients with the ApoE ε3/ε4 genotype compared to controls with the same genotype. Importantly, no significant differences were observed for other metabolites or genotype combinations. However, the substantial overlap in CE levels between patients and controls limits their potential as diagnostic markers. Instead, their tendency to be elevated in patients reflects lipid metabolic alterations associated with the disease, particularly in the context of ε3/ε4 carriers.
There is evidence that CE levels vary in patients with neurological disturbances. For example, the overall CE levels are elevated in the caudate and putamen nuclei of patients with Huntington’s disease [9]. Given the wide structural diversity of CEs, which is determined by the size and number of double bonds of their acyl side chains, it remains a challenge to identify which specific compounds are increased or decreased in disease states. Some CEs may emerge as potential biomarkers when analyzed in plasma or cerebrospinal fluid. A small randomized trial of supplementation with docosahexaenoic acid, a polyunsaturated fatty acid, showed that certain CE levels in plasma and/or cerebrospinal fluid increased upon supplementation, with ApoE genotype influencing the dynamics of these changes [10]. Interestingly, when combining data from five studies on healthy aging, the plasma level of the two CEs detected here, CE(20:4) and CE(22:5), was significantly different in individuals with ApoE ε2/ε2 genotype compared with those with ε3/ε3 genotype. There were no reliable results concerning the ApoE ε4/ε4 genotype due to the study’s design, which prioritized maximizing the number of ε2 carriers while minimizing the number of ε4 carriers [11].
Our results also suggest that CE(22:5) may be influenced by sex in individuals with the ApoE ε3/ε3 genotype, indicating a potential interaction between lipid metabolism and biological differences. However, as this effect was not observed in all subgroups, further analyses in larger cohorts are needed to clarify its significance or lack thereof.
The small number of individuals with the ApoE ε2/ε2 and ApoE ε4/ε4 genotypes, restricted our ability to perform detailed subgroup analyses. Additionally, the lack of absolute metabolite concentrations prevents direct comparisons of CE levels in absolute terms. However, the values in Table S1 remain comparable, as they were derived using mass spectrometry with an area-under-the-curve approach and appropriately normalized. Therefore, our conclusions regarding differences—or the absence thereof—in CE levels based on disease status and ApoE genotype remain robust.
This study highlights the value of re-analyzing existing metabolomics datasets to uncover novel insights, particularly when genotype-specific associations may be masked in mixed-population analyses. Although we were unable to directly analyze ε4/ε4 patients due to the limited sample size (n = 4), it is reasonable to predict that CE(20:4) and CE(22:5) concentrations would also be elevated in this high-risk group. This expectation aligns with the well-documented inefficiency of ApoE ε4 in lipid clearance and cholesterol homeostasis [12]. The potential elevation of CE(20:4) and CE(22:5) in ε4/ε4 individuals highlights the importance of targeted studies in this high-risk group to validate these predictions and explore therapeutic interventions aimed at modulating lipid metabolism. Combining CE(20:4) and CE(22:5) plasma concentrations with other metabolic or clinical parameters could enhance our understanding of AD-related lipid dysregulation [13]. Larger cohort studies, including those with ε4/ε4 individuals, are necessary to validate these results and explore their broader implications.
The observed increase in the median level of two CEs aligns with the hypothesis that systemic lipid dysregulation contributes to AD pathophysiology [14]. CEs play crucial roles in lipid transport and storage, and their profiles are shaped by the lipid-handling efficiency of ApoE isoforms [15]. The ApoE ε4 allele, associated with impaired lipid metabolism and increased AD risk [16], likely drives the increased CE(20:4) and CE(22:5) levels in ε3/ε4 individuals. These findings underscore the need for genotype-stratified analyses to reveal metabolic changes that may be obscured in mixed-genotype populations [17]. It should be noted that the two CEs detected here have in common an acyl with a large number of carbon atoms, 20 and 22, and that the acyl is highly unsaturated, 4 and 5 double bonds for, respectively, CE(20:4) and CE(22:5).
Despite these insights, this study has several limitations that must be acknowledged. First, we relied on publicly available data, which, while valuable, lacks an independent validation cohort. The absence of a secondary dataset limits the generalizability of our findings, underscoring the need for replication in larger, well-characterized population cohorts. Furthermore, while plasma metabolomics provides a systemic view of metabolic alterations, it does not directly reflect changes occurring in the brain. Given the critical role of lipid metabolism in neurodegenerative diseases, further studies should examine CE levels in cerebrospinal fluid or brain tissue to determine whether similar alterations are present at the central level. Additionally, the lack of detailed neuropathological data, such as brain tissue analysis or Braak staging, limited our ability to fully investigate the relationship between CE levels and disease progression.
In conclusion, the elevated median levels of CE(20:4) and CE(22:5) in ε3/ε4 AD patients highlight the role of lipid dysregulation in the disease but do not serve as reliable biomarkers for distinguishing AD patients from controls. The clinical significance of this finding lies in its potential to drive further investigations into the role of CEs in AD. A deeper understanding of these metabolic alterations could provide new insights into disease mechanisms and inform strategies for modulating lipid metabolism in genetically predisposed populations.
AD: Alzheimer’s disease
Aβ: amyloid-beta
CEs: cholesteryl esters
The supplementary table for this article is available at: https://www.explorationpub.com/uploads/Article/file/100497_sup_1.xlsx.
Special thanks to all the participants that included professors and students of the University of Barcelona and of the EÒLIA Centre Superior d’Art Dramàtic. We would like to thank the CCiTUB (Scientific and Technological Centers of the UB) of the Universitat de Barcelona (Barcelona, Spain), for the expert and technical help using the LC-MS/MS equipment.
ES: Data curation, Formal analysis, Investigation, Visualization, Writing—original draft. JSM: Data curation, Formal analysis, Investigation, Writing—original draft. AI: Validation, Writing—original draft. MGF: Validation, Methodology, Visualization, Writing—original draft. JSN and HAA: Conceptualization, Writing—original draft. DBC: Validation, Conceptualization, Supervision, Writing—original draft. RF: Conceptualization, Supervision, Writing—original draft.
Rafael Franco, who is the Editor-in-Chief of Exploration of Neuroprotective Therapy, was not involved in the decision-making or the review process of this manuscript. The other authors declare no conflict of interest.
This study did not involve new human or animal experiments. According to the regulations of the institution and regional government guidelines, the use de-identified data, which are already reported and readily available, does not require specific approval by an Ethics Committee.
Not applicable.
Not applicable.
The data used in this study from the Kalecký et al. (2022) study, under a Creative Commons Attribution Non-Commercial (CC BY-NC 4.0) License, is provided in supplementary Table S1. The remaining supporting data of this study are available from the corresponding author upon reasonable request.
Not applicable.
© The Author(s) 2025.
Open Exploration maintains a neutral stance on jurisdictional claims in published institutional affiliations and maps. All opinions expressed in this article are the personal views of the author(s) and do not represent the stance of the editorial team or the publisher.
Copyright: © The Author(s) 2025. This is an Open Access article licensed under a Creative Commons Attribution 4.0 International License (https://creativecommons.org/licenses/by/4.0/), which permits unrestricted use, sharing, adaptation, distribution and reproduction in any medium or format, for any purpose, even commercially, as long as you give appropriate credit to the original author(s) and the source, provide a link to the Creative Commons license, and indicate if changes were made.