
Abstract
Aim:
Growing evidence suggests that Attention Deficit Hyperactivity Disorder (ADHD) may not be a single entity with a universal remedy, but rather a group of conditions resulting from interactive bio-psycho-social factors and requiring specifically targeted interventions. ADHD research, including neurophysiology, faces inconsistent findings due to heterogeneity. This variety might indicate different physiopathogenic mechanisms. This study aimed to identify dysfunctional mechanisms behind ADHD symptoms and test if targeting these dysfunctions can improve clinical outcomes.
Methods:
230 children with ADHD diagnosis studied with hypothesis-related variables from electroencephalogram (EEG) visual inspection and quantitative z-scored power, coherence and ratios, and from event-related brain potentials (ERPs) z-sored P50, N100, N200, P300 latencies amplitudes and ratios. Parametric and non-parametric classifications were conducted on neurophysiological findings to identify clusters and design neuropsychologically-based recommended treatments (NBRTx). Treatment response evaluated thrgbrough ADHD scores comparing NBRTx with guidelines recommended treatment (GBRTx). Treatment selected by agreement between each child’s physician and the parents, both parties thoroughly informed.
Results:
Six clusters of neurophysiological findings were identified, each characterized by a combination of EEG/ERP abnormalities hypothetically related to distinct dysfunctional mechanisms. Cluster (C) findings, hypothetical dysfunction, and treatment recommendations: C1: Longer P300 latencies, hypodopaminergia: methylphenidate. C2: Centrotemporal spiles, hyperexcitable network: carbamazepine. C3: Bisynchronous spike-waves complexes, thalamocortical involvement: valproic. C4: Altered psychosis-related variables: risperidone. C5: Altered migraine-related variables: valproic. C6: Abnormal maturational interhemispheric rate: tailored psychotherapy. At 3 months, ADHD scores decreased with methylphenidate (MPH) only in C1. In other clusters children under NBRTx had good responses, those under GBRTx did not, and were switched to NBRTx with significant improvement at 6 months.
Conclusions:
Six different neurophysiological mechanisms responding to targeted interventions were identified by neurophysiological signatures. A personalized medicine approach guided by physiopathogenic mechanisms may be necessary when facing multifactorial, heterogeneous disorders such as ADHD.
Keywords
ADHD treatment, biological heterogeneity, physiopathogenia, neurophysiology, IED, electrical brain networks, centrotemporal spikes, multivriateIntroduction
Current classification systems like the Diagnostic and Statistical Manual of Mental Disorders 5 (DSM-5) [1] conceptualize Attention Deficit Hyperactivity Disorder (ADHD) as a single nosological entity with three presentations: inattentive, hyperactive/impulsive, and combined (ADHDc), and inattention, hyperactivity, and impulsivity as the core symptoms.
Advocates of a single disorder argue for shared symptoms and similar long-term outcomes, assuming a common underlying mechanism with psychostimulants as first-line treatment [2]. The practical advantage of a unifying diagnosis is that it eases communication among clinicians and simplifies therapeutic decisions with “good-for-all” treatment guidelines. Regardless of how appealing the concept may be, each one of the arguments is being challenged by a growing body of evidence on the remarkable heterogeneity across domains [3–5].
Heterogeneity stands out as the most often alleged cause of small effect sizes and controversial findings throughout the ADHD literature [3–6]. It may also explain why many ADHD-related questions are still unanswered despite abundant high-quality research. This section focuses on topics relevant to the study’s hypotheses and methodologies, emphasizing data from the past five years. Nevertheless, earlier models and techniques will be included if they pertain to open questions or conflicting matters.
Clinically, the disorder does not appear as just three types. Careful exploration of symptoms brings out complex multilayered displays. Yet, clinical impressions have a subjective part and even if aided by diagnostic scales, may be tainted by social and cultural biases [7, 8].
Neuropsychology provides more objective, and still clinical, evidence of different mechanisms underlying ADHD symptoms. In 2008, Sonuga-Barke et al. [9] proposed a dual pathway model for ADHD, involving executive and reward-seeking pathways. Time-distortion and arousal dysregulation interacting with the executive pathway were added to create a Multiple Pathway model [10–12]. The heuristic value of these models transcended the clinical domain and became the brain’s roadmap for neurosciences before the advent of graph analysis. But even if abnormalities along those pathways are typical in subjects with ADHD, they are not hallmark since alterations in the same pathways have been found in other disorders [13].
A similar scenario is emerging from the neurobiological domain, where no single abnormality has been found in all patients with ADHD while absent in subjects without ADHD symptoms [2, 13].
ADHD-like symptoms in survivors of the “encephalitis lethargica” hatched the idea that similar symptoms in other children could also have a biological cause. In the 1950s, the involvement of dopamine (DA) was suspected after Carlsson identified the molecule as a neurotransmitter and DA-receptors as amphetamine targets. Benzedrine, a molecule from the amphetamine group, was already known to correct behavioral and attentional problems in about half of the affected children treated by Bradley [6].
In 1991, Florence Levy [14] formalized the hypothesis of a DA deficit as the main cause of ADHD, after reviewing studies on amphetamine’s effects on children’s behavior, animal reinforcement, motor behavior, and on the circuits between the prefrontal cortex and striatum. Since then, various groups have studied DA function in ADHD, gathering substantial data and creating different versions of the DA hypothesis.
MacDonald et al. [15] reviewed the accumulated evidence on animal models and human studies, including comparison with other conditions characterized by DA deficit, such as Parkinson disease. They conclude that there is enough evidence to support DA involvement in ADHD, it does not substantiate global or localized hypofunction as the causal mechanism. DA dysregulation is also present in other neurodevelopmental or neurodegenerative disorders [16–18]. Selective DA alterations are only present in a subset of patients. In most cases the type of DA compromise is complex, involving different receptor types, transporters, metabolic chains, and the interaction with other neurotransmitters [19]. There is also evidence that in some ADHD cases DA system is spared [20], and other neurotransmitters directly affect the ADHD-related pathways [21, 22].
A primary role of the prefrontal association cortex in ADHD was postulated in 2009 by Arnsten [23] based on converging biochemical, anatomofunctional and genetic evidence from studies designed after the dual pathway and the Multiple Pathways models [9, 11]. The concept was revoked in 2012 by Cortese et al. [13] after a meta-analysis of 55 studies showing the implication of networks involving regions from parietal, temporal, sensorimotor cortices, basal ganglia, and cerebellum. In addition, these authors emphasized the high heterogeneity in the findings as well as other neuropsychiatric disorders with abnormalities in the same networks.
In 2017, Stevens et al. [24] investigated the function of meso-cortical and mesolimbic dopaminergic neural systems, correlates of the dual pathway model [9] in patients with ADHD during the Go-no-Go and the Monetary Incentive Delay paradigms. over regions of the executive and the reward/avoidance network (RWN), and in other regions as well. They found a variety of activation-deactivation patterns over the executive and the RWN and other unexpected regions. Because of this variety despite remarkably similar symptomatologies, the authors concluded that ADHD was more likely a collection of discrete disorders for which a similar behavioral endpoint arises through different neurobiological pathways. Similar regions and varied results were found in a recent study with a large repository sample and a local control sample [25].
Early studies focusing on specific genes were interpreted as highly supportive of the DA hypothesis of ADHD [26]. Later on, genome-wide association studies have shown that DA-genes explain only a small portion of the overall genetic risk for ADHD, except in a subset of subjects [27]. In addition, the polygenic risk scores of ADHD were linked to various behavioral traits such as risk-taking and addictive behaviors but are not specifically or predominantly linked to ADHD [28]. Higher ADHD-risk has been found for several non-DA related genes. In other words, genetic studies also suggest subgroups of patients with the same diagnosis and different genetic signatures. Also, the same genetic signature can be linked to different clinical presentations, suggesting the interactive participation of more factors, such as environmental influences.
The electroencephalogram (EEG) was the first technological tool used to search for brain dysfunctions in patients with mental disorders. In 1938, Jasper et al. [29] reported excess of theta waves in the frontocentral regions of children described as impulsive, hyperactive, and highly variable, most likely suffering from ADHD.
After him, several authors reported an increase in theta waves in children with similar symptoms. In 2001, Monastra et al. [30] proposed the theta-beta ratio (TBR) as a metric to differentiate children with and without ADHD. Results were consistent enough that the Food and Drug Administration (FDA) accepted the TBR as a biomarker [31]. Attempts to resolve conflicting results by homogenizing recording and analyzing techniques were unsuccessful [32]. After reviewing the evidence, Slater et al. [33] concludes that the EEG does not have diagnostic value, but it has potential to identify subgroups through event related components such as the N200 and P300.
The P300 is an event-related-potential event-related brain potential (ERP) recorded over the head surface as a positive voltage change at approximately 300 milliseconds after an unpredictable change breaking a regular sequence of identical stimuli. It was introduced by Onofrj et al. in 1991 [34]. Since then, psychophysiological paradigms have been added to study the steps and interactions intervening in complex functions as attention, in healthy subjects and neuropsychiatric disorders [35]. In 1993, Taylor et al. [36] reported increased P300 latencies in children with ADHD that normalized with methylphenidate (MPH). Recent studies have replicated the increased latency [37, 38] and response to MPH [39]. In a meta-analysis Kaiser et al. [40] conclude that ADHD is associated with longer P300 latencies and smaller amplitudes, but he emphasizes the moderate group differences due to individual differences, including patients with normal ERPs.
A P300 amplitude decrease has been consistently found in schizophrenia spectrum disorders and first-degree relatives [41], and less consistently with other types of psychoses, as well as in developmental disorders.
The P50 is an early ERP used to measure sensory gating, or the brain’s ability to suppress redundant information. Decreased sensory gating leads to an overload that compromises several higher order processes. It has been related to developmental disorders, including ADHD, but also to the schizophrenia spectrum disorders [42].
In 1937, a whole new era for epileptology started after the demonstration of the 3 per second spike/wave discharge as the electrical signature of absence seizures [43]. While the typical absence is a brief (10–20 seconds) loss of awareness and responsiveness, other types, described since the 1970s [44–48] may selectively affect some higher order processes while sparing others, have longer durations and are more prone to enter status. They can also be more easily unrecognized or misdiagnosed as ADHD.
Distinct spatiotemporal patterns of rhythmic sharp transients characterize different seizure types [49]. An isolated discharge with no apparent clinical correlate but having similar morphology to those during a seizure is called interictal epileptiform discharge (IED) and is considered a marker of potentially epileptogenic tissue [50]. Recent evidence suggests a continuum between interictal and ictal discharge, since even single discharges affect the network connectivity with variable degrees of clinical manifestation [51, 52]. In addition, there is also evidence IEDs causing long-lasting changes in networks’ architecture and damage to the tissular net. IEDs are no longer considered irrelevant findings but a problem by itself that can compromise the subjects’ performance and even endanger the brain in the long-term [53–56].
However, since 1950 it was known that IEDs can also be seen in the EEGs of children with ADHD-like symptoms even if they have never had seizures [57]. The possibility that IEDs could generate ADHD symptoms had little support until Binnie’s demonstration [58] in 1993, of behavior and cognitive abilities improvement when antiseizure medication reduced IEDs, independently of its effect on seizures. He suggested that IEDs caused a “transient cognitive impairment”.
These early findings had already prompted many inquiries into prevalence, clinical significance, and neurophysiological mechanisms of IEDs. Although reports varied in rates and methodologies, a consistent but generally ignored finding was that presence of IEDs entailed poor performance and cognitive impairment [59–61], until recently [62–68].
The strong, bidirectional relationship between ADHD and epilepsy is well known, its nature and mechanisms are not [69]. Coincidental and causal hypotheses have been postulated but are difficult to test even in animal models. Common genetic factors that affect neurotransmitter balance may point to the coincidental explanation, since those precede the clinical manifestations.
However, there is also the above cited evidence on the negative impact of IEDs upon the function of affected regions, which may manifest as anything from primary sensations to complex behaviors, affect and cognition. So, a causal relationship is also possible. Probably, as with all complex phenomena, the ultimate cause would be a variable combination of inherently shared and dynamically acquired common factors.
In 2005, Halász et al. [70] introduced the perisylvian epileptic model (PEM), which unifies idiopathic focal childhood epilepsies as a continuum along the axes of cognitive/behavioral deficits and epileptic propensity. The centrotemporal spike is the common phenotype across this spectrum that goes from the severe encephalopathic forms to the most benign self-limited epilepsies and further extends to include ADHD (or a subgroup) at the more benign extreme.
In a recent version of the model, he includes network’s functional connectivity, balance of inhibitory and excitatory components, genetic influences, and sleep perturbation by the discharges to explain the cognitive disturbances caused by, and lasting beyond, the electrical discharge [71].
Comorbidity with migraine is also high. Symptoms of ADHD have been reported more often and preceding the diagnosis of migraine [72–74] in children and adults, as well as in children with a family history of migraine [75]. Cognitive performance is affected during headache attack intervals [76].
Recently there has been an increased interest in the long time neglected cognitive and attentional impairments in patients with migraine [77]. The interest was partially fostered by genetic studies showing migraine association with psychiatric disorders, particularly ADHD. Anomalies in the attentional networks have been a common finding in functional magnetic resonance imaging (fMRI) and EEG studies in adults with migraine [78].
Patients with psychosis often have concurrent ADHD symptoms [79], the history of a preceding ADHD diagnosis is more frequent in patients with psychoses than in the general population. Children with ADHD are more likely to have experiences of derealization and are also more prone to psychotic brakes in youth [80]. Genetic variants of ADHD have an increased risk of psychotic experiences, odds ratio of 1.87 [81]. These associations had also been neglected, despite the phenomenological similarity of some symptoms and the evidence from fMRI studies of alterations in the same regions and pathways.
Asymmetry of a multivariate quantitative electroencephalogram (QEEG) maturational index in children with ADHD was reported in 1999 by our group [82]. These children differed from a larger sample of children with ADHD because the EEG, QEEG, and ERP measures were normal. Behavioral and ADHD scores correlated with the extent of the asymmetry, even in those children whose maturational indexes from both hemispheres were above the expected for chronological age. Functional asymmetries have been reported with fMRI [83, 84] and QEEG [85, 86] in larger samples of children and adults with ADHD.
The questions driving this work emerged from the above literature and years looking at the kaleidoscope of EEG and ERP findings in children with ADHD as a single diagnosis. Some of those patterns resembled what is often seen in other disorders. What if they shared a similar underlying dysfunction without the full-blown manifestations? Could it be that in some cases the ADHD symptoms are a manifestation of another, latent disorder. Perhaps a disorder for which we already have effective treatments? If so, would the ADHD symptoms respond to the specific treatment for the “other” latent disorder?
Strong multidisciplinary evidence supports that ADHD symptoms can result from several distinct dysfunctional mechanisms. Does that mean ADHD is more than one disorder? If each mechanism responds better to a specific treatment, then yes. Is not finding specific treatments the main reason for classifying disorders?
The evidence also points to at least six different physiopathogenic mechanisms that can manifest as ADHD symptoms: 1) DA dysregulation, 2) Epileptiform discharges affecting attention and executive networks (EXNs), 3) Epileptiform discharges causing partial arrest of cognitive functions, 4) Neurotransmitter dysregulation disrupting allocation of attentional resources (psychosis-like), 5) Vascular and metabolic changes interfering with attention networks (migraine-like), 6) Maturational asymmetry.
Working hypotheses for this study:
ADHD symptoms can rise from different physiopathogenic mechanisms.
Neurophysiological techniques can identify different physiopathogenic mechanisms.
Treatment response can be optimized by targeting physiopathogenic mechanisms.
Materials and methods
Study type and protocol
The study is person-centered, observational, longitudinal with three evaluation points.
Subjects, study conditions and stages
The first stage recruited all children referred for evaluation to the Clinical Neurophysiology Department, Hospital Español de México for two years. The study included 95 never-medicated children and 135 who have been or were under psychostimulant treatment until one week before the evaluation, demographics in Table 1. The EEG/ERP study was indicated because of insufficient response to psychostimulants in 83 children, or a good response on attention with exacerbation of behavioral problems in 52. Among never-medicated children, 37 were siblings of poor responders, 47 because of the severity of behavioral or academical problems, without a learning disability.
Demographic characteristics and neuropsychological scores
| ADHD presentation | n | AgeMean (SD) | SexM/F | Pre-treated | IQMean (SD) | ADHD totalMean (SD) | InattentionMean (SD) | HyperactivityMean (SD) |
|---|---|---|---|---|---|---|---|---|
| Combined | 125 | 10.4 (3.9) | 67/58 | 62 | 98.8 (6.7) | 14.3 (3.0) | 7.3 (1.7) | 8.3 (1.5) |
| Inattentive | 67 | 11.1 (3.8) | 39/28 | 35 | 95.3 (6.4) | 13.2 (4.0) | 3.4 (1.8) | 4.7 (1.9) |
| Hyperactive | 38 | 11.0 (4.0) | 24/14 | 38 | 97.7 (7.3) | 11.6 (2.9) | 6.8 (1.7) | 8.6 (1.3) |
| Total | 230 | 10.7 (3.9) | 130/100 | 135 | 97.9 (6.0) | 13.3 (3.2) | 7.2 (2.1) | 6.2 (2.5) |
In the first column, DSM-5 presentation, followed by columns with number of children, mean age and standard deviation, male to female ratio, followed by the number of children who had been under psychostimulant medication. In the sixth to ninth columns, mean and standard deviation of intelligence quotient (IQ), followed by the mean and standard deviation of the recoded attention total scores 1 to 20 total, cut-off = 7. IQ measured by Wechsler Intelligence Scale for Children (WISC) and WAIS: Wechsler Adult Intelligence Scale, ADHD scores recorded from original scores, details in Materials and methods. ADHD: Attention Deficit Hyperactivity Disorder; DSM-5: Diagnostic and Statistical Manual of Mental Disorders 5
Inclusion criteria:
DSM-5 diagnosis of ADHD, any presentation.
Intelligence quotient (IQ) ≥ 80.
ADHD scores ≥ 6 out of 20 (recoded from the original evaluation tool).
Signed parental consent, fully informed, including the nature of the study and the possibility of using either a first-line or an off-label medication depending on the neurophysiological findings.
Exclusion criteria:
Another DSM-5 Axis One disorder, except oppositional defiant disorder, if present.
Any medical condition, including repeated episodes of headache or abdominal pain.
Personal history of neurological disorders, perinatal event, and head trauma.
Personal or family history of seizures, including febrile seizures or single seizure with or without identifiable cause.
Use of psychotropic medication on the evaluation day or during the previous week.
Intelligence quotient (IQ) < 80.
Psychometric evaluation for IQ and ADHD symptoms were obtained while unmedicated for the first evaluation, under the physician’s selected treatment for the 3- and 6-month follow-ups. IQ was evaluated with the WISC [87], the WAIS [88] for those above 16 years. ADHD scores were obtained from the Conners’ Rating Scale-Revised (CRS/R) [89] with combined maximum of 230 and cut-off at 70, the Vanderbilt ADHD Diagnostic Parent Rating Scale (VADPRS) [90] with maximum at 62, cut-of at 20, or the Child Behavior Checklist-Attention Problem Scale (CBCL-AP) [91], maximum 226, cut-off at 78.
The psychometric evaluations were performed by licensed psychologists from the referral’s staff, who also selected the evaluation instrument. The three scales are transculturally validated, frequently used in research and clinical practice, showing high diagnostic accuracy in a recent meta-analysis [92].
Neurophysiological recordings
EEGs recorded according to the International Federation of Clinical Neurophysiology (IFCN) [93, 94] from 21 monopolar electrodes, international 10/20 system, linked-ears reference, electroculogram (EOG), and electromyography control electrodes, impedance below 10 kΩ, NeuroScan Synamps apparatus, sampled at 250 Hz, 0.5 Hz resolution, 0.1 Hz passband, 60–70 Hz notch, crosstalk < 1%. Special care taken to assure an eyes-closed, awake, and relaxed behavioral state for at least 20 minutes, followed by 3 minutes hyperventilation, photic stimulation at increasing frequencies from 4 to 20 Hz to evaluate the driving response [95]; auditory ERP [34, 96] and visual [97] ERPs applied during the first 5 and last 5 minutes of the recording session, total recording duration 75 minutes.
Auditory gating, dual-click protocol [98]: 50 click pairs, 90 dB clicks, 500 ms intra-pair, 80–100 inter-pair intervals. Visual gating, dual-flash protocol [97]: 90 pairs of low complexity visual stimuli (20 ms flash).
Auditory P300: The auditory oddball paradigm was used to obtain the N100, N200 and P300 responses after a randomly occurring change in the stimulus characteristics (rare) within a regular stimuli sequence (standard).
EEG visual interpretation, quantitative EEG and ERP analysis
Neurophysiological data was independently interpreted by two board certified neurophysiologists with either psychiatry or neurology background, records identified by numbers to assure a blind interpretation, following the IFCN guidelines [94].
EEG visual inspection
The background normalcy was assessed by organization and reactivity of background rhythms according to age [97, 99] and the presence of transients [99, 100]. If present, location, morphology, and spatiotemporal evolution were listed, focusing on features suggesting epileptic neuronal behavior, later adopted as criteria by the IFCN [100].
QEEG analysis according to IFCN guidelines [94] was computed from 48 2.5 second EEG epochs collected after carefully discarding artifacts and transients, maintaining the sample reliability above 95% (ratio of variance between the even and odd seconds of the time series), resampled to 100 Hz and averaged before further analysis with NeuroGuide Software [101] to obtain the z-transformed absolute power for each 1 Hz band at each electrode site, then combined into each of the 4 conventional bands [94], a z-scored fast beta power (26–29 Hz sub-band, regional) (zFBP), and the z-scored theta-beta ratio (zTBR) at each electrode site. Focal wideband power increase (zFWBP) obtained from the ratio of z-scored power of each electrode to the whole-head z-scored power, the highest ratio of each subject for further analysis. Early QEEG studies showed that a significant regional increase in zFWBP could detect regions of hyperexcitability even if the IEDs are not visible at visual inspection [102]. Sensitivity and specificity of this finding are unknown, but the validity of its basic principles has been recently confirmed with combined intracranial and surface recordings [103, 104]. A z-scored multivariate maturation index [105] was calculated for each hemisphere and the left to right ratio was entered into the analysis [z-scored maturational asymmetry (zMA)].
ERP analysis
Auditory P50 [98] and visual P100 [97] epochs collected from 50 ms before stimulus presentation to 150 ms after, independently averaged for the 1st and 2nd stimuli of each modality, amplitude measured at the time of maximal amplitude in Pz the positive peak (50 ms auditory, 100 ms visual), and the ratio calculated between averaged amplitudes of the 1st and 2nd stimuli, z-transformed with local normatives (zP50r).
P300 analysis [34]: Epochs collected from 50 ms before to 750 ms after stimulus presentation, independently averaging the responses to the standard and the rare stimuli and subtracting the averages. Amplitude and latencies measured from the stimulus presentation to the maximal amplitude in Fz for the N100 and N200 waves, and at Pz for the P300. After log transformation, z-scores were calculated against the laboratory database to generate the zN100l, zN200a, zP300a, and zP300l for the statistical analysis.
Overall degree of neurophysiological abnormality
The abnormality level of the neurophysiological study was scored with six levels numerically coded for the statistical analysis: 0.—normal; 1.—only background, zTBR, or P300 abnormalities; 2.—only IEDs; 3.—abnormal background and either P300 abnormalities, few IEDs or several small sharp transients (SSTs); 4.—frequent IEDs and P300 abnormalities; 5.—abnormal background, frequent IEDs, and P300 abnormalities.
Multivariate statistical analysis
Variable selection
The first step in data reduction was hypothesis related, a flowchart of the analysis in Figure 1. From the large amount of available EEG and ERP variables, the first selected were those which the relation with ADHD has attracted more research attention, even if the evidence is not conclusive due to heterogeneity. Variables related to three conditions highly comorbid with ADHD, epilepsy, migraine, and psychosis were also included, as also maturational asymmetry, a total of 17 variables. Table 2 shows the hypothesis and related variables (only those kept after PCA).
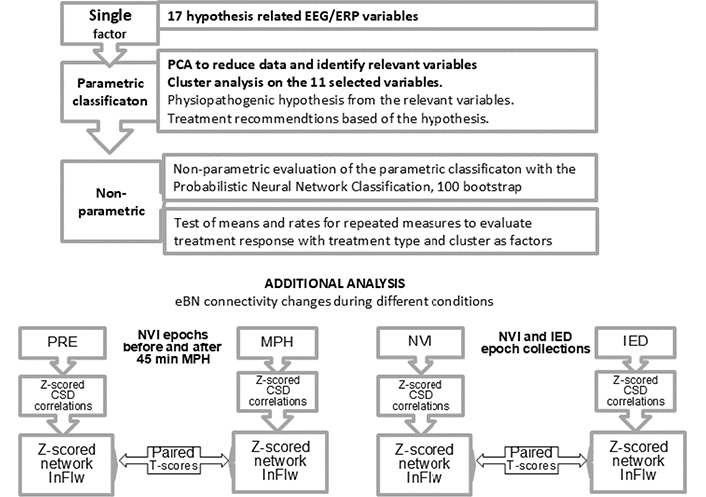
Flow chart of statistical analysis. The main analyses (upper chart) in relation to the study purpose, investigating if the hypothesis-related EEG/ERP variables could identify clusters in our sample, if the clusters corresponded to hypothetical physiopathogenic mechanisms, and lastly, if the NBRTx for each cluster performed better than the GBRTx. Each of the 17 z-transformed variables entered Principal Component Analysis (PCA) from which eleven independent variables were extracted and to enter a cluster analysis. The variables contributing most to each cluster’s membership turned out to be in accordance with the neurophysiological dysfunction hypotheses. A non-parametric classification was then performed on the data to corroborate the validity of the parametric classification. Treatment response after three and six months was also tested non-parametrically with the Ward repeated measures method. The additional analyses (lower charts) were aired t-scores to check for differences in the z-scored network information flow (zInFlw) within specific electrical brain networks (eBNs) between two conditions. On the left, within the dorsal attention network before and 45 minutes after an oral dose of methylphenidate (MPH) in all children with increased P300 latency at start. On the right, the same test conducted on the zInFlw of affected networks between normal at visual inspection (NVI) and epochs containing interictal epileptiform discharges (IED)
Variable selection by hypothesized physiopathogenic mechanisms
| Physiopathogenic hypothesis | References | Hypothesis related variables | PCA selected | Higher weight | For cluster |
|---|---|---|---|---|---|
| DA hypoactivity in DLPC | [31, 32][35–42][96, 98] | TBR, zP300l, zP300azN200l, zN200azP50r, P100r | zP300l, zP300azN200a, zP50r | P300l | 1 |
| Perisylvian network hyperexcitability | [55, 66–71, 102] | zWBP, CTS | zWBP, CTS | zWBP, CTS | 2 |
| Excite-inhibit imbalance, thalamocortical | [48, 102] | zTBR, BSSW | BSSW | BSSW | 3 |
| Misallocation of attentional resources | [35, 41] | zP300l, zP300a, zN200l, zN200a, zP50r, P100r, zFBP | zP300l, zP300a, zN200a, zP50r, zFBP | zP300a, zP50r, zFBPP | 4 |
| Vascular-metabolic decoupling, Cx hyperexcitability | [95, 98] | zDP, zFBP, HR, SST | zFBP, HR, SST | zFBP, HR, SST | 5 |
| Poor interhemispheric collaboration | [82, 105] | zMA | zMA | zMA | 6 |
On the first and second column, physiopathogenic hypothesis and bibliographic references, followed by the EEG/ERP variables associated with other disorders and supporting references (after PCA selection); fourth column, variables statistically selected as independent contributors to the variance; in the fifth, variables with highest loads to a specific cluster; and the cluster number in the last column. DA: dopamine; PFC: prefrontal cortex; ThCx: thalamocortical; TBR: theta-beta ratio; zP300l: z-scored auditory P300 latency; zP300a: z-scored auditory P300 amplitude; zP50r: z-scored auditory P50 ratio; zWBP: z-scored Wide-Band Power (focal); zFBP: z-scored fast beta power (26–29 Hz sub-band, regional); zHR: z-scored 20 Hz power during 20 Hz photic stimulation; CTS: centrotemporal spikes; SST: small sharp transients; BSSW: bisynchronous spike waves; zMA: z-scored maturational asymmetry; PCA: Principal Component Analysis
Principal Component Analysis (PCA) was used for further reduction using the Statgraphics software package [106]. Variables with shared variance were extracted until only eleven independent variables were left (Bartlett’ test of sphericity, chi-square = 621.15, DF = 45, p < 0.001). Six principal components were obtained with eigen values above 1, explaining 83.98% of the variance, KMO = 0.86 (Keiser-Meyer-Olkin).
Clustering was performed with the Ward’s Method, six expected clusters from the six PCA components with eigenvalues > 1. The weights of the variables for cluster membership were derived from the explained variance. Table 3 presents the clusters and the contribution of each variable to the cluster’s definition—highest contributors highlighted.
Cluster analysis (Ward’s Method), centroids, and variables’ weights
| Cluster (C) | n | zP300l | zP300a | zP50r | zDp | zFBP | zWBP | zHR | CTS | SST | BSSW | zMA |
|---|---|---|---|---|---|---|---|---|---|---|---|---|
| 1 | 70 | 2.85 | 0.01 | 0.01 | 0.13 | 0.05 | 0.12 | 0.10 | 1.14 | 0.00 | 0.00 | –0.16 |
| 2 | 58 | 0.19 | –0.25 | 0.05 | –0.09 | 0.21 | 2.39 | 0.12 | 3.29 | 1.02 | 0.00 | –0.07 |
| 3 | 25 | 0.14 | 0.18 | 0.08 | 0.01 | 0.13 | 0.29 | 0.20 | 1.25 | 0.04 | 2.63 | –0.07 |
| 4 | 17 | 0.63 | –2.72 | –2.29 | –0.22 | 2.09 | 0.00 | 0.23 | 0.00 | 0.00 | 0.00 | 0.19 |
| 5 | 38 | 0.87 | –0.28 | 0.73 | –2.87 | 2.87 | 2.01 | 3.76 | 0.53 | 2.19 | 0.00 | –0.09 |
| 6 | 22 | 1.25 | –0.01 | 0.00 | 0.1 | –0.08 | 0.16 | 0.00 | 0.19 | 0.00 | 0.00 | 3.31 |
In the first and second columns, the six clusters (expected from the six PCA components with eigenvalues > 1) and the number of children in each cluster. The following columns show the calculated weights of each of the 11 variables from the explained variance in the cluster. The highest values (in bold) indicate the most significant variables defining the cluster. C1: z-scored P300 latency (zP300l); C2: centrotemporal spikes (CTS) and z-scored focal wideband power (zFWBP); C3: bisynchronous spike-wave (BSSW) complexes; C4: z-scored auditory P300 amplitude (zP300a), z-scored auditory P50 ratio (zP50r); and z-scored fast beta power (26–29 Hz sub-band, regional) (zFBP); C5: z-scored delta power [zDP, zFBP, zFWBP, and small sharp transients (SST)]; C6: z-scored maturational asymmetry (zMA). CTS, SST, and BSSW coded by quantity on each record
Cluster analysis was significant overall, despite slight overlapping, steep changes in the agglomeration plot and possible outliers. Therapeutic recommendations were derived from the dysfunctional mechanisms suggested by the most contributing variables, Table 4.
Cluster-related physiopathogenic hypothesis as standing points for treatment recommendations
| Cluster (C) | Physiopathogenic hypothesis | Similar EEG/ERP findings | Recommended treatment |
|---|---|---|---|
| 1 | DA hypoactivity in DLPC | Neurodegenerative and developmental disorders | MPH |
| 2 | Perisylvian network hyperexcitability | Spectrum of perisylvian network epilepsies | CBZ |
| 3 | Excite-inhibit imbalance, thalamocortical | Atypical, phantom absences | VAL |
| 4 | Misallocation of attentional resources | Schizophrenia spectrum, other psychoses | RSP |
| 5 | Vascular-metabolic decoupling | Migraine | VAL, TPM |
| 6 | Cortical hyperexcitability | Other mental disorders | Directed psychotherapy |
First two columns, cluster number and most loaded variables for cluster’s membership (from Table 2). Third column a brief description of the physiopathogenic hypothesis related to the cluster and supporting references. Fourth and fifth columns, other disorders with similar EEG/ERP findings. Last column, recommended treatment for each cluster, based on practice guidelines for the disorders hypothetically sharing some physiopathogenic mechanisms. DA: dopamine; EEG/ERP: electroencephalogram/event-related brain potential; MPH: methylphenidate; CBZ: carbamazepine; VAL: valproic acid; RSP: risperidone; TPM: topiramate
Because of these pitfalls, and the uneven cluster sizes we double-checked the cluster’s validity through the non-parametric probabilistic Bayesian neural network classification (PBNNC) with 100 bootstrap repetitions to obtain classification accuracy, stability and confidence intervals [107, 108], correct classification was 89.6% in the training and 87.9% for the validation samples (Table 5), bootstrap [109] correct classification by clusters went from 59.50% in C6 to 98.91% in C1 (Table 6). Subjects were classified in 6 groups; classification rates and contributions of variables were similar to those in the cluster analysis.
Neural network Bayesian classifier, training, and validation statistics
| Cluster (C) | Training set | Validation set | ||
|---|---|---|---|---|
| Members | Correct classification (%) | Members | Correct classification (%) | |
| 1 | 37 | 91.89 | 35 | 90.05 |
| 2 | 24 | 91.67 | 32 | 93.75 |
| 3 | 16 | 81.25 | 11 | 81.82 |
| 4 | 8 | 50.00 | 13 | 69.23 |
| 5 | 19 | 100.00 | 14 | 100.00 |
| 6 | 11 | 100.00 | 10 | 97.00 |
| Total | 115 | 89.56 | 115 | 87.94 |
A total correct classification of 89.6% was obtained during the training of the probabilistic neural network classifier (PNNC) with 115 subjects selected by random split of the total sample and 87.9% during validation with the remaining 115 subjects. Input factors: z-scored P300 latency (P300l), P300 amplitude (P300a), wideband power (zWBP), delta power (zDP), z-scored fast beta power (26–29 Hz sub-band, regional) (zFBP), maturational asymmetry (zMA), P50 ratio (zP50r). photic response at 20 Hz (zHR) coded bisynchronous spike waves (BSSW) and centrotemporal spikes (CTS), The spacing parameter was 0.198438 (optimized by jackknifing during training)
Non-parametric probabilistic neural network: statistics summary of 100 repetitions
| Samples | C1 | C2 | C3 | C4 | C5 | C6 |
|---|---|---|---|---|---|---|
| Training sample | ||||||
| Mean correct classification | 98.91 | 92.45 | 87.30 | 80.95 | 74.42 | 59.50 |
| Standard deviation | 3.00 | 5.89 | 6.45 | 3.63 | 9.73 | 11.67 |
| Coeff variation (%) | 3.04 | 6.37 | 7.39 | 4.48 | 13.08 | 19.61 |
| Minimum | 84.61 | 73.33 | 72.41 | 70.69 | 47.62 | 37.04 |
| Maximum | 100.00 | 100.00 | 100.00 | 86.21 | 95.00 | 77.78 |
| Range | 15.38 | 26.67 | 27.58 | 15.52 | 47.38 | 40.74 |
| Conf interv upper | 99.76 | 94.12 | 89.13 | 81.98 | 77.19 | 62.82 |
| Conf interv low | 98.061 | 90.78 | 85.46 | 79.92 | 71.66 | 56.18 |
| Validation sample | ||||||
| Mean correct classification | 89.20 | 89.03 | 75.21 | 86.60 | 79.41 | 58.67 |
| Standard deviation | 6.41 | 6.42 | 6.41 | 6.67 | 3.49 | 10.47 |
| Coeff variation (%) | 7.19 | 8.30 | 12.99 | 7.70 | 4.39 | 17.80 |
| Minimum | 72.73 | 73.20 | 40.06 | 69.00 | 72.22 | 38.46 |
| Maximum | 100.00 | 100.00 | 94.12 | 96.70 | 86.79 | 78.57 |
| Range | 27.27 | 26.80 | 54.04 | 27.70 | 14.57 | 40.11 |
| Conf interv upper | 91.03 | 91.52 | 75.51 | 88.50 | 80.41 | 61.65 |
| Conf interv low | 87.38 | 89.02 | 67.15 | 84.70 | 78.43 | 59.60 |
Stability estimates and confidence intervals of the classification function were tested by 100 bootstrap repetitions with random selection of the replaced samples. The average correct classification was higher, and the function stable for C1, C2, C3, and C4, while C6 had large standard deviations and coefficients of variation during both training and validation. C: cluster
We interpreted this as supporting the six neurophysiological groups from which the hypothesis-based treatment recommendations were derived. A scatterplot of classification coefficients by Functions 1 and 2, and 1 and 3 is seen in Figure 2.
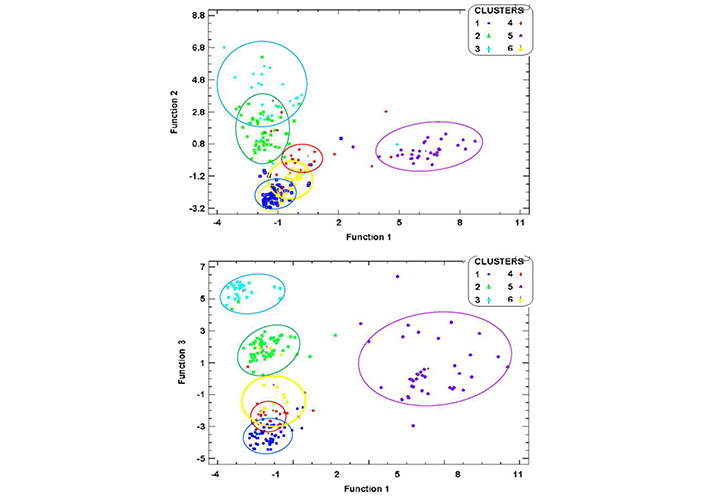
Scatter plots of discriminant Functions. Tighter cluster agglomeration was observed for C1 (dark blue) and C5 (purple) when Function 1 was plotted against Function 2, while C2 and C3 were spread and overlapping. In contrast, when Function 1 was plotted against Function 3, C2 (green) and C3 (light blue) showed tighter intra-cluster agglomeration and wider separation between clusters, but C5 was spread, and C1 overlapped with C4 (red). The definition of C6 (yellow) was poor in both plots
The variables with highest load for each of the clusters’ membership were consistent with each of the six different mechanisms hypothesized, therefore a treatment targeting the mechanism was recommended for each cluster (Table 4). Since a specific neurophysiological mechanism for ADHD has not been found, we decided to base the recommendation on the debated DA depletion hypothesis, assuming that even if the DA dysfunction has not been proven to be toward low function, it may be because of heterogeneity. By clustering subjects with longer zP300l we might have a subgroup in which DA hypofunction prevailed. The neuropsychologically-based recommended treatments (NBRTx) was MPH, and an in-site pharmaco-EEG test was also given to all children with abnormally long zP300l. Antiseizure medications (ASMs) were recommended to all children with enough IEDs to be classified in one of three clusters, C2, C3, or C5. The type of ASM was different for C2 because focal IEDs with temporal predominance have better response to carbamazepine (CBZ). Valproic acid (VAL) was recommended for C3 because of the hypothesized relation with absence seizures and the involvement of the thalamo-cortical circuitry. It was also the recommendation for C5 given its effect on cerebrovascular regulation in migraine. Risperidone (RSP) was recommended to C4 because decreased zP300a and zP50r is one of the most consistent findings in psychosis, for which RSP is one of the first-line treatments. Specifically designed psychotherapy on maturational asymmetry was recommended in C6, since zMA was the only abnormal finding.
The recommended medication schemes were:
VAL: initial dose: 10 mg/kg/day; weekly increments: 5 mg/kg/day until serum levels obtained at 1 month. Further increments, if necessary to get serum levels in the therapeutic mid-range: 5 mg/kg/day.
CBZ: initial dose: 10 mg/kg/day; weekly increments: 5 mg/kg/day until serum levels obtained at 1 month. Further increments if necessary to get serum levels in the therapeutic mid-range: 5 mg/kg/day.
MPH: initial dose 0.5 mg/kg/day. Increments, if necessary, 0.25 mg/kg/day until a maximum of 1.5 mg/kg/day.
RSP: initial dose 0.5 mg/day. Increments, if necessary: 0.25 mg/day until a maximum of 2 mg/day in children below 12 years, 3 mg/day in older than 12 years.
For a medication to be recommended it must meet all the following conditions: 1) Was already approved to use in children; 2) Had already been used for ADHD symptoms, even if with insufficient evidence-based medicine (EBM) to become a first-line recommendation; 3) Side effects known to occur frequently were be less harmful than the ADHD symptoms already present in the candidate child-personalized risk/benefit evaluation; 4) More severe but infrequent side-effects of the drug were easy to detect and reversible by discontinuation; 5) The parents were fully aware of the off-label status and the risks of the medication, were capable of early identification of undesired side effects; and 6) Communication was open 24 h among the three parties (parents-child, attending, our team) and the consult schedule was tightened to monitor for possible short- and long-term side-effects.
Neurophysiological results were sent to the referrals together with recommendations about pharmacological or psychotherapeutic treatment based on the study results, the rationale behind the recommendation and supporting bibliographic evidence. Referrals were aware of the nature and purpose of the study and willing to disclose the initial and follow-up clinical information. All parties had previously agreed that the therapeutic decisions were to be made only by the attending physicians and that our recommendations were to be taken as additional information to be used if considered relevant.
For the second stage, we constructed a 6–12 months’ timeline for each of the 182 children remaining under the referral’s care. ADHD scores at three and six months were compared only for the five clusters where the NBRTx and GBRTx were different, C2, C3, C4, C5, and C6. The data was not suitable for parametric analysis because of different sample sizes at the first evaluation, and more so at the second. Therefore, we conducted the statistical analysis of repeated measures with the non-parametric Friedman test of means and ranks [110].
Electrical brain network analysis
After the study was completed, we wanted to investigate how the dysfunctional mechanisms shown by the EEG/ERP studies in the different ADHD clusters could relate to connectivity measures of eBN behavior. Our group had already been working with eBN in other neuropsychiatric conditions, so we used the same protocols and software [101].
Source analysis
Low-resolution electromagnetic topography (LORETA) current source densities were calculated in 3D space with LORETA method using the Key Institute software [111] according to Talairach Atlas coordinates of the Montreal Neurological Institute’s MRI. Cross-spectral values at each 1 Hz frequency band were multiplied by the T matrix (x, y, and z current source moments in each of the 2,394 gray matter voxels, holding the corresponding weights for tissue connectivity in a 3-sphere model and Laplacian smoothing). Current sources of all voxels in each region of interest (ROI) were averaged to create 66 current source densities, for each 1 Hz band, for each 2.5 second epoch. For details on theoretical grounds and mathematical transformations, see Gomez and Thatcher [112].
The raw LORETA scores of the 48 epochs were averaged before further transformation. The 66 ROIs were reduced to 46 by combining adjacent ROIs with few voxels into ROIs with enough approximate normal distribution for z transformation with the NeuroGuide database [101].
eBN selection and analysis
Z-scored coherence and phase spectrums and indexes were calculated for each one of the pairs of ROIs in each of eight hypothesis-related eBNs. The phase slope index between each pair of ROIs that formed each of the eight eBNs was calculated to estimate the size and the direction of the information flow, with the BrainNavigator, NeuroGuide software [113].
Hypothesis-related network selection
Brain networks are relatively independent functional systems engaged in more or less specific tasks, yet they are not isolated entities. At any moment they are interacting with other networks, and it is from the interactions that the phenomenon emerges. May the phenomenon be the completion of an attention demanding task, or the restraint from jumping on another kid to eat his cake, multiple networks are dynamically engaged. We wanted to know which eBNs were affected in children with ADHD, and if those differed among the clusters. Also, if the pattern changed with medication in C1, and if there were any changes time-linked to the IEDs in C2, C3 and C5. Selection of the eBNs was also hypothesis related. EXN, dorsal-attention (DAN), ventral-attention (VAN), RWN, memory network (MEN), and default-mode networks were selected because of the evidence from fMRI studies of their involvement in ADHD [2], the language network (LGN) and anxiety network (AXN) were also included because of their implication in other developmental disorders highly comorbid with ADHD.
EEG epoch selection for different conditions
Epochs were selected visually from: awake, artifact-free EEG signal, slide windowed to complete 2 minutes [94]. Three separate collections were obtained from each record to represent the following conditions: 1) transient free, unmedicated, 2) transients-free, after 45 min of MPH ingestion (only for the in-site medicated subsample), 3) containing only transients, whether centrotemporal spikes (CTSs), bisynchronous spike-waves (BSSWs), or small sharp transients (SSTs). T-scores are used for comparisons between conditions.
Results
Neurophysiological findings
At visual inspection, IEDs were found in 121 EEGs, of which 85 (37%) met all criteria to be considered epileptiform [88]. These included: 1) CTSs, uni or bilateral, seen in 57 (24.8%) records (Figure 3); 2) BSSWs at 3 or 6/sec, generalized or frontal with longer lateral frontoparietal propagation paths. Additionally, SSTs with spike, sharp wave, or spike-wave morphology but lacking a field distribution or some other criteria were observed in 36 records (15.6%). The remaining 109 (47.4%) were normal at visual inspection (NVI) throughout the recording time. Summary of findings is in Table 6, individual examples in cluster’s figures below.
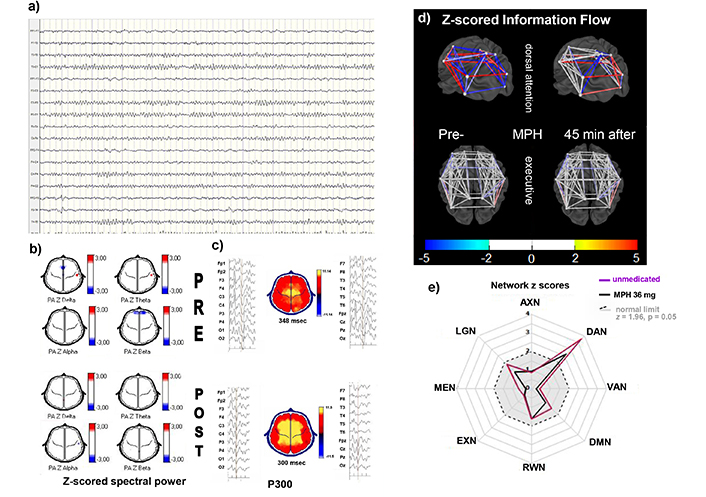
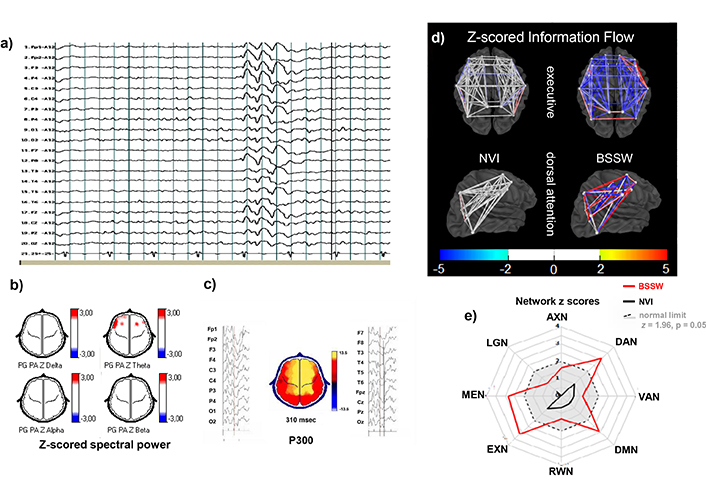
Individual example from C1. A 15-year-old male with ADHD combined presentation. EEG and ERPs were recorded before and 45 minutes after an oral dose of 54 mg MPH. a) EEG longitudinal montage, awake: Alpha activity over posterior regions, no abnormal transients. b) Z-scored spectral power topographic maps (color scale to the right): In the premedication (upper) and 45 minutes after oral MPH (lower). No significant abnormalities in either of the two conditions. c) P300 averaged epochs of EEG signal time-linked to the stimulus presentation on left and right of the topographic map of voltage at the time of maximal amplitude at central electrodes zP300l above normal limits (348 ms, z = 2.0) while unmedicated (upper), and within normal range (300 ms, z = 0.0) after MPH (lower). d) 3D model of zInFlw: Between each pair of ROIs constituting the dorsal attention and executive networks before (left) and 45 minutes after (right) the oral administration of 1 mg/kg MPH. zInFlw was altered between all pairs of ROIs in premedication condition, with some increases and others decreases (z-score scale at the bottom). Several were normalized by MPH. In contrast, the executive network showed no abnormal zInFlw between ROIs while unmedicated, nor after intake. e) Plot of averaged absolute zInFlw of all inter-ROIs pairs constituting each of the eight selected electrical brain networks (eBNs) as radial axes: anxiety network (AXN), dorsal attention DAN, ventral attention network (VAN), default mode network (DMN), reward/avoidance network (RWN), executive network (EXN), memory network (MEN), and language network (LGN). When calculated from NVI (black lines), all eBNs were within normal limits (gray area within the dashed circle), except for the DAN that showed abnormal zInFlw in both conditions, much larger before medication (absolute z = 3.4 pre-MPH, z = 2.4 after). This effect was seen in all C1 children, several of them reaching normal zInFlow values after MPH. MPH: methylphenidate; zP300l: z-scored auditory P300 latency; zInFlw: z-scored network information flow; ROIs: regions of interest
Quantitative electroencephalogram analysis
Quantitative electroencephalogram (QEEG) analysis revealed abnormally high zTBR in 150 children (65%). Decreased zDP appeared in 33 records, mainly in central and posterior regions. An increase in FWBP was seen in 27 children over the same areas where CTSs appeared. Increased zFBP was found in 49 children. In some records it could be seen at visual inspection as a monorhythmic sinusoidal pattern over frontotemporal regions, but usually these QEEG changes were unnoticeable at visual inspection.
Results from the ERP analysis showed significant zP300l increases in 89 children, zP300a decreases in 39, both measurements significantly altered in 15. Visual ERPs were less sensitive, only 25 children having abnormalities. P100a decreased in 25 (10.9%) and zP100r in 5 (2.2%). For other ERP measurements z-scores were between –1.96 and 1.96, p > 0.05.
Multivariate analysis
Eleven variables were retained after the PCA. In the cluster analysis, the variable loads for each cluster were those hypothesized to characterize each one of the physiopathogenic hypothesis.
After a non-parametric confirmation of cluster membership and variables contribution, we were confident to recommend a treatment strategy targeting the hypothesized mechanism (Tables 5 and 6).
Results from the PBNNC corroborated the existence of six independent groups. It also confirmed the individual memberships, with 89.6% correct classification in the training sample and 87.9% in the validating sample (Table 5). Stability indexes and confidence intervals as assessed by the 100 bootstrap repetitions were good overall, and for each one of the clusters, except C6 (Table 6).
Clusters, contributing variables, and hypothesis-related results
C1 was the largest cluster with 70 members. They all shared increased zP300l. Some of them had other ERP abnormalities, not as consistent and not all in the same direction. A non-significant trend towards low amplitude was seen in 20 children, zP300a decreased beyond 2z in 15 and significantly increased in 10.
Members of this cluster received the oral dose of MPH (details in Materials and methods). The latency of the second P300 decreased significantly as a group (p < 0.05) and individually in all subjects, reaching normal values in 35. Individual example in Figure 3.
Nineteen children with zP300l above 2z were not classified as members of C1 but to another cluster because of other dysfunctional changes with heavier loads. These children also received MPH because of the increased zP300l. In contrast to the good single-dose response to MPH seen in C1 children, only five from other clusters showed significant zP300l decrements and none reached normal values.
The most significant variables for C2 were CTSs and zFWBP, CTSs varied in quantity while awake, with a group average of 2 in 10 seconds, increasing dramatically during N1 and N2 sleep. Dipoles were along the sylvian fissure, unilateral or independent, or at the parietotemporal junction. Changing location and switching sides was common. Another measure with high load for this cluster was zFWBP. A power increase above 2z in two or more bands and extending more than two contiguous sensors was seen often but not always, coinciding with the location of maximal amplitude of the CTSs. The increased zFWBP has been considered also a reflex ion of focal cortical hyperexcitability [37]. A non-typical example of C2 is shown in Figure 4. This child differs from most in C2 because he had a combination of CTS and primary DA deficit evidenced by the long zP300l. The network analysis confirmed the double mechanism because during NVI epochs, the DAN z-scored network information flow (zInFlw) was already decreased, but the dysfunction worsened when analyzing CTS. In this child only the long-term recommendation after the study was to use of both ASM and MPH. After one year his attending changed CBZ for lamotrigine. He refers to the change as having more mental clarity, enjoying rather than suffering physical exercise and more enthusiasm in general.
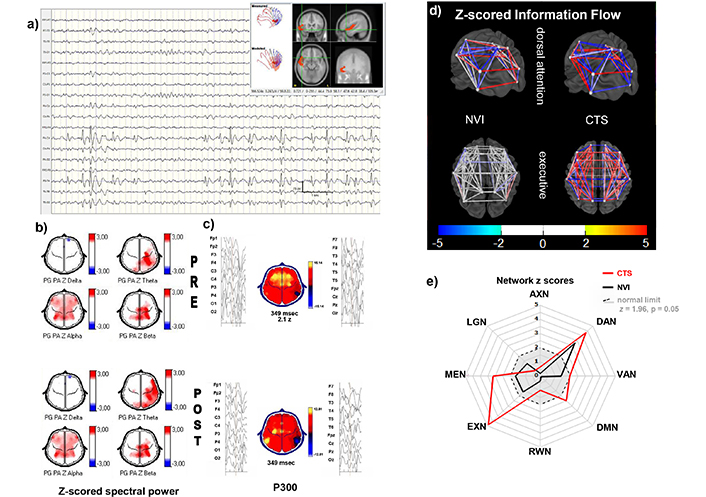
Individual example from C2. 15-year-old male with ADHD combined presentation, before and 45 minutes after MPH. a) EEG signal longitudinal montage, sleep stage N1: Frequent spikes followed by a slow wave with maximal activity over the right frontotemporal and parietal regions. The moving dipole shows a short trajectory from the temporal pole across the sylvian fissure (upper right). b) Z-scored spectral power topographic maps (z-score scale left of the maps): In the premedication (upper) and 45 minutes after oral MPH (lower). Increased alpha power at bilateral centroparietal, frontocentral, and frontotemporal regions. Theta and beta increased over the left centroparietal regions in the premedicated condition. MPH expanded the area affected in the theta band. c) P300 averaged epochs of EEG signal time-linked to the stimulus presentation on left and right of the topographic map of voltage showing a focally inverted polarity at the parietotemporal region during the time of maximal amplitude at central electrodes; the polarity inversion is caused by an earlier activation and deactivation of the hyperexcitable region. The zP300l was above normal limits (348 ms, z = 2.0) while unmedicated; after medication, the latency did not change but the area with inverted polarity increased, possibly reflecting spread of the hyperexcitable zone. d) 3D model of zInFlw: Between each pair of ROIs constituting the DAN (lower) and the EXN (upper) electrical brain networks, when analyzing epochs collected while NVI and with centrotemporal spikes (right). zInFlw is normal in the EXN with NVI epochs, while the DAN shows decreased and increased connectivity between different pairs of ROIs. This child differs from most in C2 because he had a combination of CTS and primary DA deficit evidenced by the long zP300l. The network analysis confirmed the double mechanism because during NVI epochs, the DAN zInFlw was already decreased CTS, but the dysfunction worsened when CTS were included in the analysis. In addition, the CTS epochs increased the number of affected connections, with zInFlw changes in both directions. In contrast, the normal connectivites of the executive network during NVI epochs became abnormally hyperconnected in the CTS epoch analysis (upper right). e) Radial plot of the averaged absolute zInFlw for each of the eight studied networks (ANX, DAN, VAN, DMN, RWN, EXN, MEN, LNG). In this C2 example, the zInFlw of the DAN was abnormal even for the NVI epochs (z = 3.4, black graph). The magnitude of the abnormality increased for the CTS collection (z = 4.4, red graph). The other seven eBNs were within normal limits for the NVI epochs (gray area within the dashed circle), but MEM, DMN and EXN became abnormal during the CTS. MPH: methylphenidate; zP300l: z-scored auditory P300 latency; zInFlw: z-scored network information flow; ROIs: regions of interest; eBNs: electrical brain networks; NVI: normal at visual inspection; CTS: centrotemporal spikes; AXN: anxiety network; DAN: dorsal attention network; VAN: ventral attention network; DMN: default mode network; RWN: reward/avoidance network; EXN: executive network; MEN: memory network; LNG: language network
The EEGs of C3 children also showed IEDs, different from the CTS in morphology and spatiotemporal behavior. Bifrontal BSSWs with frontal maximum appearing in rhythmic trains of variable duration, generalized or with an extensive electrical field. zTBR was also increased in this group. This pattern has been related to a different type of epilepsy than the ones around the sylvian fissure. Example is in Figure 5.
Individual example from C3. A 9-year-old girl with ADHD inattentive presentation. a) EEG signal reference montage, awake: 25–30 μV alpha activity over posterior regions, with frequent bursts of 3 per second 150–200 μV slow waves with a blurred spike component, 1–2 second duration at rest. Longer duration and higher voltage were also seen during HV. b) Z-scored spectral power topographic maps (scale to the right): From NVI epochs, show increased theta power over frontocentral and left frontotemporal regions. c) P300 Averaged epochs time-linked to the stimulus presentation on left and right of the topographic map showing a maximal amplitude at frontocentral electrodes, normal P300l (310 ms, z = 0.3) and amplitude (13.5 μV, z = 0.2). d) Z-scored information zInFlw: Within normal limits (white) between all pairs of ROIs that constitute the DAN and the EXN when analyzing NVI epochs (left). The analysis with BSSWs resulted in decreased zInFlw between most pairs of the EXN and a mixture of increased and decreased zInFlw for different pairs of ROIs within the DAN. e) Plot of averaged absolute zInFlw of all inter-ROIs pairs constituting each of the eight selected eBNs as radial axes. When calculated from NVI (black lines), all eNBs were within normal limits (gray area within the dashed circle). However, when calculated from BSSW epochs, DAN, MEN, DMN, and EXN were beyond normal limits, suggesting a marked impact of BSSWs predominantly affecting specific eBNs. EEG: electroencephalogram; MPH: methylphenidate; zP300l: z-scored auditory P300 latency; zP300a: z-scored auditory P300 amplitude; zlnFlw: z-scored network information flow; ROIs: regions of interest; NVI: normal at visual inspection; BSSWs: bisynchronous spikes-wave; AXN: anxiety network; DAN: dorsal attention network; VAN: ventral attention network; DMN: default mode network; RWN: reward/avoidance network; EXN: executive network; MEN: memory network; LNG: language network
The variables that contributed most to C4 membership were zFBp, zP300a and zP50r. These three findings have been related to psychosis by other groups. An example of this cluster is shown in Figure 6. EEGs were NVI or with non-specific minor changes, as in this example with low voltage diffuse beta irregular activity and frequent runs of monorhythmic fast beta at temporal regions. While these runs are difficult to see and usually ignored at visual inspection, the z-scored fast Fourier transform (FFT) denotes an abnormal peak at 28 Hz in Figure 6d. Small zP300a is also shown. Despite a high IQ (125) she was failing academic standards, her behavior was sometimes odd, but no psychotic traits were noticed clinically nor in the neuropsychological tests. After 2 weeks on RSP, she opened up to her psychiatrist: “I am very happy because, with the tinny pill, I no longer hear a voice that advised me to work on my math book* when the teacher starts telling weird stories**” (translated from Spanish, *: a mental image of the book, **: history, geography, etc.).
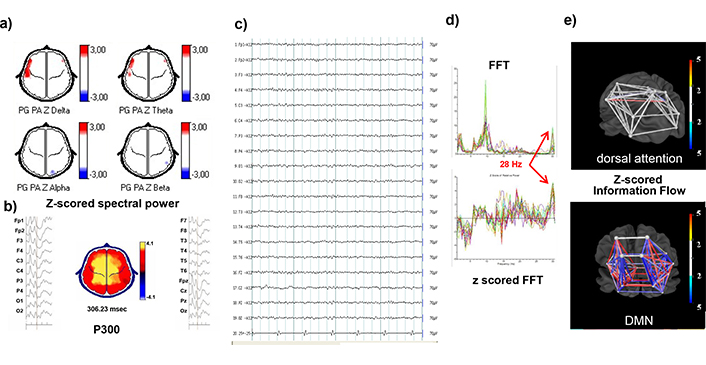
Individual example from C4. A 9-year-old female child with ADHD inattentive presentation, IQ = 125, and initial ADHDc scores of 13 (recorded). There was no evidence of psychotic traits in the psychiatric interview nor in the neuropsychological batteries. No improvement with MPH for several months. After the study, her psychiatrist switched to NBRTx, RSP. ADHDc scores dropped from 13 to 7 and 5 at 3 and 6 months, respectively. At the 3-month evaluation, she told her psychiatrist: “I am very happy because, with the tiny pill, I no longer hear a voice telling me to work on my math book* when the teacher begins to tell us weird stories.” (translated from Spanish, *: a mental image of the book). a) The topographical maps of z-scored absolute power in the four conventional bands show only an increase (3z) in delta and theta absolute power at left fronto and midtemporal regions. b) P300 averaged epochs of EEG signal time-linked to the stimulus presentation on left and right of the topographic map of voltage showing a maximal amplitude at central electrodes with normal zP300l (306 ms, z = 0.1) but abnormally low amplitude (4.1 μV, z = –4). c) EEG signal referential montage, awake, eyes closed: Low voltage irregular beta activity predominates during the entire record, with occasional 10 Hz alpha runs and no AP gradient, and short runs of rhythmic fast beta (Figure 5). d) FFT and z-FFT of 5 seconds NVI EEG. Abnormally rhythmic oscillations of a narrow-band fast beta at 28 Hz can be seen as a peak in the fast Fourier transform (upper plot in Figure d) and as a z-FFT peak in the lower graph. e) 3D model of z-scored information zInFlw: Between each pair of ROIs that constitute the DAN and the DMN networks. No abnormal zInFlw was seen between the ROIs of the DAN, while some pairs showed increased zInFlw. The low zP300 amplitude and increased zFBP were the most contributing variables for C4. ADHDc: ADHDc combined presentation; EEG: electroencephalogram; ERP: Event-related brain potential; MPH: Methylphenidate; zP300l: z-scored auditory P300 latency; zP300a: z-scored auditory P300 amplitude; zlnFlw: z-scored network information flow; z-FFT: z-scored fast Fourier transform; ROIs: regions of interest; zFBP: z-scored fast beta power (26–29 Hz sub-band, regional); AXN: anxiety network; DAN: dorsal attention network; VAN: ventral attention network; DMN: default mode network; RWN: reward/avoidance network; EXN: executive network; MEN: memory network; LNG: language network
The EEGs of C5 children had frequent SSTs while awake and in N1 and N2 sleep, also contributing to cluster membership was the z-scored 20 Hz EEG spectral power at 20 Hz photic stimulation (zHR), an extended photic response reflecting hyperexcitability between migraine episodes [94, 95], for example in Figure 7.
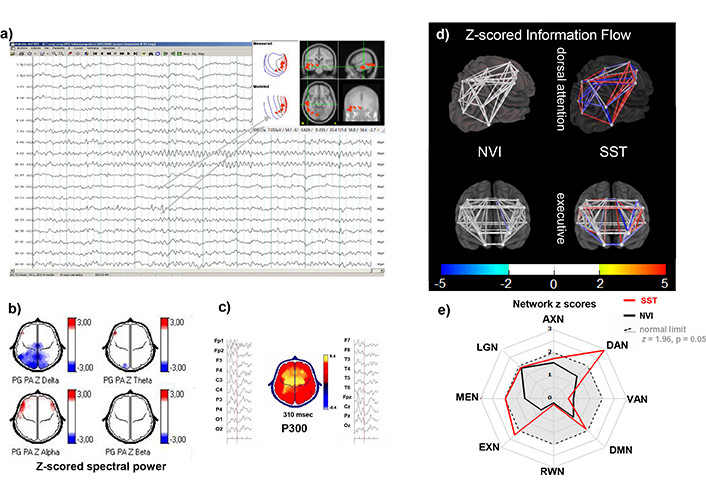
Individual example from C5. A 12-year-old male with ADHD combined presentation. a) EEG signal referential montage, awake: Alpha activity over posterior regions, frequent small sharp waves, and some low voltage spike-wave complexes with centrotemporal dipole. b) Z-scored spectral power topographic maps (color scale to the right): Show significantly low absolute delta power in posterior regions (upper left) and increased frontotemporal alpha. c) zP300 latency: normal zP300l (300 ms, z = 0.0) and within normal range for zP300 amplitude (8.4 μV, z = –1.8). d) 3D model of zInFlw: Between each pair of ROIs that constitute the DAN (upper) and the EXN (lower). Connectivity among all ROI pairs was normal (white) in both networks for the NVI epochs, while in the analysis with SSTs, the DAN showed increased (red) or decreased (blue) zInFlw between different pairs of ROIs. EXN was not affected by the SSTs. e) Plot of averaged absolute zInFlw of all inter-ROIs pairs constituting each of the eight selected eBNs as radial axes. When calculated from NVI (black lines), all eNBs were within normal limits (gray area within the dashed circle). During the SST epochs (red lines), EXN was slightly above normal, and the DAN reached z = 3. This child, along with others in C5, also showed a strong driving response to photic stimulation at 20 Hz (not shown). EEG: electroencephalogram; zP300l: z-scored auditory P300 latency; zP300a: z-scored auditory P300 amplitude; zlnFlw: z-scored network information flow; ROIs: regions of interest; AXN: anxiety network; SSTs: small sharp transients; DAN: dorsal attention network; VAN: ventral attention network; DMN: default mode network; RWN: reward/avoidance network; EXN: executive network; MEN: memory network; LNG: language network
The 22 children assigned to C6 had NVI records and no abnormal findings in the QEEG or ERP measurements. The variable with more weight for this cluster’s membership was the interhemispheric multivariate index asymmetry (zMA).
Follow-up results
Treatment was selected by their attendings, from the 182 children that remained under the same physician’s care, 123 were receiving NBRTx, and 128 received GBRTx. Table 7 shows the number of children in each cluster at the first evaluation in the second column, with the mean ADHD scores in the third, followed by the NBRTx: next are the number of returning children (fifth column) and the number of those children received the NBRTX (sixth column) with the ADHD scores of the whole cluster (NBRTx and GBRTx) in the seventh. Since for the 69 children in C1 the increased zP300l with no other EEG/ERP significant change, was consistent with decreased dopaminergic activity, and the in-site pharmacological test with MPH sifted the zP300l towards normal values. The response measured by ADHD scores was normally distributed and sample sizes were the same, ANOVA repeated measures was significant overall, with significant differences between no treatment and 3 months with treatment (15.8 ± 1.2 to 6.0 ± 2.3), and different between the first and second evaluations with treatment (6.0 ± 2.3 and 5.8 ± 2.1).
Longitudinal evaluation of treatment response with attention-deficit/hyperactivity total scores recoded (ADHDt) by cluster, at three and six months
| Initial evaluation and treatment response not medicated | 3 months evaluation | 6 months evaluation | ||||||||||
|---|---|---|---|---|---|---|---|---|---|---|---|---|
| Ret. | NBRTx | GBRTx | NBRTx | GBRTx | ||||||||
| C | n | ADHDt (SD) | RTx | n | n | ADHDt | n | ADHDt | n | ADHDt | n | ADHDt |
| C1 | 70 | 15.8 (1.2) | MPH | 69 | 69 | 6.0 (2.3) | 69 | 6.0 (2.3) | 69 | 5.8 (2.1) | 69 | 5.8 (2.1) |
| C2 | 58 | 15.5 (1.0) | CBZ | 38 | 18 | 8.7 (1.5) | 20 | 13.5 (2.3) | 36 | 7.6 (2.8) | 2 | 14.2 |
| C3 | 25 | 15.5 (1.5) | VAL | 15 | 8 | 6.3 (1.2) | 7 | 13.7 (2.3) | 15 | 5.1 (1.2) | - | - |
| C4 | 17 | 14.2 (1.2) | RSP | 10 | 4 | 5.7 (1.6) | 6 | 15.7 (1.2) | 10 | 7.6 (1.3) | - | - |
| C5 | 38 | 14.7 (1.4) | VAL | 30 | 12 | 7.9 (1.3) | 18 | 14.3 (1.9) | 30 | 7.6 (1.7) | - | - |
| C6 | 22 | 13.6 (1.4) | PST | 20 | 12 | 10.2 (3.2) | 8 | 15.7 (3.2) | 16 | 11.1 (3.7) | 4 | 14.1 |
| All | 230 | 15.2 (2.7) | - | 182 | 123 | 7.0 (2.4) | 59 | 12.5 (2.0) | 176 | 7.12 (2.9) | 6 | 14.2 |
The first four columns represent the initial evaluation with ADHD scores recoded from the original instruments in order to obtain a suitable score for statistical purposes (see Materials and methods for details) and recommended treatment for each of the clusters: Cluster (C) number, number of subjects in each cluster (n), group mean ADHDt scores and standard deviation (SD) in the blue cells, recommended treatment in the fourth column with clear cells: methylphenidate (MPH), carbamazepine (CBZ), valproate (VAL), risperidone (RSP), psychotherapy (PST). The fifth column is the number of subjects that continued under the attendings’ care at three months, followed by two columns (green cells) with number of subjects receiving the neurophysiologically based recommended treatments (NBRTx) and the group mean ADHDt scores, and two more columns with gray cells representing the children receiving the guidelines based recommended treatments (GBRTx). The last four columns contain the results at the six-month evaluation. Since after the 3-month results, most children were switched to the NBRTx, the number of children in green cells increased, leaving only 6 children on the GBRTx, gray cells. Notice that C1, first row was left with clear cells because the NBRTx was the same as the GBRTx, MPH. In this cluster, the favorable response was seen since the first evaluation, decreasing ADHDt mean scores from 15.8 to 6.0 and 5.8 at 3- and 6-month, respectively. In contrast, C2, C3, C4, and C5, children had good response to the NBRTx but not to the GBRTx at 3-month, the ADHDt group dropped significantly after most children were switched to the NBRTx for the 6-month evaluation. Results for C6 were not as notorious, but a slight improvement was noticed with psychotherapy (ADHDt scores from 13.6 to 10.2 and 11.1 at 3 and 6 months), and a statistically unsignificant worsening with MPH (ADHDt 14.1)
For the other five clusters the NBRTx was different from the GBRTx. Only these clusters could be used to compare the response between the two types of recommendations, the non-parametric means and ranks were used because the sample size differed between clusters and between evaluation points. The differences were significant for all clusters, except C6 (ADHDt scores in Table 7). Figure 8 shows the mean scores by treatment type (NBRTx, GBRTx) and the 95% decision limits for significance, for each of the five clusters.
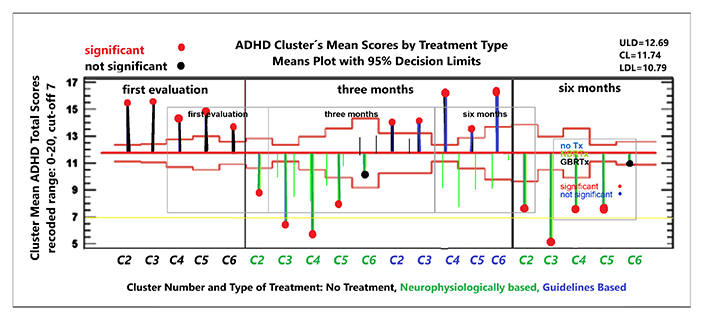
Longitudinal treatment response. Non-parametric repeated measures analysis of means and ranks on three factors: treatment type with three levels (first evaluation (unmedicated), neuropsychologically-based recommended treatments (NBRTx) and guidelines based recommended treatment (GBRTx) and cluster number with five levels. C1 was not included because for those children and NBRTx were the same. Cluster number and type of treatment on the X-axis: five clusters (C2, C3, C4, C5, and C6), each evaluated under two treatment types: GBRTx and NBRTx). On the Y-axis: group mean score of ADHD total scores, recoded. Vertical lines represent deviation from de Grand Mean with 6.0 (2.3) colored by treatment type: black: untreated at first evaluation; green, under NBRTx; blue under GBRTx: Decision limits with p < 0.95; red horizontal lines above and below the grand mean, significant deviations marked with red circles at the end of the vertical lines, blue circles for non-significant deviations. The chart shows significant drop of ADHDt scores at three and six months for children receiving the NBRTx in C2, C3, C4, and C5, and similar non-significant trend for C6. In contrast, children from C2, C3, and C6 receiving the GBRTx had only a slight decrease in ADHDt scores none crossing the grand mean line, and there was even an increase in C4. These results were interpreted as a good response to NBRTx and poor to GBRTx, motivating the attendings to switch from GBRTx to NBRTx in most children. Only six children remained under the GBRTx for the 6-month evaluation, one or two per cluster their results were unsignificant (not shown)
Children in C2, C3, and C5 received ASM as NBRTx. Mild side effects were reported at the beginning, mitigated by slowing the dose escalation. Somnolence was the main complaint and only with VAL. Three adolescents were switched to topiramate because of weight gain. Blood counts and liver function tests were normal at month one, three and six. Treatment response analyzed with non-parametric repeated measures [104] in Figure 8, C2 were excluded from the analysis. At 3 months the differences in ADHD scores were very significant between children under NBRTx and GBRTx. After the 3 months results, physicians decided to switch the children on the GBRTx to the NBRTx, so the repeated measures in Figure 8 do not have the GBRTx subgroup. Significant differences were found between types of treatment only, clusters did not differ significantly.
Cluster related differences in eBNs connectivity
The first consistent finding was that children with abnormally long zP300l also showed abnormal zInFlw in the DAN. This was true for all the children in C1, a cluster in which there were no other consistent abnormalities. It was also true for the 19 children that were assigned to different clusters because they also had abnormalities on other variables with heavier loads. This finding was more notorious when compared to all the other children in the sample. None of them had the abnormal zInFlow at the DAN or at any other of the studied eBNs when the analysis was performed on the NVI epochs. Figure 3d shows abnormal connectivity increase (red) or decreased (blue) between different pairs of ROIs within the DAN (upper), and the effect of MPH over this change. The EXN (lower) was not affected, nor were other networks studied. The radial plot (Figure 3e) shows the absolute z-scores for the eight networks studied. Only the DAN is outside normal limits, z = 4.4, (p < 0.0001) the amount of deviation decreased with MPH to 3.2 (p = 0.0007). Similar findings were found in all the other C1 members, reaching normal limits (z < 1.96, p > 0.05) in 35 of them.
Increased zP300l was also found in 19 children assigned to a different cluster because of other dysfunctional findings. Figure 3 is an example of this cluster overlap. The zP300l increase in Figure 3e was reflected also in the abnormal DAN zInFlw when only the NVI epochs were included in the analysis (black graph in the radial plot). Yet, the epochs with CTSs (red graph, same plot) showed a higher deviation of this measure, and extended the zInFlw abnormality to the MEN, EXN, and DMN.
Another important finding was the difference in zInFlw of the eBNs when calculated from NVI epochs and when IEDs were included in the analysis. The zInFlw from NVI epochs was within normal limits for all eBN in all clusters, except already described abnormality in the DAN in children with large zP300l. The two eBNs consistently affected in all clusters were the DAN and the EXN, also frequent were the RWN and the MEN, but only for the IED epochs, except the C1. IED related alterations were in different combinations, which were also related to the non-ADHD symptoms in that individual child.
Discussion
The objective of this study was to identify neurophysiological information that could assist practitioners in selecting the best treatment for each child with an ADHD diagnosis. The existing literature demonstrates significant clinical and physiopathogenic heterogeneity, and current practice guidelines recommendations have not been sufficiently effective [2, 114]. The specific questions addressed were: 1) Can the seemingly unrelated neurophysiological findings be connected to physiopathogenic mechanisms? 2) Can the diverse sample of children with ADHD be classified into distinct physiopathogenic subgroups? 3) Can treatment outcomes be enhanced by targeting the hypothesized physiopathogenic mechanisms?
Overall neurophysiological findings and clustering
All the children had at least one abnormal finding, in half of them detectable from the raw data. No single abnormality was found in all children, but several of them shared combinations. Our overall findings support the concept that some type of brain disfunction underlays ADHD symptoms in all the affected children, but do not support a single process or mechanism shared by all. This is consistent with most neurobiological literature where abnormal findings affect several pathways [24, 25], neurotransmitters [15, 19–22] or genetic signatures [26–28], differently across the subjects, although with patterns that suggest subgroups.
The classification cascade eliminated some of the hypothesis-related variables and classified the 230 children into six distinct clusters. We were confident that each cluster was representing a physiopathogenic hypothesis by looking at each variable’s contribution to the cluster’s membership. Yet, parametric analyses are not ideal for real-world samples. So, we double-checked with an independent non-parametric classifier [108, 109] on the original hypothesis-related set of variables. The classification into six groups with an almost identical individual’s memberships was interpreted as a confirmation of six clusters, each one representing a distinct physiopathogenic mechanism.
That does not mean that six mechanisms are all there is. In view of the growing evidence of multiple dynamical interactions among attentional and non-attentional networks [115], finding six disrupted mechanisms is an obvious oversimplification. Yet, it had a pragmatic value, treatment recommendations were derived from the hypothesized mechanisms.
Overall, the NBRTx was significantly better than the GBRTx as shown by the group means on ADHD scores, and at the individual level using repeated measures in those children that received the GBRTx for the first three months and then switched to the NBRTx because of the poor response. Group means of ADHD scores at 3 and 6 months are in Table 7, also shown with confidence intervals in Figure 8.
Clusters, physiopathogenic hypotheses, and recommended treatments
C1 and C4, the DA hypothesis
In line with a DA deficit [14], all children in C1 exhibited significantly prolonged zP300 latency [116], which was reduced with a single dose of MPH [36, 117], with half of the subjects reaching normal values. The clinical response was favorable in all children, reducing the mean ADHD group scores from 15.8 to 4.2 over the three-month evaluation period. The absence of other neurophysiological abnormalities indicates that DA dysregulation may be the primary mechanism underlying ADHD symptoms.
The P300l group results matched those of other groups [36–40] but not at the individual level. All our children in C1 had increased zP300l, a must because of its high load for C1 membership, while the unclassified ADHD samples from other groups showed more individual variability. In contrast, we did not find consistent abnormalities in zP300a or P50r in C1, and yet, these changes were consistent in C4. The discrepancy is likely because samples from other groups included children with two types of DA dysregulation, while our sample separated them into clusters with lower and higher DA activity.
The highest loaded variables for C4 were zP300a, zP50r, and zFBP. Decreased zP300a and zP50r were consistent findings in this cluster. Decreased P300a is the most consistent neurophysiological finding across studies in the schizophrenia spectrum disorders [118–120]. The deficit in sensory gating measured by the P50r is also a consistent finding in psychoses [121–123]. Our sample excluded children with present or past evidence of psychoses. A possible interpretation of these findings in C4 children is that the ADHD-like symptoms are mimicked by intrusive thoughts deviating the attention from purposeful ongoing tasks. Whether or not entering the psychotic realm, intrusive thoughts recruit attentional resources very efficiently. RSP was the NBRTx for C4. At 3 months the ADHD mean scores dropped 8 points with RSP, in contrast to 1 point increase of those under MPH. This was the only cluster in which MPH worsened the ADHD symptoms. A possible explanation could be that ADHD symptoms in these children were not because of a lack of attentional resources but because the resources were deviated by intrusive thoughts. Mesolimbic DA activity would more likely be increased from the start, further increased after MPH. The opposite with RSP which by antagonizing mesolimbic DA activity, would shift the balance in favor of the prefrontal and parietal pathways helping to purposefully allocate attentional resources. The C4 individual example in Figure 5 is not the typical but was selected to illustrate how comorbidities may escape even well trained and experienced specialists. This girl was hearing a voice, what counts as a psychotic symptom. Yet she was aware of the problem and very capable of concealing it even from her attending psychiatrist, until she knew that the problem could be solved.
Decreased amplitudes and longer latencies in ERP components have been reported in several ADHD studies [36–40] with moderate effects or mixed results [40, 117]. The measurements are sensitive to DA availability and have been related to stages in the attentional processes. However, we do not know with certainty what the overall effect of DA overactivity and underactivity is at each one of the attentional stages. Over attending to some stimuli or task may interfere with the ability to relocate resources when needed by another task. The effect would be difficult to differentiate from primary inattentiveness. In our sample the increased zP300l latency was a good response predictor for MPH, while decreased zP300a and zP50r were for RSP. These results suggest that both types of DA dysregulation can behave as ADHD symptoms. Being able to identify when or in which individuals DA dysregulation leans toward hyperactivity or in the opposite direction would be very helpful for treatment selection.
C2, C3, and C5: cortical hyperexcitability and IEDs
The EEEs of children in C2, C3, and C5 were abnormal at visual inspection, 83 (35%) had discharges fulfilling IED criteria [101]. This rate is higher than the 25–30% commonly reported [62], but lower than the 57% reported during sleep by Silvestri et al. in 2007 [123]. Lower rates have also been reported. It is possible that our sample has a higher rate because neurophysiological evaluations are more often asked for more severe or poorly responding cases.
The variables with higher loads for C2 were the quantity of CTSs and zFWBP, both reflecting hyperexcitability of the cortex underneath, more likely, a segment of an hyperexcitable network [55]. The morphology and spatiotemporal characteristics of CTSs are the same as those described by Halász et al. [55, 56] as the common endophenotype across the spectrum of epilepsies in the perisylvian epileptic network model in which ADHD occupies the extreme with lower cognitive deficit and lower epileptic propensity. But that does not mean that the discharges are harmless. On the contrary, the evidence has been growing after Binnie’s demonstration [58] of the impact IEDs can have on cognition and behavior, and more recently, on networks’ connectivity [52, 65, 70, 71], sleep-related memory consolidation [56] and on the neural tissue’s health [55, 63].
A different type of IEDs contributed to C3 membership. The spatiotemporal behavior of BSSWs is similar to the spike-wave complex characteristic of absence seizures [43–49, 65]. Both have anterior-posterior dipoles, bilateral synchrony, and a large inhibitory component, suggesting thalamo-cortical involvement. There are major differences though, starting with the voltage and field extension. Evidently, the inhibitory component does not recruit a large number of cortical projections. However, segmental activation of the cortico-thalamic system has been demonstrated in fMRI studies [65]. It has been suggested as a possible mechanism in those absence seizures in which only some higher order processes are arrested sparing others [48, 65]. The same type of mechanism could be operating in C3 children, manifested by partial arrests affecting only a few eBNs or subunits of eBNs so that do not appear as absence seizures. Atypical absences have longer durations and are more prone to evolve into a status [124]. That may also be the case in C3 children. Longer very frequent arrests of restricted eBNs sectors would compromise performance in the academic, social and or behavioral realms. Whether or not this phenomenon was happening, what we know was that the ADHD scores of the C3 children that started the trial under VAL dropped 9 points, only while only 1.8 points drop was seen in C3 children starting with MPH. In addition, these last ones were switched to VAL after the poor response at 3 months, with a remarkable improvement that yield 10.4 points drop-in group means, surpassing the cut-off for “no-ADHD” in the 6-month evaluation (Table 7, Figure 8).
The frequent SSTs in the EEGs and increased zHR in C5 suggest cortical hyperexcitability. An alternate hypothesis for the extended photic driving to 20 Hz in patients with migraine was an insufficient sensory gating because the patients showed also a decreased P100 ratio [125]. In our sample, C5 children had an increased zHR but not decreased zP100r, it might be because our patients did not have clinical evidence of migraine, so, regardless of the mechanism, lesser change in external measurements could be expected. It may also be because the PCA eliminated zP100r before entering the clustering function, metabolic changes caused by intermittent hypoperfusion episodes may also contribute to this pattern, since it can also be found in patients with frequent use of vasoactive substances (unpublished).
For C5, we chose VAL over other migraine preventive measures for two reasons: Our children did not have a diagnosis of migraine, not even frequent head, or abdominal pain, only an EEG with migraine-like changes, and, because the EEG also had other signs of cortical hyperexcitability. The ADHD symptoms responded well to VAL. Three adolescents were switched to topiramate after the 3-month evaluation because of weight gain, their ADHD scores remained low at six months. It is difficult to know if the good clinical response was because of the medication effect on cerebrovascular regulation or on amount of SSTs. The fact that in the same child eBNs connectivity was normal for NVI epochs and significantly altered for the epochs with SSTs points to the second mechanism, that the ADHD scores decreased because of fewer SSTs. It also suggests that the apparently innocuous small discharges do affect the connectivity of behaviorally relevant networks.
Now let us bring from the Introduction a strongly debated question: Should the IEDs be treated in subjects without ouverte epileptic seizures? The question has been relevant for decades in relation to non-epileptic symptoms and cortical hyperexcitability [126]. Recently, its relevance has extended to the context of preventing or slowing neurodegeneration and cognitive deterioration [127, 128]. For our work, the high relevance and urgent need of an answer is because we are dealing with critical periods of brain development [129].
The debate is long and beyond the scope of this paper. We did not find a comprehensive review; therefore, we will mention the general stands. Many authors are against the use of ASM in patients without epilepsy because of the side effects, particularly the negative effects on cognition [130–134]. A prospective study by Vatansever Pınar et al. [134] conclude that levetiracetam and valproate worsen aggression and ADHD symptoms in children with epilepsy.
Yet, other authors report cognitive and behavioral improvement of the ASM to control epilepsy [135, 136], or mixed results requiring a personalized approach [137].
Our results show that ASMs were beneficial in all children whose EEGs showed IEDs. Even those from C3 and C5 who received VAL had significant improvement. Further support came from those children with IEDs that started the trial with GBRTx switching to NBRTx after the 3-month evaluation. They were their own controls proving the superiority of ASM over MPH.
This does not mean that VAL had no negative side-effects on these children, but only the positive ones outweighed the negative. This happened even though VAL and TPR are known to have more negative cognitive effects than other ASMs. A better alternative would have been lamotrigine, as illustrated by the anecdotical report from the patient from C2.
These findings are in agreement with several authors recommending the use of ASMs to treat ADHD symptoms associated with IEDs even if the patient has never had an ouverte seizure. Their recommendations are based on recent evidence that single IEDs interfere with network function and can cause long-lasting impact on several important networks [127–129], and on the possibility of unrecognized seizures [43–45, 65]. This could be related to our C3 children.
Based on the accumulated evidence, Swatzyna et al. [138] advocated for a paradigm change in Psychiatry to include the use of EEG evaluation and to broaden the treatment options, more so for refractory cases. Our results also support that claim.
Off-label prescriptions of ASMs for patients with ADHD continue rising, more likely due to insufficient response to the GBRTx [139]. Combined treatments with atypical antipsychotics are also used [140]. This seems like a call for evidence-based studies that can promote or discourage those type of drugs. But it would be very important to first parse the heterogeneous ADHD population.
Study limitations
This study has several important limitations. Some are inherent to the type of study which also has some strengths: person-centered observational in a clinical setting. This approach has a real-world taste, with all its diversity, each patient is a unique sample, he or she must be its own control. The inherent limitations are of two types: 1) The researcher has null or very little control over the trial development. 2) How to interpret the findings without blind data collection, randomly assigned treatments, and matched controls. We cannot know, for example, what would have happened if the recommended treatment for a hypothesized dysfunction was given to normal controls or to children in a different cluster. The only ones who were their own controls were the children from any cluster except C1 that received GBRTx during the first three months, when, because of poor response to the GBRTx were shifted to NBRTx. The steep decrease in ADHDt was a clear demonstration of NBRTx superiority over the GBRTx. The good response was also seen in children receiving NBRTx since the beginning, but a large placebo effect cannot be discarded for these cases.
A selection bias is inherent, since the attending physicians are more inclined to ask for neurophysiological evaluation to non-responders, paradoxical responders, and atypical or more severe presentations. It can be expected that an unbiased sample would have a larger proportion of C1 children with long zP300l and good response to MPH, while less children of the other clusters. Thus, less CTSs, BSSWs, migraine, and psychoses-prone children. Yet, the same neurophysiological dysfunctions are expected in the general ADHD population, only in different proportions.
About the in-site pharmacological intervention, it is not a standard or an EBM-recommended test. But it is safe, has been used “off-label to help clinicians with personalized therapeutic planning and we had been using it before the present work. Therefore, oral MPH was given only to children with abnormally large zP300l if the test was asked by their physicians. Every patient was in his or her own control. The ethical aspects of the in-site pharmacological manipulation, as well as the off-label recommendations to attendings, have been discussed in the Materials and methods section.
Other limitations regarding ADHD scores, use of off-line medications, and possible side-effects were discussed in the methods section. Side-effects of the off-label medications were officially documented only for one year. Yet, we are still in contact with physicians and patients. Long-term information was shared through verbal reports for must of the children, no significant side-effects or quitting, good academic, behavioral and social outcomes, some children already off-medication after 2 years asymptomatic. A formal, long-term, quantifiable follow-up of these children is planned for the near future.
Hypothesis-related selection of variables is another limitation. It means that we can only prove or reject information that we already suspected. It is not a real exploration of the open field. A high level of evidence for each variable’s relation with the hypothesized mechanism was not needed, since up to now no single variable has been uniquely and exclusively to any physiopathogenic mechanism, not even the IEDs to epileptic foci. We suspected six physiopathogenic mechanisms and we were able to show how six PCA components extracted from the hypothesis-selected variables could classify the sample. Even more, treatments selected accordingly were able to ameliorate and, in some cases, eliminate ADHD symptoms. But that does not mean that six mechanisms are all there is. It was all we were looking for.
Also, the sample is small compared to other studies, much too small to represent the 162 million children and adolescents with ADHD around the world. Data-based analysis on massive and repository data banks are a promising way to get unbiased information about almost anything, in the near future.
Another great jump would be to change from single variable measurements to gradients in multivariate observations, such as the Research Domain Criteria. Also necessary is a change in the nosological taxonomy to include physiopathogenic mechanisms. These changes are coming soon.
But they are not here now. Answering the open questions on ADHD is time-sensitive because it is happening now in developing brains. So, hypothesis-guided research is what we can do, being aware that the answers are limited by how the hypothesis was built, its premises, its breadth, and its depth.
This type of study has a low level of evidence; results must be interpreted cautiously. Yet, we think that our findings should be shared looking for replication and extension by different groups and hopefully promoting research with a higher level-of-evidence on the same questions, or any other topic brought up by our findings.
Conclusions
Our findings suggest that ADHD does not arise from a single underlying mechanism; instead, multiple, and not always convergent pathways contribute to the phenotype. Six clusters related to physiopathogenic mechanisms were found. The treatment recommendations based on these hypotheses outperformed the standard MPH treatment in all but one cluster, where neurophysiological and first-line suggestions coincided. Our results indicate that addressing physiopathologic mechanisms is the most promising route to successful treatment.
The DA deficit hypothesis was most likely the mechanism prevalent in C1, in which long zP300l was the only finding and responded to an oral administration of MPH. The good response to MPH was seen in the ADHDt scores at 3- and 6-month evaluations.
Three other clusters were characterized by abnormal EEGs because of IEDs. In C2 the CTS had the spatiotemporal characteristics if the discharges in the perisylvian epileptic network model, the NBRTx was CBZ with very good response, some children reached the “no-ADHD” cut-off point in the ADHD recoded scale. C3 had spatiotemporal behavior similar to interictal discharges of the absence epilepsies, NBRTx was VAL, and the response was also good, despite the negative effects on cognitive function of the drug. We believe the response could be even better with lamotrigine, as we are planning to use it in another sample.
Our findings also support possible causal relationships with other disorders besides epilepsy, also considered comorbidities, such as migraines, and psychoses. Treatments designed for those disorders also had a better effect on ADHD symptoms than MPH in children from C4 and C5.
Neurophysiology is today the best way to search for physiopathogenic mechanisms at the clinical level because it is widely accessible, non-invasive, and has continuously improving methodologies. With one of these new techniques, the analysis of eBN connectivity we have been able to demonstrate the direct impact of IED on the zInFlw of specific eBNs related to attention, executive function, reward-avoidance and working memory.
Our sample was small even for neurodevelopmental datasets, and the study has several limitations, some inherent in the study type. Results should be interpreted cautiously. Even though we still think that our findings are worth sharing because they relate to currently open questions in literature, and more importantly, because they were useful in designing treatment recommendations that lead to good outcomes.
Abbreviations
| ADHD: | Attention Deficit Hyperactivity Disorder |
| ASMs: | antiseizure medications |
| AXN: | anxiety network |
| BSSWs: | bisynchronous spike-waves |
| CBZ: | carbamazepine |
| CTSs: | centrotemporal spikes |
| DA: | dopamine |
| DAN: | dorsal-attention |
| DMN: | default mode network |
| DSM-5: | Diagnostic and Statistical Manual of Mental Disorders 5 |
| EBM: | evidence-based medicine |
| eBNs: | electrical brain networks |
| EEG: | electroencephalogram |
| ERPs: | event-related brain potentials |
| EXNs: | executive networks |
| fMRI: | functional magnetic resonance imaging |
| GBRTx: | Guidelines based recommended treatment |
| IED: | interictal epileptiform discharge |
| IFCN: | international federation of clinical neurophysiology |
| IQ: | intelligence quotient |
| LGN: | language network |
| LORETA: | low-resolution electromagnetic topography |
| MEN: | memory network |
| MPH: | methylphenidate |
| NBRTx: | neuropsychologically-based recommended treatments |
| PBNNC: | probabilistic Bayesian neural network classification |
| QEEG: | quantitative electroencephalogram |
| ROI: | region of interest |
| RSP: | risperidone |
| RWN: | reward/avoidance network |
| SSTs: | small sharp transients |
| TBR: | theta-beta ratio |
| VAL: | valproic acid |
| WAIS: | wechsler adult intelligence scale |
| WISC: | wechsler intelligence scale for children |
| zFBP: | fast-beta sub-band from 26 to 29 Hz |
| zFWBP: | z-scored focal wide-band power |
| zHR: | z-scored 20 Hz EEG spectral power at 20 Hz photic stimulation |
| zInFlw: | z-scored network information flow |
| zMA: | z-scored maturational asymmetry |
| zTBR: | z-scored theta-beta ratio |
Declarations
Author contributions
MGM: Conceptualization, Investigation, Writing—original draft, Supervision, Data curation, Formal analysis. AT: Investigation, Data curation, Formal analysis, Writing—review & editing. MJMS: Investigation, Supervision, Project administration, Resources. AM: Investigation. OML: Project administration, Supervision, Writing—review & editing. LC: Investigation, Project administration, Writing—review & editing. LQ: Data curation, Formal analysis. CA: Conceptualization, Investigation, Data curation, Formal analysis.
Conflicts of interest
The authors declare that they have no conflicts of interest.
Ethical approval
The project “Neurophysiological findings in Attention Deficit Hyperactivity Disorder, a Pandora’s box with therapeutic implications” was reviewed and approved by the Ethics Committee of the Hospital Español de México (signed and sealed acceptance letter).
Consent to participate
Informed consent to participate in the study was obtained from all the participants/parents.
Consent to publication
Not applicable.
Availability of data and materials
The raw and analyzed EEG/ERP data and the neuropsychological scores are available on request to the corresponding author to all qualified investigators.
Funding
Not applicable.
Copyright
© The Author(s) 2025.
Publisher’s note
Open Exploration maintains a neutral stance on jurisdictional claims in published institutional affiliations and maps. All opinions expressed in this article are the personal views of the author(s) and do not represent the stance of the editorial team or the publisher.