Meta-Analysis

Affiliation:
1Faculty of Medicine, Public Health, and Nursing, Universitas Gadjah Mada, Yogyakarta 55281, Indonesia
2Department Surgery, Dr. Soeradji Tirtonegoro General Hospital, Klaten 57234, Indonesia
ORCID: https://orcid.org/0009-0009-7498-0084
Affiliation:
1Faculty of Medicine, Public Health, and Nursing, Universitas Gadjah Mada, Yogyakarta 55281, Indonesia
Email: kavi.gilang.permana@mail.ugm.ac.id
ORCID: https://orcid.org/0009-0002-1224-3336
Affiliation:
1Faculty of Medicine, Public Health, and Nursing, Universitas Gadjah Mada, Yogyakarta 55281, Indonesia
3Department Oncological Surgery, Dr. Sardjito General Hospital, Yogyakarta 55281 Indonesia
ORCID: https://orcid.org/0000-0002-1143-4125
Affiliation:
1Faculty of Medicine, Public Health, and Nursing, Universitas Gadjah Mada, Yogyakarta 55281, Indonesia
4Department of Anatomical Pathology, Dr. Sardjito General Hospital, Yogyakarta 55281, Indonesia
ORCID: https://orcid.org/0000-0001-9728-5046
Affiliation:
1Faculty of Medicine, Public Health, and Nursing, Universitas Gadjah Mada, Yogyakarta 55281, Indonesia
3Department Oncological Surgery, Dr. Sardjito General Hospital, Yogyakarta 55281 Indonesia
ORCID: https://orcid.org/0000-0002-2607-6682
Explor Target Antitumor Ther. 2025;6:1002289 DOI: https://doi.org/10.37349/etat.2025.1002289
Received: August 15, 2024 Accepted: December 22, 2024 Published: February 13, 2025
Academic Editor: Nicola Normanno, IRCCS Istituto Romagnolo per lo Studio dei Tumori (IRST) “Dino Amadori”, Italy
Background: Telomere length is a potential prognostic biomarker in breast cancer, but its clinical utility remains uncertain due to inconsistent findings across the literature. This systematic review and meta-analysis aims to evaluate the association between telomere length and breast cancer survival outcomes, including overall survival (OS), disease-specific survival (DSS), disease-free survival (DFS), and recurrence-free survival (RFS).
Methods: A systematic search of ten sources, including databases and publishers (JSTOR, Nature, ProQuest, PubMed, Sage Journals, ScienceDirect, Science, Scopus, Springer, and Wiley) was conducted to identify studies published up to December 31, 2023. Studies reporting associations between telomere length and survival outcomes in breast cancer patients were included. Hazard ratios (HRs) and odds ratios (ORs) with 95% confidence intervals (CI) were extracted or calculated. Quality assessment was performed using the Newcastle-Ottawa Scale, and publication bias was evaluated using funnel plots, Egger’s, and Begg’s tests.
Results: Nine studies involving 3,145 breast cancer patients were included. Shorter telomere length was significantly associated with increased recurrence risk (DFS/RFS) (pooled HR: 1.97; 95% CI: 1.04–3.74, P = 0.039), indicating a nearly twofold increase in risk. Trends toward worse OS (pooled HR: 1.60; 95% CI: 0.90–2.86, P = 0.110) and DSS (pooled HR: 1.09; 95% CI: 0.80–1.49, P = 0.565) were observed, but did not reach statistical significance. Additionally, shorter telomere length was significantly associated with premenopausal status (pooled OR: 1.34; 95% CI: 1.06–1.70, P = 0.01).
Discussion: Shorter telomere length is associated with an increased risk of recurrence in breast cancer, highlighting its potential as a prognostic biomarker. However, further research is needed to standardize telomere length measurement methodologies and validate these findings across diverse populations and breast cancer subtypes.
Breast cancer remains the most prevalent malignancy and a leading cause of cancer-related mortality among women globally, with over 2.3 million new cases and nearly 685,000 deaths annually [1]. Despite significant advances in early detection and treatment modalities, prognostic outcomes continue to vary widely due to the inherent heterogeneity of the disease and differences in tumor biology [2]. While established prognostic factors such as tumor stage, molecular subtype, and hormone receptor status provide valuable insights, there is a growing need for additional biomarkers to enhance risk stratification and guide personalized treatment decisions [3, 4].
Telomere length has emerged as a potential biomarker of cancer prognosis due to its fundamental role in maintaining genomic stability [5]. Telomeres, repetitive nucleotide sequences (TTAGGG) located at the ends of chromosomes, protect genomic integrity by preventing chromosomal end-to-end fusions and instability [6]. Telomeres progressively shorten with each cell division due to incomplete DNA replication, a process further accelerated by oxidative stress and chronic inflammation [7, 8]. This progressive shortening can lead to genomic instability, cellular senescence, and oncogenesis [9]. In cancer, telomere dysfunction is associated with tumor progression, metastasis, and poor clinical outcomes [10, 11].
Short telomeres are associated with increased genomic instability, a hallmark of cancer progression, and poor outcomes in patients with breast cancer [12, 13]. Research on specific subtypes reveals telomere shortening in aggressive forms of breast cancer, including triple-negative breast cancer (TNBC) and human epidermal growth factor receptor 2 (HER2)-positive breast cancer [14–16]. Although numerous studies have explored the relationship between telomere length and breast cancer outcomes, findings remain inconsistent. Some studies report shorter telomeres as a risk factor for worse survival [17–22], while others demonstrate weak or non-significant associations [23–25]. These discrepancies are likely due to variations in telomere measurement techniques, differences in sample types, and population heterogeneity [26]. Furthermore, population-specific differences in telomere biology and genetic predispositions, such as BRCA2 mutations, have been shown to increase the risk of breast cancer development and progression, adding another layer of complexity to prognostic interpretations [27].
This systematic review and meta-analysis aims to evaluate the association between telomere length and breast cancer survival outcomes, including overall survival (OS), disease-specific survival (DSS), disease-free survival (DFS), and recurrence-free survival (RFS). By integrating data from multiple studies, this research seeks to clarify the prognostic significance of telomere length and identify gaps that must be addressed to advance its clinical utility.
This systematic review and meta-analysis adhered to the Preferred Reporting Items for Systematic Reviews and Meta-Analysis Protocols (PRISMA-P) guidelines [28]. The study protocol was registered in the International Prospective Register of Systematic Reviews (PROSPERO) (Registration ID: CRD42023436764). Ethical approval and informed consent were not required as this study involved the secondary analysis of published data without direct patient interaction.
Studies were included if they met the following criteria: (1) patients with histologically or pathologically confirmed breast cancer; (2) patients categorized based on telomere length (short vs. long); (3) studies reporting survival outcomes, including OS, DSS, DFS, or RFS, presented as hazard ratios (HRs) with 95% confidence intervals (CI), Kaplan-Meier curves, or raw data suitable for extraction; (4) observational studies (cohort or case-control) published in English.
Studies were excluded if they were reviews, conference abstracts, editorials, in vitro or in vivo studies, or lacked sufficient data. Sufficient data refers to clearly reported HR and CI or data extractable from Kaplan-Meier curves [29].
A comprehensive literature search was conducted across databases and publishers, including JSTOR, Nature, ProQuest, PubMed, Sage Journals, ScienceDirect, Science, Scopus, Springer, and Wiley, for studies published up to December 31, 2023. Search terms combined variations of keywords such as “Breast Cancer”, “Breast Neoplasm”, “Breast Tumor”, “Breast Malignant Neoplasms”, “Mammary Carcinoma”, “Breast Carcinoma”, “Telomere Length”, “Prognosis”, “Survival”, and “Recurrence”. Specific search strategies for each database are provided in Table S1.
Two independent authors screened the titles and abstracts of all retrieved articles. Full-text assessments were performed to confirm eligibility based on predefined criteria. Discrepancies were resolved through consensus or consultation with another author. The study selection process is illustrated in the PRISMA flowchart.
Data were extracted independently by two authors using a standardized form. Extracted information included: (1) Study characteristics: first author, publication year, geographic region, sample type, telomere measurement metric, method, telomere length categorization, cut-off value, and follow-up duration. (2) Patient characteristics: menopausal status, tumor grade, tumor stage, lymph node involvement, and hormone receptor status; (3) Outcomes: survival metrics (OS, DSS, DFS, RFS), HR, odds ratio (OR), 95% CI, and P-values. For studies without directly reported HR or 95% CI, data were extracted from Kaplan-Meier curves using validated methods [29].
Study quality was assessed using the Newcastle-Ottawa Scale (NOS), which evaluates selection, comparability, and outcome assessment [30]. Studies scoring ≥ 7 were considered high-quality. Disagreements in scoring were resolved through discussion or input from other authors.
Statistical analyses were conducted using STATA v.17. The following approaches were applied: (1) effect size calculation: pooled HR with 95% CI for survival outcomes (OS, DSS, DFS, RFS) and pooled OR for clinicopathological characteristics; (2) heterogeneity: assessed using Cochran’s Q test and Higgins I2 statistic. A random-effects model was applied if heterogeneity was significant (I² > 50%), otherwise a fixed-effects model was used [31]; (3) subgroup analyses: performed based on geographic region, telomere measurement metric, method, and sample type. Only subgroups with at least three studies were included in the analysis; (4) publication bias: evaluated using funnel plots [32], Egger’s test [33], and Begg’s test [34]. Funnel plot asymmetry was interpreted cautiously given the small number of studies included; (5) sensitivity analysis: conducted by systematically excluding individual studies to assess the robustness of pooled estimates.
A systematic search identified 3,573 articles. After removing 817 duplicates, 2,756 titles and abstracts were screened. From these, 62 full-text articles were assessed for eligibility. Nine studies met the inclusion criteria and were included in the final meta-analysis (Figure 1). These studies encompassed 3,145 breast cancer patients [17–25].
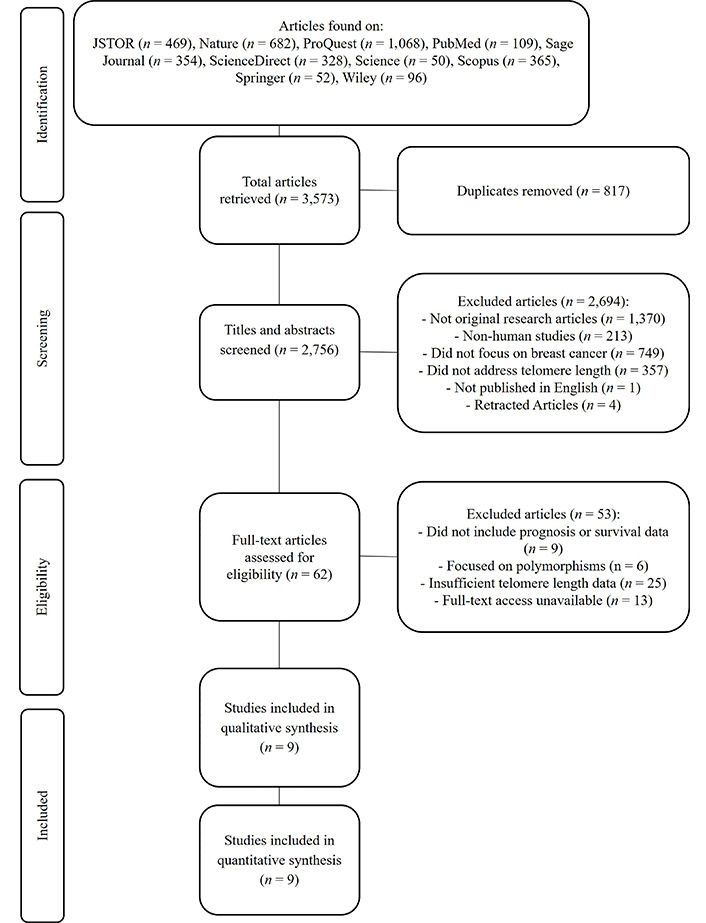
PRISMA-P flowchart for selecting articles included in systematic reviews and meta-analysis. PRISMA-P: Preferred Reporting Items for Systematic Reviews and Meta-Analysis Protocols
All included studies scored ≥ 7 on the NOS, indicating a low risk of bias (Table 1). Most studies demonstrated adequate case definitions, robust telomere measurement techniques, and appropriate follow-up durations [30].
Quality assessment of included studies using the Newcastle-Ottawa Scale
| Study | Selection (0–4) | Comparability (0–2) | Outcome (0–3) | Total Score (0–9) | Quality rating |
|---|---|---|---|---|---|
| Duggan et al. [17] (2014) | 4 | 2 | 3 | 9 | High |
| Fordyce et al. [18] (2006) | 4 | 2 | 2 | 8 | High |
| Gay-Bellile et al. [19] (2016) | 4 | 2 | 3 | 9 | High |
| Heaphy et al. [20] (2007) | 4 | 2 | 3 | 9 | High |
| Lu et al. [21] (2011) | 4 | 2 | 3 | 9 | High |
| Shen et al. [23] (2012) | 4 | 2 | 3 | 9 | High |
| Simpson et al. [22] (2015) | 4 | 2 | 3 | 9 | High |
| Svenson et al. [24] (2008) | 4 | 2 | 2 | 8 | High |
| Vodenkova et al. [25] (2020) | 4 | 2 | 2 | 8 | High |
The NOS evaluates study quality based on three main criteria: (1) selection (0–4): assesses the representativeness of the study population, the clarity of case definitions, and the appropriateness of control selection; (2) comparability (0–2): evaluates adjustments for confounding factors in the study design and analysis; (3) outcome (0–3): measures the adequacy of follow-up and the consistency of outcome assessment.
The nine included studies varied in geographic regions (America, Europe), sample types (blood plasma, tumor tissue), and telomere measurement methods [relative telomere length (RTL), telomere DNA content]. Follow-up durations ranged from 4.6 to 23 years [17–23], though two studies did not report follow-up periods [24, 25]. Detailed study characteristics are presented in Table 2.
Characteristics of studies included in the systematic review and meta-analysis
| Author | Year | Region | Sample type | Telomere measurement metric | Measurement method | Patients (n) | Telomere length | Follow-up (years) | Cut-off value | Outcomes (HR, 95% CI, P-value) | |
|---|---|---|---|---|---|---|---|---|---|---|---|
| Short (n) | Long (n) | ||||||||||
| Duggan et al. [17] | 2014 | America | Blood plasma | Relative telomere length [telomere-to-single copy gene ratio (T/S ratio)] | qPCR | 611 | 306 | 305 | 11.2 years | Median (0.81) | OS: 1.33 (0.90–2.00, P = 0.14) |
| DSS: 1.33 (0.79–2.27, P = 0.27) | |||||||||||
| Fordyce et al. [18] | 2006 | America | Tumor tissue | Telomere DNA content (TC) | Slot blot assay | 77 | 35 | 25 | 23 years | Tertiles (short < 101%, long > 123%) | DFS: 4.39 (1.47–13.08, P = 0.008) |
| Gay-Bellile et al. [19] | 2016 | Europe | Tumor tissue | Relative telomere length (T/S ratio) | qPCR | 55 | 22 | 23 | 17 years | Median (1.03) | OS: 2.9 (1.00–8.47, P = 0.050) |
| DFS: 3.31 (1.38–7.04, P = 0. 0076) | |||||||||||
| Heaphy et al. [20] | 2007 | America | Tumor tissue | TC | Slot blot assay | 530 | 444 | 86 | 9.16 years | Threshold (short ≤ 200%, long > 200%) | OS: 2.25 (1.09–4.64, P = 0.029) |
| DFS: 3.14 (1.27–7.76, P = 0.013) | |||||||||||
| Lu et al. [21] | 2011 | Europe | Tumor tissue | Relative telomere length (T/S ratio) | qPCR | 348 | 170 | 166 | 9 years | Median | OS: 1.27 (0.76–2.13) |
| DFS: 1.19 (0.76–1.82) | |||||||||||
| Shen et al. [23] | 2012 | America | Blood plasma | Relative telomere length (T/S ratio) | qPCR | 1,026 | 510 | 516 | 9.4 years | Median (0.73) | OS: 0.91 (0.68–1.20) |
| DSS: 0.99 (0.68–1.45) | |||||||||||
| Simpson et al. [22] | 2015 | Europe | Tumor tissue | Telomere length (in kb) | Single telomere length analysis (STELA) assay | 120 | 8 | 112 | 4.6 years | Median (2.26 kb) | OS: 21.4 (7.9–57.6, P < 0.0001) |
| Svenson et al. [24] | 2008 | Europe | Blood plasma | Relative telomere length (T/S ratio) | qPCR | 227 | 114 | 113 | N/A | Median (0.73) | OS: 0.34 (0.16–0.75, P = 0.007) |
| Vodenkova et al. [25] | 2020 | Europe | Blood plasma | Relative telomere length (T/S ratio) | qPCR | 151 | N/A | N/A | N/A | Median | OS: 1.02 (0.34–3.05, P = 0.97) |
| RFS: 0.72 (0.29–1.77, P = 0.47) | |||||||||||
OS: overall survival; DSS: disease-specific survival; DFS: disease-free survival; RFS: recurrence-free survival; qPCR: quantitative polymerase chain reaction; HR: hazard ratio; CI: confidence intervals; N/A: not available
Table 3 summarizes the clinicopathological characteristics of breast cancer patients from the nine included studies [17–25]. Tumor grade [20, 21], lymph node metastasis (LNM) status [18, 21], menopausal status [20, 23], and HER2 status [20, 23] were reported in two studies each. Tumor stage [18, 20, 21], estrogen receptor (ER) status [20, 21, 23], and progesterone receptor (PR) status [20, 21, 23] were more frequently reported, appearing in three studies.
Clinicopathological characteristics of patients with telomere length
| Author | Year | Tumor grade | Tumor stage | Menopausal status | LNM | HER2 | ER | PR | |||||||
|---|---|---|---|---|---|---|---|---|---|---|---|---|---|---|---|
| 3 | 1 and 2 | III and IV | I and II | Postmenopausal | Premenopausal | (+) | (–) | (+) | (–) | (+) | (–) | (+) | (–) | ||
| Duggan et al. [17] | 2014 | - | - | - | - | - | - | - | - | - | - | - | - | - | - |
| Fordyce et al. [18] | 2006 | - | - | 9 (S)/5 (L) | 26 (S)/19 (L) | - | - | 27 (S)/12 (L) | 8 (S)/12 (L) | - | - | - | - | - | - |
| Gay-Bellile et al. [19] | 2016 | - | - | - | - | - | - | - | - | - | - | - | - | - | - |
| Heaphy et al. [20] | 2007 | 90 (S)/14 (L) | 204 (S)/43 (L) | 5 (S)/0 (L) | 428 (S)/84 (L) | 299 (S)/59 (L) | 131 (S)/25 (L) | - | - | 189 (S)/35 (L) | 251 (S)/49 (L) | 373 (S)/71 (L) | 67 (S)/15 (L) | 297 (S)/62 (L) | 144 (S)/23 (L) |
| Lu et al. [21] | 2011 | 144 (S)/23 (L) | 93 (S)/100 (L) | 18 (S)/16 (L) | 149 (S)/146 (L) | - | - | 74 (S)/83 (L) | 94 (S)/79 (L) | - | - | 109 (S)/107 (L) | 59 (S)/56 (L) | 82 (S)/91 (L) | 86 (S)/71 (L) |
| Shen et al. [23] | 2012 | - | - | - | - | 315 (S)/359 (L) | 183 (S)/145 (L) | - | - | 325 (S)/344 (L) | 185 (S)/172 (L) | 254 (S)/253 (L) | 72 (S)/86 (L) | 254 (S)/253 (L) | 72 (S)/86 (L) |
| Simpson et al. [22] | 2015 | - | - | - | - | - | - | - | - | - | - | - | - | - | - |
| Svenson et al. [24] | 2008 | - | - | - | - | - | - | - | - | - | - | - | - | - | - |
| Vodenkova et al. [25] | 2020 | - | - | - | - | - | - | - | - | - | - | - | - | - | - |
S: short telomere length; L: long telomere length; LNM: lymph node metastasis; HER2: human epidermal growth factor receptor 2; ER: estrogen receptor; PR: progesterone receptor
Shorter telomere length was associated with a trend toward worse OS across eight studies. However, the result was not statistically significant (pooled HR: 1.60; 95% CI: 0.90–2.86; P = 0.110) (Figure 2A).
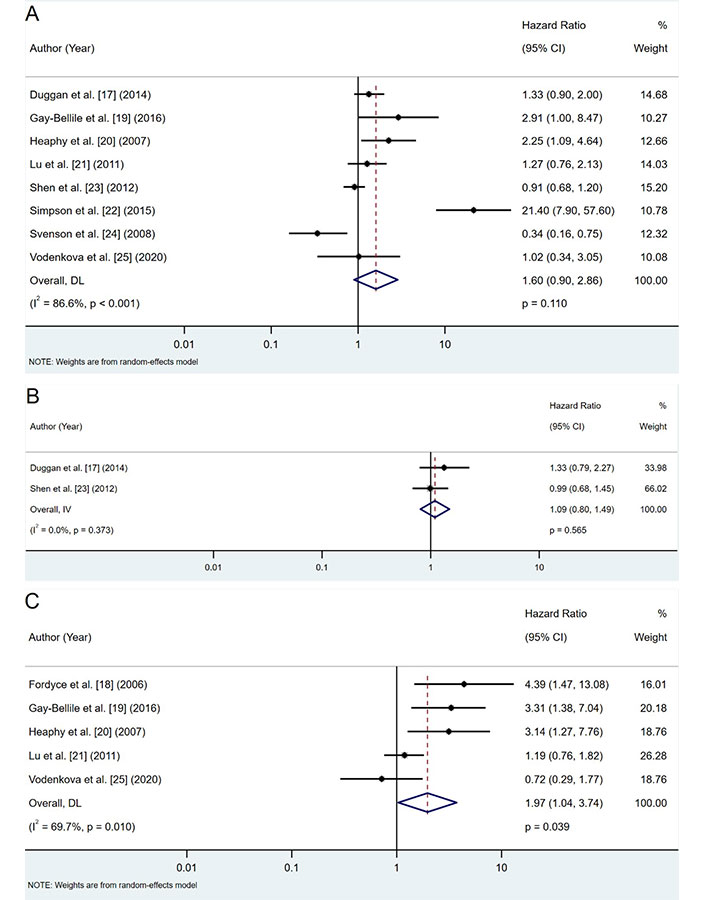
Forest plots of hazard ratios (HRs) for telomere length and survival outcomes. A. OS analysis; B. DSS analysis; C. DFS/RFS analysis. DFS: disease-free survival; DSS: disease-specific survival; OS: overall survival; RFS: recurrence-free survival; CI: confidence intervals
Two studies reported DSS outcomes, showing a non-significant trend toward worse DSS in patients with shorter telomeres (pooled HR: 1.09; 95% CI: 0.80–1.49; P = 0.565) (Figure 2B).
Shorter telomeres were significantly associated with an increased risk of recurrence (pooled HR: 1.97; 95% CI: 1.04–3.74; P = 0.039) across five studies (Figure 2C). This indicates a nearly twofold higher risk of recurrence among patients with shorter telomeres.
Comprehensive subgroup analyses were conducted to further explore the influence of various factors on the association between telomere length and survival outcomes. These analyses, summarized in Figure 3, examined the impact of geographic location, telomere measurement metrics, methods, and sample type.
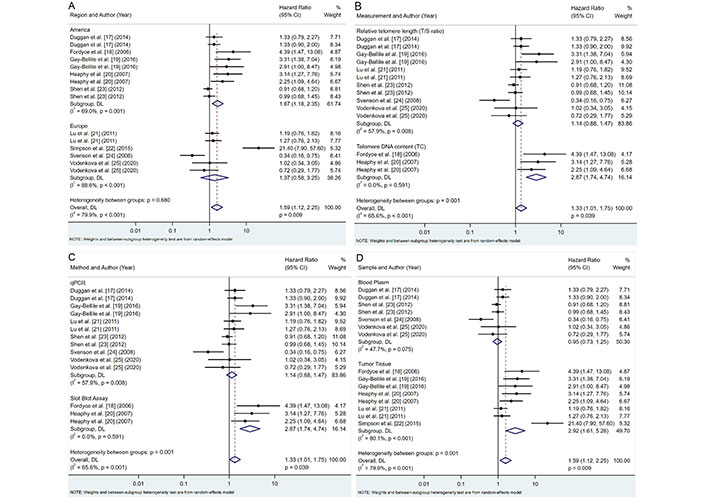
Subgroup analyses of telomere length and survival outcomes. A. Region; B. telomere length measurement metric; C. telomere length measurement method; D. sample type. CI: confidence intervals
Our analysis revealed notable regional differences in the association between telomere length and breast cancer prognosis (Figure 3A). Studies conducted in America showed moderate heterogeneity (I2 = 69.0%, P = 0.001) and a significant association between shorter telomeres and poorer prognosis (pooled HR: 1.67, 95% CI: 1.18–2.35, P = 0.003). In contrast, European studies exhibited high heterogeneity (I2 = 88.6%, P < 0.001) and no significant association (pooled HR: 1.37, 95% CI: 0.58–3.25, P = 0.468). Despite these apparent differences, the variation between regional subgroups was not statistically significant (P = 0.680), suggesting that geographic factors may have a limited impact on the overall conclusions.
The choice of telomere measurement metric significantly influenced the observed associations (Figure 3B). Telomere DNA content (TC) measurements demonstrated stronger associations with poor prognosis (pooled HR: 2.87; 95% CI: 1.74–4.74; P < 0.001) and revealed no heterogeneity (I2 = 0.0%, P = 0.591) compared to RTL [telomere-to-single copy gene ratio (T/S ratio)], which showed no significant association (pooled HR: 1.14; 95% CI: 0.88–1.47; P = 0.332) and moderate heterogeneity (I2 = 57.9%, P = 0.008). These findings underscore the importance of selecting robust and reproducible measurement methods, with TC demonstrating a stronger and more consistent association (P = 0.001).
A different method of measuring telomeres affects the relationship with survival outcomes (Figure 3C). Studies employing quantitative polymerase chain reaction (qPCR) showed moderate heterogeneity (I2 = 57.9%, P = 0.008) and no significant association with prognosis (pooled HR: 1.14, 95% CI: 0.88–1.47, P = 0.332). Meanwhile, the slot blot assay displayed no heterogeneity (I2 = 0.0%, P = 0.591) and a strong association with poor prognosis (pooled HR: 2.87, 95% CI: 1.74–4.74, P < 0.001). The differences between these methodological approaches were statistically significant (P = 0.001), indicating the potential impact of the measurement method on the observed relationships between telomere length and breast cancer prognosis.
The type of biological sample used for telomere length measurement also played a crucial role in the observed association (Figure 3D). Telomere length measured in tumor tissue demonstrated a high heterogeneity (I2 = 80.1%, P < 0.001) and a strong correlation with survival outcomes (pooled HR: 2.92; 95% CI: 1.61–5.28; P < 0.001). In contrast, blood plasma samples showed low heterogeneity (I2 = 47.7%, P = 0.075) and no significant association with prognosis (pooled HR: 0.95, 95% CI: 0.73–1.25, P = 0.734). These results suggest that telomere length measured in tumor tissue is more predictive of survival outcomes than in blood samples, with statistically significant differences between subgroups (P = 0.001).
Our meta-analysis investigated the associations between telomere length and various clinicopathological factors in breast cancer patients. The results of these analyses are summarized in Figure 4 and Table 4, which provide a comprehensive overview of the relationships between telomere length and key tumor characteristics.
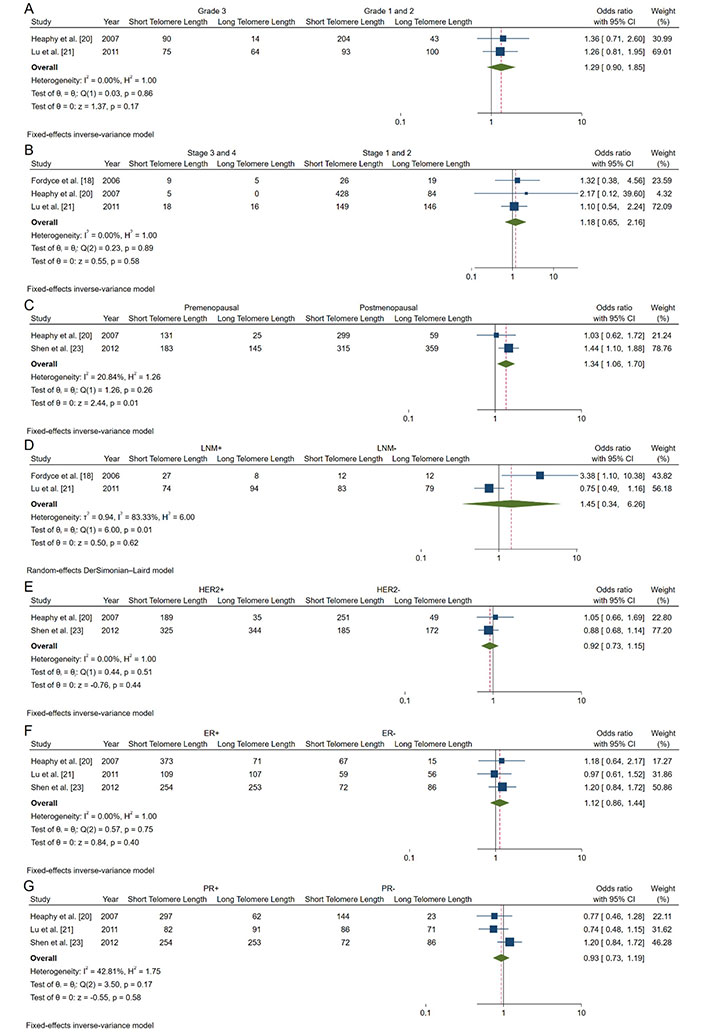
Forest plots of OR analyzing associations between telomere length and clinicopathological characteristics of breast cancer patients. A. Tumor grade; B. tumor stages; C. menopausal status; D. lymph node involvement status; E. HER2 expression; F. estrogen receptor (ER); G. progesterone receptor (PR). HER2: human epidermal growth factor receptor 2; CI: confidence intervals; LNM: lymph node metastasis; OR: odds ratio
Association between telomere length and clinicopathological characteristics of breast cancer patients
| Variable | Studies (n) | Patients (n) | Telomere length | OR (95% CI) | P-value | Heterogeneity | Model | ||
|---|---|---|---|---|---|---|---|---|---|
| Short | Long | I2 (%) | P | ||||||
| Tumor grade (3 vs. 1–2) | 2 | 683 | 165 vs. 297 | 78 vs. 143 | 1.29 (0.90–1.85) | 0.17 | 0 | 0.86 | Fixed |
| Tumor stage (III–IV vs. I–II) | 3 | 905 | 32 vs. 603 | 21 vs. 249 | 1.18 (0.65–2.16) | 0.58 | 0 | 0.89 | Fixed |
| Menopausal status (premenopausal vs. postmenopausal) | 2 | 1,516 | 314 vs. 614 | 170 vs. 418 | 1.34 (1.06–1.70) | 0.01* | 20.84 | 0.26 | Fixed |
| Lymph node metastasis (positive vs. negative) | 2 | 389 | 101 vs. 102 | 95 vs. 91 | 1.45 (0.34–6.26) | 0.62 | 83.33 | 0.01 | Random |
| HER2 (positive vs. negative) | 2 | 1,550 | 514 vs. 436 | 379 vs. 221 | 0.92 (0.73-1.15) | 0.44 | 0 | 0.51 | Fixed |
| ER (positive vs. negative) | 3 | 1,522 | 736 vs. 198 | 431 vs. 157 | 1.12 (0.86–1.44) | 0.40 | 0 | 0.75 | Fixed |
| PR (positive vs. negative) | 3 | 1,521 | 633 vs. 302 | 406 vs. 180 | 0.93 (0.73–1.19) | 0.58 | 42.81 | 0.58 | Fixed |
* Statistically significant. CI: confidence intervals; ER: estrogen receptor; HER2: human epidermal growth factor receptor 2; OR: odds ratio; PR: progesterone receptor
Tumor grade: Our analysis of tumor grade (Grade 3 vs. Grade 1/2) revealed a non-significant association with shorter telomeres (pooled OR: 1.29; 95% CI: 0.90–1.85; P = 0.17) (Figure 4A).
Tumor stage: The association between advanced tumor stage (Stage III/IV vs. Stage I/II) and telomere length was also non-significant (pooled OR: 1.18; 95% CI: 0.65–2.16; P = 0.58) (Figure 4B).
Menopausal status: We found a significant association between shorter telomeres and premenopausal status (pooled OR: 1.34; 95% CI: 1.06–1.70; P = 0.01) (Figure 4C). This finding suggests that premenopausal breast cancer patients may be more likely to exhibit shorter telomeres, potentially indicating more aggressive tumor biology.
Lymph node involvement: The analysis of lymph node involvement showed a non-significant association with shorter telomeres (pooled OR: 1.45; 95% CI: 0.34–6.26; P = 0.62) (Figure 4D).
HER2 status (Figure 4E): Our analysis found no significant association between HER2 status and telomere length (pooled OR: 0.92; 95% CI: 0.73–1.15; P = 0.44) (Figure 4E).
ER: The association between ER positivity and telomere length was non-significant (pooled OR: 1.12; 95% CI: 0.86–1.44, P = 0.40) (Figure 4F).
PR: PR status showed no significant association with telomere length (pooled OR: 0.93; 95% CI: 0.73–1.19; P = 0.58) (Figure 4G).
Publication bias was evaluated using funnel plots and Egger’s and Begg’s tests. The funnel plot (Figure 5) did not indicate significant asymmetry, suggesting no substantial publication bias. Additionally, Egger’s and Begg’s tests (Table 5) showed non-significant results for OS (Egger’s test: 0.1941; Begg’s test: 0.7105) and DFS/RFS (Egger’s test: 0.3944; Begg’s test: 0.2207). However, the limited number of studies warrants cautious interpretation. Sensitivity analysis confirmed that no study disproportionately influenced the results (Figure 6).
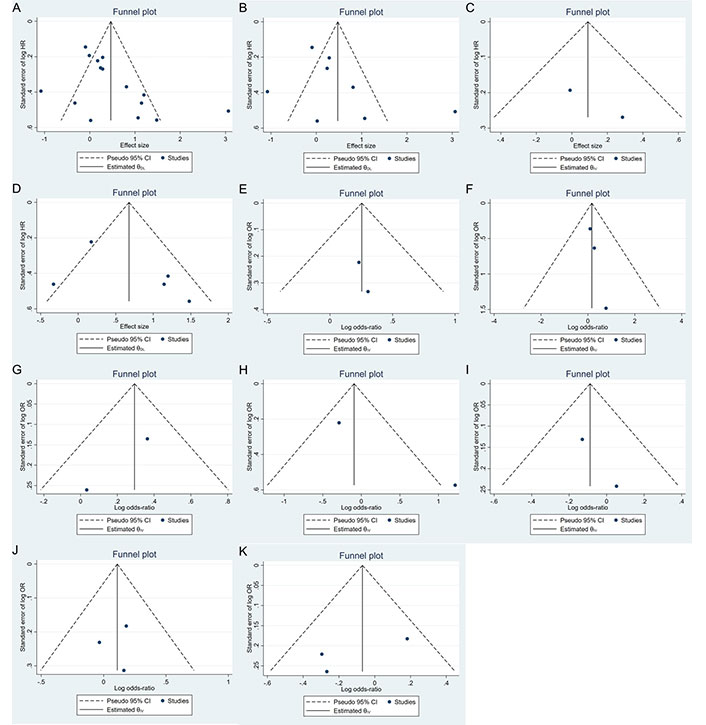
Funnel plot for assessing publication bias in studies of telomere length and breast cancer prognosis. A. Survival outcomes; B. OS; C. DSS; D. DFS/RFS; E. histopathology; F. tumor stage; G. menopausal status; H. lymph node metastasis; I. HER2; J. ER; K. PR. DFS: disease-free survival; DSS: disease-specific survival; ER: estrogen receptor; HER2: human epidermal growth factor receptor 2; OS: overall survival; PR: progesterone receptor; RFS: recurrence-free survival; HR: hazard ratio; OR: odds ratio; CI: confidence intervals
Egger’s and Begg’s test results for publication bias
| Variable | Egger’s test (P > |t|) | Begg’s test (P > |z|) |
|---|---|---|
| Survival outcomes | 0.0264 | 0.0600 |
| OS | 0.1941 | 0.7105 |
| DSS | N/A | N/A |
| DFS/RFS | 0.3944 | 0.2207 |
| Tumor grade | N/A | N/A |
| Tumor stage | 0.7137 | 0.2963 |
| Menopausal status | N/A | N/A |
| LNM | N/A | N/A |
| HER2 | 0.5094 | N/A |
| ER | 0.8970 | 1.0000 |
| PR | 0.3570 | 1.0000 |
N/A: not available; DFS: disease-free survival; DSS: disease-specific survival; ER: estrogen receptor; HER2: human epidermal growth factor receptor 2; LNM: lymph node metastasis; OS: overall survival; PR: progesterone receptor; RFS: recurrence-free survival
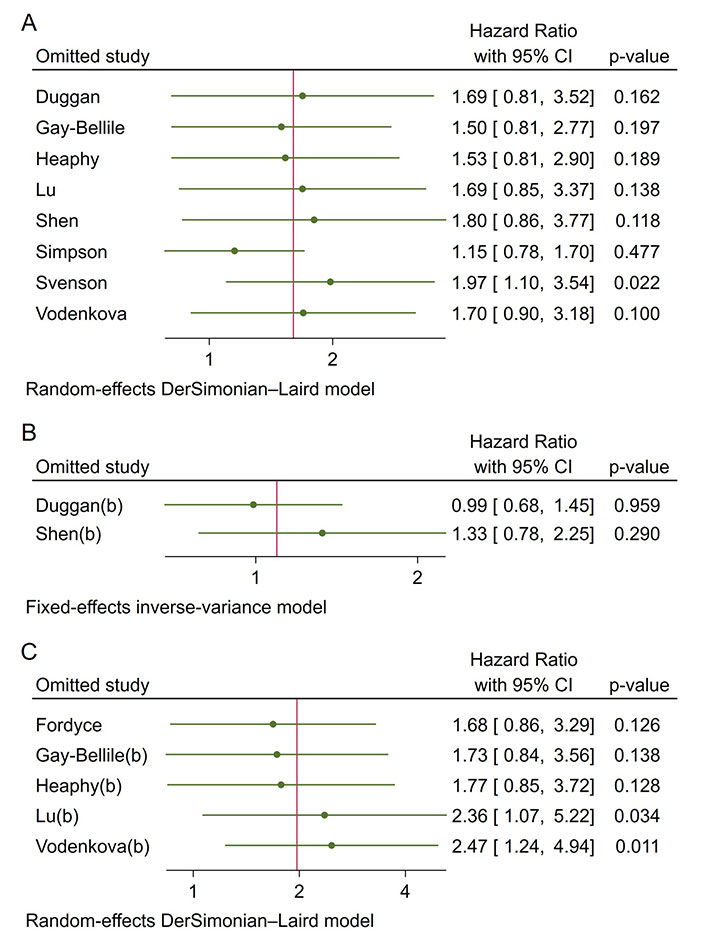
Sensitivity analysis for pooled hazard ratios. A. OS; B. DSS; C. DFS/RFS. DFS: disease-free survival; DSS: disease-specific survival; OS: overall survival; RFS: recurrence-free survival; CI: confidence intervals
This meta-analysis provides a comprehensive evaluation of telomere length as a prognostic biomarker for survival outcomes in breast cancer, specifically focusing on OS, DSS, DFS, and RFS. Our findings indicate that shorter telomere length is significantly associated with increased recurrence risk (DFS/RFS) (pooled HR: 1.97; 95% CI: 1.04–3.74; P = 0.039), indicating a nearly twofold increase in recurrence risk for patients with shorter telomeres. While trends toward worse OS (pooled HR: 1.60; 95% CI: 0.90–2.86, P = 0.110) and DSS (pooled HR: 1.09; 95% CI: 0.80–1.49, P = 0.565) were observed for shorter telomeres, these associations did not reach statistical significance. These findings reinforce the emerging role of telomere length as a valuable prognostic marker in breast cancer, with shorter telomeres linked to poorer outcomes and altered telomerase activity, further emphasizing the role of telomere dynamics in disease progression [35, 36].
Telomere shortening affects genomic stability and promotes cancer recurrence by increasing chromosomal instability, activating oncogenes, and inactivating tumor suppressor genes [10, 37]. This instability accelerates cell proliferation and malignant transformation, contributing to higher recurrence rates after treatment [10, 37]. While telomere shortening can trigger cell cycle arrest as a protective mechanism against tumorigenesis, senescent cells can also create a pro-tumorigenic microenvironment. Through the senescence-associated secretory phenotype (SASP), these cells promote inflammation and alter the tissue microenvironment, further influencing recurrence [38]. The role of telomere shortening in genomic instability likely explains the higher recurrence rates observed in patients with shorter telomeres [18–21], although one study reports differing results [25]. These inconsistencies may arise from variations in telomere measurement techniques, sample types, and patient characteristics.
Subgroup analyses revealed important insights regarding the influence of telomere measurement methods. TC showed stronger associations with prognosis (pooled HR: 2.87; 95% CI: 1.74–4.74; P < 0.001) than RTL (T/S ratio). The slot blot assay also demonstrated a stronger correlation with poor prognosis (pooled HR: 2.87, 95% CI: 1.74–4.74, P < 0.001) compared to qPCR. Southern blotting remains the most accurate and reliable method for precise telomere length measurement. While qPCR is faster, it is less precise and may not capture specific telomere dynamics, such as the shortest telomeres or sub-telomeric regions, highlighting the need for caution when using qPCR, especially in longitudinal studies [39, 40]. These findings underscore the importance of telomere measurement methodology and suggest that absolute telomere length measurements could be more informative for prognostic purposes [41].
Moreover, telomere length measured in tumor tissue exhibited a stronger association with survival outcomes (pooled HR: 2.92; 95% CI: 1.61–5.28; P < 0.001) than measurements from blood plasma samples. Telomere shortening is more pronounced in tumor tissues than in adjacent non-cancerous tissues, reflecting cancer-specific dynamics more accurately than plasma telomeric cfDNA, which may be influenced by systemic factors [42, 43]. Tumor tissue telomeres are typically shorter due to the high proliferative activity and genomic instability of cancer cells, emphasizing the importance of tissue-specific telomere dynamics [43, 44]. While liquid biopsy methods, such as plasma cfDNA are non-invasive, they may miss localized telomere changes seen in tumor tissues, which offer a more accurate reflection of the tumor microenvironment [43]. This highlights the need to carefully consider sample types in future studies and clinical applications.
The geographic variability observed in our analysis, with American studies showing a significant association between shorter telomeres and poorer prognosis (pooled HR: 1.67, 95% CI: 1.18–2.35, P = 0.003), while European studies did not, warrants further investigation. This discrepancy may stem from genetic variation, geographic factors, and socioeconomic conditions that influence cancer risk and prognosis [45, 46]. These findings emphasize the importance of considering regional variations in telomere biology research.
Additionally, the association between shorter telomeres and premenopausal status (pooled OR: 1.34, 95% CI: 1.06–1.70, P = 0.01), suggests that telomere length may be particularly relevant for younger breast cancer patients. A case-control study in a Chinese Han population found a significant link between shorter telomeres and increased breast cancer risk, supporting the role of telomere length as a potential biomarker for breast cancer susceptibility in premenopausal women [47]. Furthermore, research on prediagnostic leukocyte telomere length has demonstrated an association with breast cancer risk, reinforcing the importance of telomere length as an indicator for premenopausal breast cancer [48]. Another study highlighted that shorter RTL was associated with increased breast cancer risk, although it primarily focused on postmenopausal women. These findings collectively broaden the context, reinforcing the relevance of telomere length as a potential biomarker for breast cancer risk across different populations [49]. Future studies should focus on validating telomere length as a prognostic marker, particularly in this high-risk subgroup.
Our analysis confirms the significant association between shorter telomere length and poorer survival outcomes in breast cancer patients. Telomere dysfunction, which leads to genomic instability by impairing DNA repair mechanisms, increasing oxidative stress, and promoting chromosomal fusions, has been widely recognized as a critical factor in cancer progression [7–9, 50]. This instability can contribute to tumor growth and recurrence, aligning with our findings that shorter telomeres correlate with worse DFS and RFS.
While the mechanisms underlying telomere dysfunction are well understood, the clinical utility of telomere length as a biomarker remains limited due to variability in measurement techniques. Studies have shown that the lack of standardized telomere measurement protocols is a key barrier to its widespread clinical application [26]. This underscores the need for future research to address these challenges and establish standardized protocols to enhance the reliability and applicability of telomere length as a prognostic biomarker for breast cancer.
The relationship between telomere dysfunction and BRCA2 mutations also warrants further exploration. Since BRCA2 mutations impair DNA repair mechanisms, telomere shortening may play a particularly critical role in increasing the risk of cancer progression in patients with this genetic predisposition [27]. This could potentially open up opportunities for using telomere length as an additional marker for identifying high-risk breast cancer patients, particularly those with hereditary breast cancer linked to BRCA mutations.
Despite its strengths, this meta-analysis has limitations. The small number of included studies reduces the generalizability of the findings and limits the statistical power of subgroup analyses, particularly for DSS and certain clinicopathological characteristics. The reliance on retrospective data may introduce selection bias, and the precision of HRs estimated from Kaplan-Meier curves is inherently limited compared to directly reported values [29]. Furthermore, while no significant publication bias was detected, the small sample size warrants cautious interpretation of these results.
In conclusion, our meta-analysis provides evidence for the potential of telomere length as a prognostic biomarker in breast cancer, particularly for predicting recurrence risk. The prognostic value of telomere length appears to be influenced by measurement method and sample type, highlighting the need for standardization. While challenges remain in translating these findings into clinical practice, the integration of telomere biology into personalized medicine approaches holds promise for improving breast cancer management. Future research should focus on addressing methodological inconsistencies, exploring telomere-based therapies, and validating the clinical utility of telomere length measurements in large-scale, prospective studies.
CI: confidence intervals
DFS: disease-free survival
DSS: disease-specific survival
ER: estrogen receptor
HER2: human epidermal growth factor receptor 2
HRs: hazard ratios
LNM: lymph node metastasis
NOS: Newcastle-Ottawa Scale
OR: odds ratio
OS: overall survival
PR: progesterone receptor
PRISMA-P: Preferred Reporting Items for Systematic Reviews and Meta-Analysis Protocols
PROSPERO: International Prospective Register of Systematic Reviews
qPCR: quantitative polymerase chain reaction
RFS: recurrence-free survival
RTL: relative telomere length
T/S ratio: telomere-to-single copy gene ratio
TC: telomere DNA content
TNBC: triple-negative breast cancer
The supplementary material for this article is available at: https://www.explorationpub.com/uploads/Article/file/1002289_sup_1.pdf.
DMAS and KGP: Conceptualization, Data curation, Writing—original draft, Writing—review & editing. TA, DSH, and SLA: Supervision, Validation. All authors provided feedback and approved the final version of the manuscript.
The authors declare that they have no conflicts of interest.
Ethical approval was not required as this study involved the secondary analysis of published data without direct patient interaction.
Consent to participate was not required as this study involved the secondary analysis of published data without direct patient interaction.
Not applicable.
All data generated or analyzed for this study are included in the manuscript and the supplementary files.
Not applicable.
© The Author(s) 2025.
Open Exploration maintains a neutral stance on jurisdictional claims in published institutional affiliations and maps. All opinions expressed in this article are the personal views of the author(s) and do not represent the stance of the editorial team or the publisher.
Copyright: © The Author(s) 2025. This is an Open Access article licensed under a Creative Commons Attribution 4.0 International License (https://creativecommons.org/licenses/by/4.0/), which permits unrestricted use, sharing, adaptation, distribution and reproduction in any medium or format, for any purpose, even commercially, as long as you give appropriate credit to the original author(s) and the source, provide a link to the Creative Commons license, and indicate if changes were made.