Abstract
In Europe, allergen products from different manufacturers can be labeled using the same unit with yet different definitions of that unit, which may cause confusion, as is the case for the index of reactivity (IR). In this context, house dust mite (HDM) Staloral 300 IR/mL, from Stallergenes Greer, and HDM Osiris 300 IR/mL, from ALK-Abelló, were characterized in vitro. Qualitatively, namely in terms of protein and allergen profiles, the two products were similar. Quantitatively, and despite the same 300 IR/mL labeling, the two products were shown to have different biological potencies, with HDM Staloral 300 IR/mL displaying a 2.4 times higher total allergenic activity (TAA) than HDM Osiris 300 IR/mL. This higher biological potency of HDM Staloral 300 IR/mL was paralleled by higher allergen and protein contents, namely 1.5 times more Der p 1 and Der f 1, 3.0 times more group 2 allergens, 2.7 times more Der p 23, and 1.8 times more protein. In contrast, HDM Staloral 300 IR/mL was shown to contain far fewer culture medium-derived proteins than HDM Osiris 300 IR/mL.
Keywords
Allergen extract, allergen immunotherapy, standardization, unit definitionContext and objective
Allergen immunotherapy (AIT) is the only approach recognized as treating the cause of immunoglobulin E (IgE)-mediated allergies [1]. It consists of the repeated administration of high doses of the causative allergens for a few years, mainly through the subcutaneous or sublingual route [2]. Standardization of allergen products is critical to ensure the safety and efficacy of AIT [3]. The way they are standardized depends on the geographic area. In the United States, the Center for Biologics Evaluation and Research at the US Food and Drug Administration (CBER/FDA) makes reference standard reagents available to all manufacturers of allergen extracts, so that they can standardize them using the same unit, e.g., allergy unit (AU) for mite allergen extracts, with a unique definition for that unit [4]. In Europe, every manufacturer develops its own standardization system, with its own unit definition [3]. It is possible for two or more European companies to use the same unit name with yet different definitions, as is in fact the case for the index of reactivity (IR), used by both ALK-Abelló in France and Stallergenes Greer worldwide (which, to our knowledge, is however a unique case in Europe). According to Stallergenes Greer’s definition, 100 IR/mL indeed corresponds to a concentration that induces a mean wheal diameter of 7 mm when applied by skin prick testing to allergic patients, whereas according to ALK-Abelló’s definition, it corresponds to a mean wheal diameter of 6 mm [5]. It is, however, tempting to consider that products from different companies but with the same labeling, e.g., 300 IR/mL, display the same biological potency. Hence it is important to determine whether such temptation is founded or not.
In such a context, this study aimed to characterize house dust mite (HDM) Staloral 300 IR/mL and HDM Osiris 300 IR/mL in terms of biological potency, but also in terms of concentrations of major HDM allergens, namely group 1, group 2, and group 23 allergens [6], as well as of protein content, protein profiles, and allergen profiles. As a reminder, the maintenance dose recommended for both products is 1 mL daily.
Materials and methods
Three batches of HDM Staloral “DPTE/DFAR 50/50” 300 IR/mL and three batches of Osiris “Acariens mix 100%” 300 IR/mL liquid extracts were analyzed. Two batches of Orylmyte 300 IR and two batches of Acarizax 12 standardised quality-HDM (SQ-HDM) tablets were also analyzed.
Total allergenic activity (TAA) was assayed based on the inhibition of IgE binding in enzyme-linked immunosorbent assay (ELISA), in comparison to an in-house reference extract, as described elsewhere [7]. Protein content was determined using the Kjeldahl method [8]. Der p 1 (EPC-DP1-25), Der f 1 (EPC-DF1-25), and Der p 23 (EPC-DP23-25) concentrations were obtained using commercially available ELISA kits (Indoor Biotechnologies, Charlottesville, VA, USA) essentially according to the manufacturer’s instructions. The concentration of group 2 allergens (Der p 2 + Der f 2) was determined using mass spectrometry (MS), as previously described [9]. The protein profiles were obtained using non-reducing sodium dodecyl sulfate-polyacrylamide gel electrophoresis (SDS-PAGE) followed by SYPRO Ruby staining, and the allergen profiles were obtained by both western blotting and liquid chromatography coupled to tandem MS (LC-MS/MS). LC-MS/MS was also used to detect non-mite proteins in the extracts. Further details on the methods used are provided in Supplementary materials and Table S1.
Results
To check the suitability of the methods used for measuring TAA, as well as group 1 and group 2 allergen concentrations, those methods were applied to two batches of Orylmyte 300 IR (Stallergenes Greer), as compared to two batches of Acarizax 12 SQ-HDM (ALK-Abelló). As shown by Table 1, the resulting ratios between the two products were of the same order of magnitude as the ratios deduced from the literature [10], so that the methods used can be considered quite suitable for the purpose of this study.
Biological potency and contents in group 1 and group 2 allergen of two batches of Orylmyte 300 IR and two batches of Acarizax 12 SQ-HDM, and the corresponding ratios as compared to ratios obtainable from literature
| Product | Orylmyte 300 IR | Acarizax 12 SQ-HDM | Ratio between Orylmyte 300 IR and Acarizax 12 SQ-HDM obtained from this study | Ratio between Orylmyte 300 IR and Acarizax 12 SQ-HDM obtained from literature* | ||||
|---|---|---|---|---|---|---|---|---|
| 2028296281 (batch number) | 2028373615 (batch number) | Mean | 4306178 (batch number) | 4306183 (batch number) | Mean | |||
| Biological potency (IR/tablet) | 292 | 296 | 294 | 110 | 107 | 109 | 2.7 | 2.9 |
| Der p 1 (µg/tablet) | 11.5 | 12.5 | 12.0 | 4.6 | 4.1 | 4.4 | 2.8 | 2.2 |
| Der f 1 (µg/tablet) | 43.1 | 44.5 | 43.8 | 8.2 | 9.5 | 8.9 | 4.9 | 5.1 |
| Der p 2 + Der f 2 (µg/tablet) | 8.5 | 7.1 | 7.8 | 6.8 | 7.0 | 6.9 | 1.1 | 0.9 |
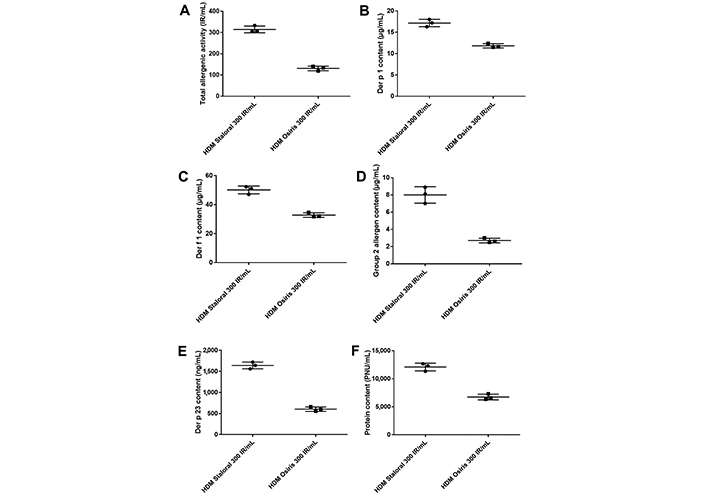
Although the labeling of HDM Staloral and Osiris is the same, namely 300 IR/mL, the measured TAA was 2.4 times higher in HDM Staloral than in HDM Osiris (Table S2 and Figure 1A), when compared using the same analytical method. The higher biological potency of HDM Staloral 300 IR/mL was paralleled by higher allergen and protein contents, namely 1.5 time more Der p 1 and Der f 1, 3.0 times more group 2 allergens, 2.7 times more Der p 23, and 1.8 more time proteins (Table S2 and Figure 1B–F), again, when using the same analytical methods. Of note, Der p 1 and Der p 23 are especially important, since IgE specific to those allergens are associated with asthma [6, 12, 13]. Besides, HDM Staloral 300 IR/mL displays a slightly better, namely a 1.3-time higher specific activity, defined as (TAA/protein content) × 1,000 (Table S2).

Total allergenic activity, concentrations of Der p 1, Der f 1, group 2 allergens and Der p 23, and protein content in three batches of HDM Staloral 300 IR/mL and three batches of HDM Osiris 300 IR/mL. (A) TAA; contents in (B) Der p 1; (C) Der f 1; (D) group 2 allergens; (E) Der p 23; and (F) protein in three batches of HDM Staloral 300 IR/mL and three batches of HDM Osiris 300 IR/mL. Bars represent the means with standard deviations
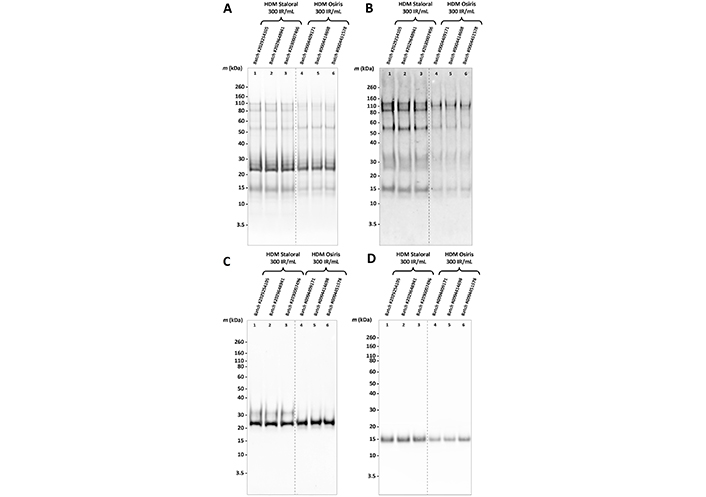
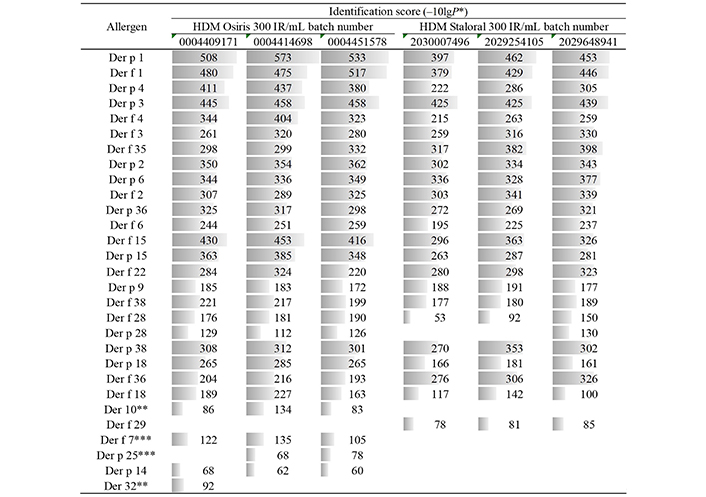
Qualitatively, the two products looked the same, as shown by the protein profiles obtained by SDS-PAGE (Figure 2A), and the allergen profiles obtained by western blotting (Figure 2B–D) or LC-MS/MS (Figure 3). Peptides derived from Dermatophagoides pteronyssinus and D. farinae allergens of groups 1, 2, 3, 4, 6, 15, 18, 36, and 38 allergens, as well as from Der p 9, Der f 22, Der f 28, and Der f 35, were found in all tested batches of HDM Staloral and Osiris (Figure 3). Peptides derived from Der p 28 were found in the three batches of HDM Osiris and one batch of HDM Staloral (Figure 3). Der f 29-derived peptides were found in the three batches of HDM Staloral but in no batch of HDM Osiris, while D. pteronyssinus and/or D. farinae group 7, group 10, group 25, group 32 allergens, as well as Der p 14, were found in one or more batches of HDM Osiris but not in HDM Staloral (Figure 3). Almost all the allergens found in one product and not the other were identified with rather low identification scores (Figure 3). It is worth stressing that not all the allergens officially recognized by the World Health Organization (WHO)/International Union of Immunological Societies (IUIS; see www.allergen.org) were detected by LC-MS/MS, and/or detected in all tested batches, especially Der p 23, which was yet quantifiable by ELISA (Table S2). This can be explained by the detectability of peptides in complex samples being especially sensitive to their physicochemical properties, including their sequence specificities and their abilities to be ionized, which are highly peptide-dependent [14].

Protein and allergen profiles of three batches of HDM Osiris 300 IR/mL and three batches of HDM Staloral 300 IR/mL. (A) Protein profiles; (B) allergen profiles after detection using a pool of sera from HDM-sensitized patients; (C) monoclonal antibody (mAb) of clone number KORI75 to group 1 allergens; or (D) mAb of clone KORI25 to group 2 allergens, of three batches of HDM Staloral 300 IR/mL and three batches of HDM Osiris 300 IR/mL. m: molecular mass

Allergen profiles of three batches of HDM Osiris 300 IR/mL and three batches of HDM Staloral 300 IR/mL, as obtained by LC-MS/MS. *: –10 × log10(P-value); grey bars are proportional to the corresponding identification scores; **: no species-specific peptide was detected; ***: no species-specific peptide was detected for Der p 7 and Der f 25
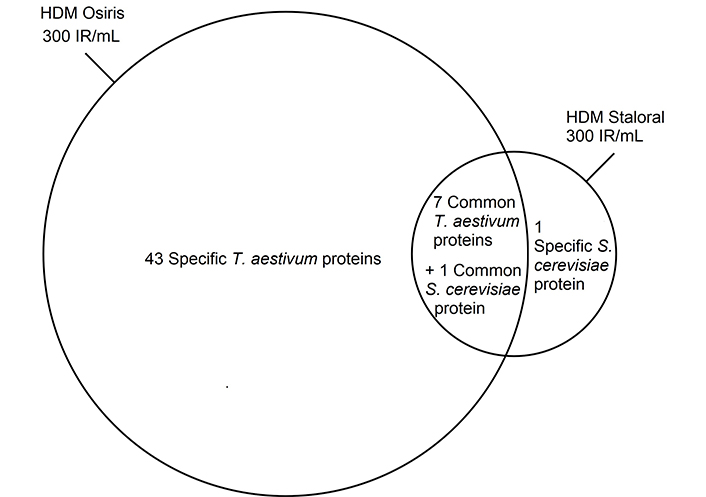
The LC-MS/MS analysis also allowed to identify proteins originating from the culture medium, namely from the wheat Triticum aestivum and the yeast Saccharomyces cerevisiae (Figure 4), which are commonly used for growing HDMs [15]. Over five times more culture medium-derived proteins were found in HDM Osiris 300 IR/mL than in HDM Staloral 300 IR/mL (Figure 4). This suggests a more thorough consumption of the culture medium by the mites in the case of HDM Staloral than in the case of HDM Osiris. Furthermore, this might explain why the specific activity of HDM Staloral is slightly higher than that of HDM Osiris (Table S2), although it is not very likely that the proteins found specifically in HDM Osiris be present in critical amounts in that product, given the similarity of its protein profile with that of HDM Staloral (Figure 1A). Importantly, no allergen could be identified among the detected wheat and yeast proteins.

Culture medium-derived proteins found in one or more batches of HDM Staloral and Osiris 300 IR/mL
Conclusions
Qualitatively speaking, i.e. in terms of protein and allergen profiles, and save for the number of culture medium-derived proteins (Figure 4), HDM Staloral and Osiris 300 IR/mL look similar (Figures 2 and 3). On the other hand, the two products do not display the same biological potency in vitro (Table S2 and Figure 1). This was entirely expected since their labelings in IR/mL rely upon two different definitions of IR. On this basis, and because the biological potency correlates more or less with the concentrations of major allergens [3], the fact that HDM Staloral and Osiris 300 IR/mL contained differing amounts of these (Table S2 and Figure 1) was also expected.
This study partly involved in-house methods, which might be seen as a possible limitation. This limitation was overcome by benchmarking some of the used methods against independently published data (Table 1).
In a nutshell, HDM Staloral 300 IR/mL and HDM Osiris 300 IR/mL are qualitatively similar products, but they differ quantitatively in terms of biological potency and levels of major allergens.
Abbreviations
| ELISA: |
enzyme-linked immunosorbent assay |
| HDM: |
house dust mite |
| IgE: |
immunoglobulin E |
| IR: |
index of reactivity |
| LC-MS/MS: |
liquid chromatography coupled to tandem mass spectrometry |
| SQ-HDM: |
standardised quality-house dust mite |
| TAA: |
total allergenic activity |
Supplementary materials
The supplementary material for this article is available at: https://www.explorationpub.com/uploads/Article/file/100912_sup_1.pdf.
Declarations
Author contributions
TB and LM: Conceptualization, Writing—original draft. SD, MR, KJ, CP, and MD: Formal analysis. SV: Supervision. HC and CD: Supervision, Writing—review & editing.
Conflicts of interest
All authors are employees of Stallergenes Greer, Antony, France.
Ethical approval
Individual sera constituting the pool, used as a reagent, come from blood donation at the French Blood Establishment (EFS) holding an Ethics and Professional conduct committee as per the decision n° 2019-05.
Consent to participate
Informed consent to participate in the study was obtained from all participants.
Consent to publication
Not applicable.
Availability of data and materials
The data supporting our findings will not be shared because they are proprietary.
Funding
Not applicable.
Copyright
© The Author(s) 2023.