 Original Article

Affiliation:
Department of Physics, University of Zanjan, Zanjan 4537138791, Iran
Email: nadjari@znu.ac.ir
ORCID: https://orcid.org/0000-0001-6971-5694
Affiliation:
Department of Physics, University of Zanjan, Zanjan 4537138791, Iran
ORCID: https://orcid.org/0000-0002-9490-1066
Explor BioMat-X. 2024;1:289–299 DOI: https://doi.org/10.37349/ebmx.2024.00021
Received: June 29, 2024 Accepted: September 23, 2024 Published: October 22, 2024
Academic Editor: Mohammad Tavakkoli Yaraki, Macquarie University, Australia
The article belongs to the special issue Plasmonic Nanostructures for Designing Optical Biosensors
Aim: Synthesis of plasmonic nanoparticles, characterization, size detection by modeling.
Methods: Colloidal plasmonic gold and silver nanoparticles were prepared by laser ablation with a 1,064 nm pulsed Nd:YAG laser with equal fractional volume and then were illuminated with its 532 nm second harmonic pulse. After the illumination process, we observed 1 nm blue shift in peak position of gold colloid and 4 nm blue shift in silver colloid. We observed a variation in the dielectric function due to nanoparticle size reduction in both samples. Using micrograph, size distribution was plotted and with the help of Mie theory and size dependent dielectric function, we reconstructed absorption spectrum to best fit the experimental spectrum and we estimated 12- and 16-fold increase in the number of Au and Ag nanoparticles respectively, due to illumination.
Results: We have estimated size distribution of produced nanoparticles.
Conclusions: We produced silver and gold colloids with ablation of their foils in water without any surfactant, and then we fragmented the nanoparticles colloids with an intense nanosecond laser and studied the effect of illumination on peak position and size distribution of colloids.
Nanocolloids have attracted much attention during recent years because of their size and shape dependent properties, which are different from bulk materials. Both chemical and physical techniques have been previously used for the preparation of Ag and Au nanoparticles in liquids [1–3]. These techniques can be distinguished from each other through their unlike nanoparticle size distributions. The analysis of optical properties of silver and gold colloids have been presented by different authors [4, 5].
The Mie theory predicts the position of the plasmon peak of colloids using scattering theory. The location of surface plasmon resonance (SPR) of silver and gold colloids depends on dielectric constant and the preparation condition. The absorbance depends on the concentration, material and size of the ablated nanoparticles [6]. Laser illumination has many effects on nanocolloids such as size redistribution and peak shift along the absorption spectrum. The famous mechanism for size reduction is the charge accumulation on the surface of nanoparticles and exploitation at the final stage. Another mechanism for size reduction is heating of nanoparticles up to the melting and/or boiling point due to high laser power illuminating them in a pulse duration [4–7].
In the size range from 10 to 100 nm, the quasi-static approximation does not hold, and extrinsic size effects due to the retardation of the fields across the cluster come into play. The limited applicability of bulk optical constants to small particles was critically reviewed by Bohren and Huffman [8]. The dielectric function of nanoparticles depends on the average over microscopic polarizabilities, changes in clusters due to the limited volume for averaging, the existence of the surfaces, inhomogeneity of the charge densities, local polarizabilities and size distribution that generally means, changes of the electronic and the atomic structure across the cluster, cause to displacement of SPR. Size dependent dielectric functions were investigated previously [9, 10]. In this research, our samples are produced by laser ablation and then illuminated by a pulsed laser producing nanoparticles with diameters falling in the range 2 to 65 nm which is very large distribution. Under this condition, reconstruction of the UV spectrum with appropriate dielectric function is possible. Finally, we studied the sensitivity of gold and silver absorbance spectrum to size distribution and estimated the total number of nanoparticles in each sample before and after illumination.
The experimental arrangement for laser ablation has been reported earlier [11]. As in Figure 1 we used the active Q-Switched Nd:YAG laser system with repetition rate of 1–20 Hz, 20 ns pulse width and output energy range 10–20 mJ.
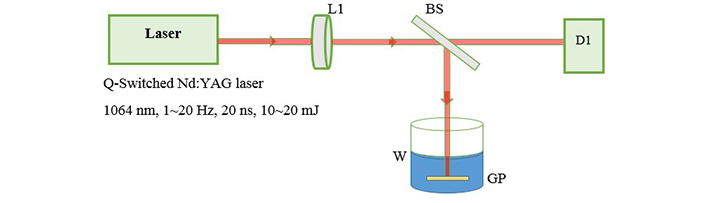
Experimental setup for laser ablation. L1: focusing lens; BS: beam splitter; D1: detector; W: deionized water; GP: gold or silver plate
The fundamental output of Nd:YAG laser (1,064 nm) is used for ablation of metal foils and a 25 cm focusing lens is used to produce a flounce of about 5 J/cm2. Then we transfered 4 mL of each sample into a quartz cell with a length of 1 cm to start illumination. Figure 2 shows the setup for illumination in which second harmonic of Nd:YAG laser (532 nm) is used as an irradiation source of illumination. The preparation is carried out in open-air (aerobic) condition. The absorption spectrum of the samples is recorded with a spectrophotometer Hitachi U-3410. For TEM (transmission electron microscope) images, a small drop of the colloids is transferred onto a copper mesh grid covered by a carbon film and let to dry. TEM, a Philips EM 2085, 100 kV accelerating voltage, is employed to take the electron micrographs of the resultant nanoparticles.
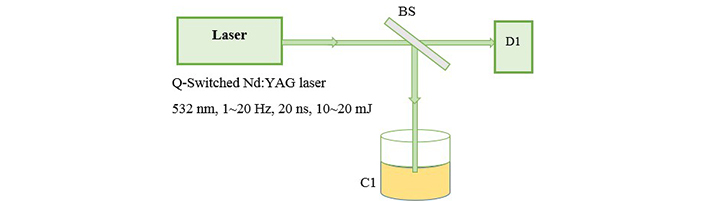
Experimental setup for illumination. BS: beam splitter; D1: detector; C1: prepared nanocolloid
After ablation the weight loss of Au and Ag plate is measured to be 1 and 0.6 mg respectively. Regarding density of the metals, these values in 10 mL of pure water produce fractional volume of 5.7 × 10⁻⁶ for Ag and 5.2 × 10⁻⁶ for Au colloid; the fractional volumes are approximately equal. Because filling factor of the samples is very small, then we consider clusters, as separated single particles in full statistical disorder so, interaction of clusters has not any rule in absorption cross section. Figure 3 shows the TEM images for gold nanocolloid and related histogram and Figure 4 shows corresponding images for silver nanocolloid. We obtain the average diameter of nanoparticles by directly counting the number of nanoparticles insight on a given micrograph and measuring their diameter. Mean diameter of the gold nanoparticles is 40.30 nm and 18.10 nm before and after illumination respectively. Mean diameter of the silver nanoparticles is 18.68 nm and 8.08 nm before and after illumination respectively.
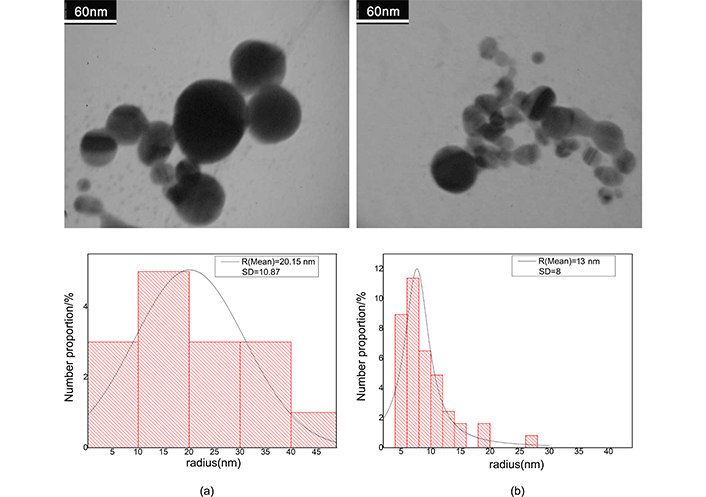
The electron micrograph of gold nanocolloid and related histogram. a) After ablation; b) after illumination. Adapted from [17], 2020, CC BY-NC 4.0
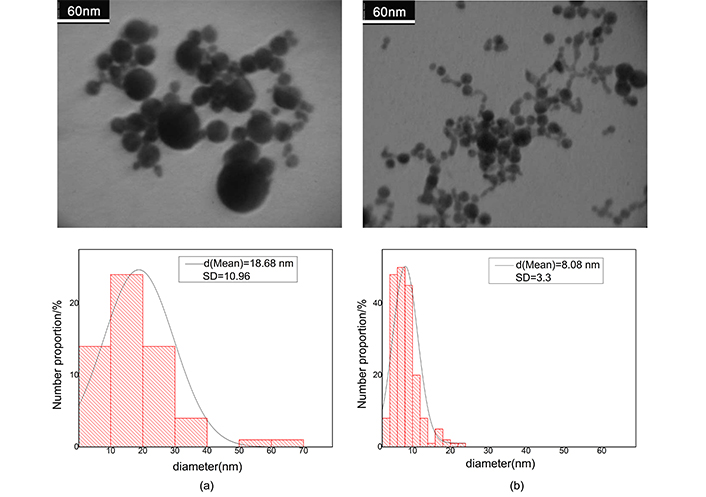
The electron micrograph of silver nanocolloid and related histogram. a) After ablation; b) after illumination. In histograms vertical axis refers to total fractional number of nanoparticles. Contrast is the difference between the magnitude of absorption at the peak and the valley divided by the magnitude of absorption at the peak
In extinction spectroscopy, a valuable parameter for investigation of size distribution is contrast, which is defined as the difference between the magnitude of absorbance at the peak and the valley divided by the magnitude of absorbance at the peak. Our data show that the contrast of Ag1 (after ablation) and Ag2 (after illumination) samples is equal to 90% and 91% respectively; which means that the contrast has increased by 1% due to illumination [12]. Our data for gold colloid show that the contrast of Au1 (after ablation) and Au2 (after illumination) are equal to 40% and 33% respectively, i.e., there is a 7% decrease due to illumination.
Silver nanoparticles become charged when the sample is subjected to laser pulses. Once nanoparticles accumulate sufficient charges, they may break up to form smaller nanoparticles [7].
The absorption spectra of colloidal samples are shown in Figure 5. The plasmon peak position of Au1 is located at 522 nm which after illumination is blue shifted to 523 nm and for Ag1 sample plasmon peak position is blue shifted from 412 to 408 nm after illumination. Ag and Au nanoparticles plasmon peak position have 4 and 1 nm blue shift respectively, but behavior of their absorbance in illumination process is opposite.
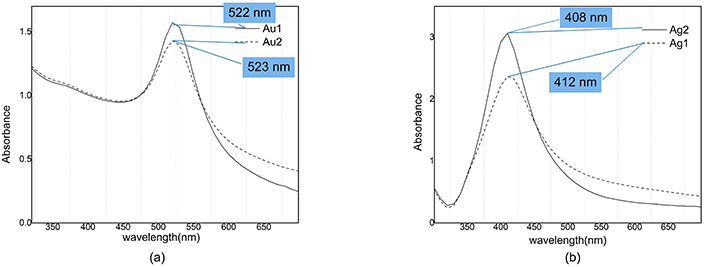
Absorption spectra of nanocolloids. a) Au1: After ablation (Peak @ 522 nm; Valley @ 446 nm); Au2: after illumination (Peak @ 523 nm; Valley @ 445 nm). b) Ag1: After ablation (Peak @ 412 nm; Valley @ 322 nm); Ag2: after illumination (Peak @ 408 nm; Valley @ 323 nm). Adapted from [17], 2020, CC BY-NC 4.0
Concentrating on vertical axis in Figure 5 it is clear that the absorbance of silver is increased from 2.3 to about 3 under illumination, while for gold nanoparticles we see a decrease in absorbance from 1.7 to 1.4.
The Mie theory is based on the resolution of the Maxwell equations in spherical coordinates using the multi pole expansion of the electric and magnetic fields by taking into account the discontinuity of the dielectric constant between the sphere and the surrounding medium. For spherical particles, the extinction, scattering, and absorption cross sections are calculated from Mie theory by series expansion of the involved fields into partial waves of different spherical symmetries [8]:
where k, is the wave vector and an, bn are scattering coefficients in terms of Ricatti-Bessel cylindrical functions. The Mie spectra depend on the radius of the sphere (R) and dielectric function. Bulk dielectric function [Ԑbulk(ω)] incorporates both, size independent conduction electron processes and interband transitions. We use Johnson and Christy data [13, 14] for the dielectric function of gold and silver nanoparticles. Size-dependent damping effects change the magnitude of the nanoparticle’s dielectric function. However, the damping related to the mean free path of free electrons, is strongly affected by the size. Dielectric function and damping constant for nanoparticles can be written as [15–17]:
where vF is the Fermi velocity, A is the scattering constant that includes details of the scattering process and ωP is the bulk plasma frequency given by
Necessary plasmonic constant for dielectric calculations*
| Constant | Symbol | Silver | Gold |
|---|---|---|---|
| Mean free path for free electrons | l | 52 nm | 42 nm |
| Plasma frequency | ωP | 2.14 × 10¹⁵ Hz | 2.17 × 10¹⁵ Hz |
| Fermi velocity | vF | 1.39 × 10⁶ m/s | 1.39 × 10⁶ m/s |
| Constant parameter | A | 1 | 0.33 |
| Density | ρ | 10.49 g/cm3 | 19.32 g/cm3 |
We have developed a new method to calculate the mean free path of electrons in spherical nanoparticles and related Г(R) in the Drude model; accordingly, we have corrected ϵ(R,ω). In Figure 6 our new approximation is shown for calculation of leff. As seen in Figure 6, inside the sphere, the electron located at point da can move in all directions. If the path traveled in hitting the surface is greater than the length of the mean free path, we consider the length traveled to be l, with this condition numerical averaging are obtained over all points and all directions. Of course, due to the symmetry of spherical nanoparticles, the electrons are distinguished only in the radial direction relative to the surface, that is, if completely identical electrons are removed from the averaging, only the electrons that are in the radial direction and move outward or inward are averaged. Since we consider the electron distribution inside the nanoparticle to be uniform by averaging l over all angles from zero to π and radii from zero to R and applying the weight function for shell electrons with thickness da, we obtain the diagram in Figure 7 for the mean free path length of the electrons inside the nanoparticle. In this figure the red line shows the mean free path length in terms of radius by adding the term related to the surface scattering, including the scattering of electrons colliding the ions using Eq. 5 and the blue line shows the mean free path length according to the normally calculated mean free path.
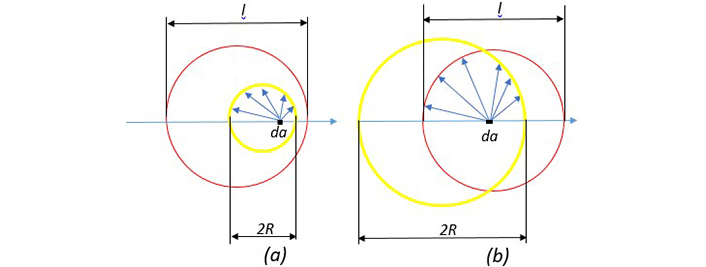
A comparison between nanoparticle diameter and mean free path length of free electrons. (a) Nanoparticle diameter is smaller than l. (b) Nanoparticle diameter is larger than l. The yellow circle represents the nanoparticle and the red circle represents the mean free path length. The length of the free path is the average of the blue arrows. When the blue arrow hits the surface, if it has a length greater than l, this magnitude is calculated as the length (reprinted from [17], 2020, CC BY-NC 4.0)
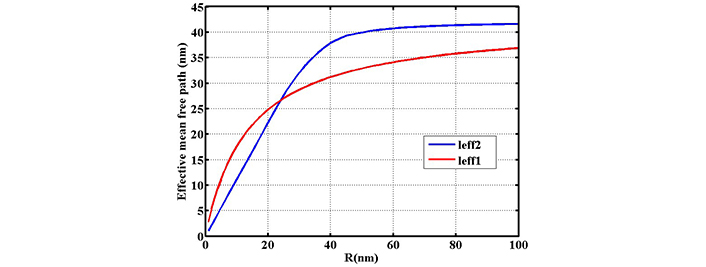
Investigating the variation of effective mean free path length of electrons inside the nanoparticle in terms of radius R. The red line gives the effective length of leff1 based on Eq. 5 and the blue line gives the effective length of leff2 based on direct averaging (reprinted from [17], 2020, CC BY-NC 4.0)
In Figure 7 variation of effective mean free path against radius is shown in the range of 0–100 nm. For nanoparticles below 40 nm, there is a linear dependence for normal calculation while variation of effective mean free path is not linear in our calculation. Beyond 40 nm both effective mean free path length increase with different slopes.
When the slope of the graph is larger it means that the curve tends toward bulk values more rapidly. At last, in two separate 3D graphs (not shown here), we plotted the variation of wavelength and absorbance against radius and standard deviation to estimate the radius range for experimentally produced gold nanoparticles.
According to the values calculated for leff2 in the method mentioned above and using Eq. 4, the imaginary and real part of the dielectric function has been calculated and plotted in terms of radius and wavelength in a three-dimensional diagram. After plotting the real and imaginary part of ϵ(R,ω) in 3D graphs, Cext and Cabs are plotted in other 3D graphs (not shown here), we show that the SPR’s positions are relatively constant for two samples; meanwhile, it is shown that the magnitude of absorbance’s have visible changes for these two samples.
According to the values of absorption and peak position of plasmon resonance for Au1 and Au2 samples that are given in previous section, we can estimate the radius and standard deviation of Au1 and Au2 samples. For the Au1 sample, the average radius is between 17 to 20 nm and the standard deviation is in the range of 6 to 9 nm, and in the Au2 sample, the radius and standard deviation values are in the range of 12 to 14 nm and 7 to 9 nm, respectively. Therefore, it cannot be accurately said that the spectrum is caused by an average radius and a unique distribution.
Absorbance of nanoparticles can be obtained from the following equation [15]:
where ni is total number of nanoparticles in each size group, L is optical path length of samples and N is total number of nanoparticles. The absorbance of silver nanoparticles versus wavelength is simulated for 5, 15, 25 and 35 nm radiuses in Figure 8a where each sample of nanoparticles has the same amount of mass. As can be seen, maximum absorbance of the silver nanoparticles with the size 15 nm, is placed around the wavelength of 400 nm and has a magnitude larger than other radiuses. Therefore, in a sample with the same mass percent of nanoparticles, the maximum absorbance will be for 15 nm particles.
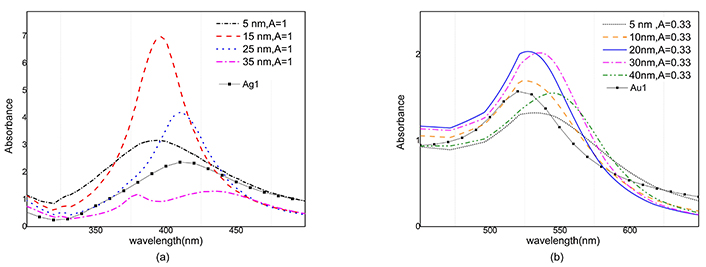
Absorption spectra of gold and silver nanoparticles at different radii for two corresponding A value. a) Absorption spectrum of 5, 15, 25, 35 nm silver nanoparticles for 0.6 mg ablated mass and Ag1 sample. b) Absorption spectrum of 5, 10, 20, 30, 40 nm gold nanoparticles for 1 mg ablated mass and Au1 sample. Au1 and Ag1: gold and silver colloids after ablation; A: the constant in Eq. 5a
According to the histograms, it is clear that the number of smaller nanoparticles is more than the larger ones, while the absorption cross-section and the total volume of the smaller nanoparticles are smaller, so they do not have a significant effect on the absorption.
Very large nanoparticles are fewer so they have also an insignificant result. Also, in Figure 8b the absorbance is simulated versus wavelength for gold nanoparticles with radiuses of 5, 10, 20, 30 and 40 nm. In this case, the maximum value of the absorbance belongs to colloidal gold nanoparticles 20 nm and 30 nm radii in size. Comparing the two graphs, it is clear that silver nanoparticles have sharper absorbance, and their full width at half maximum (FWHM) is less than gold nanoparticles.
The magnitude of absorption in gold nanoparticles for different sizes follows a similar pattern, as a result, gold nanoparticles are less sensitive to size distribution than silver nanoparticles.
For simulation of absorbance according to size distribution, we fit a normal distribution to histograms, and then by programming in MATLAB software we reconstruct the absorbance of the samples. It is obvious that ni is a fraction of the total nanoparticles of the sample and also, is proportional to the total mass of the ablated material in the water. It is natural that the sum of the coefficients of the total mass is equal to one.
Where yi and xi are a fraction of the total nanoparticles, according to size distribution and a fraction of the total mass in water respectively. M is the total ablated mass into the water and ρ is the density of matter. By combination of Eq. 7, 8 and 9, we will have:
By solving these equations, unknown parameters, namely N and the absorbance are determined. Total number of nanoparticles are estimated to be 6.9 × 10¹², 110.45 × 10¹², 1.6 × 10¹³ and 19.9 × 10¹³ for Ag1, Ag2, Au1 and Au2 samples respectively. Our estimation shows that after illumination, the number of Ag/Au nanoparticles is increased by a 16/12.4 fold multiplication factor. The ablated gold material is more than silver (1 mg to 0.6 mg), consequently under illumination, silver nanoparticles receive more energy than gold nanoparticles and melting/boiling point of silver is smaller than gold, so size reduction of silver nanoparticles is more. Figure 9 shows computationally reconstructed absorbance for the Ag1 sample along with experimental data. In this figure, we neglect size dependence and put A = 0 in Eq. 5.
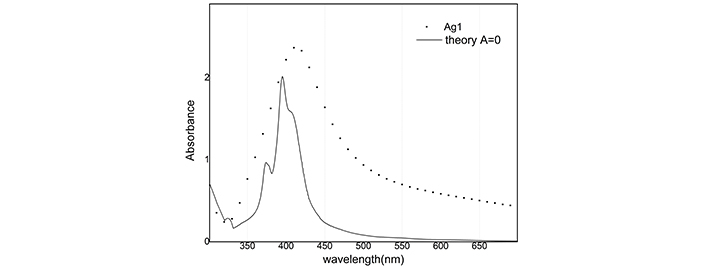
Reconstruction of absorbance with A = 0 for Ag1 sample. Ag1: silver colloids after ablation
The reconstructed graph does not match well with the experimental one because the dielectric function does not depend on the radius. Best A parameters have been studied in many articles [15]. We use A = 1 for silver nanoparticles and A = 0.33 for gold nanoparticles. Absorbance in Figure 10 and Figure 11 is simulated and compared with the empirical graph, in this case, there is a better agreement between experiment and theory.
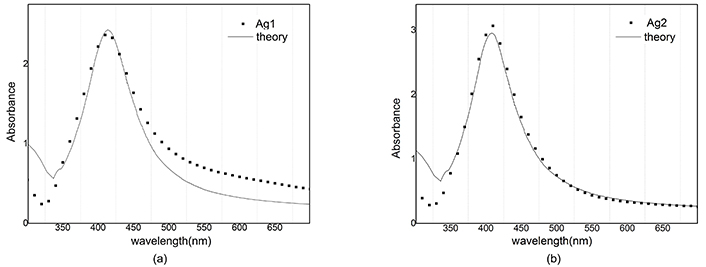
Absorbance of Ag and reconstructed graph with A = 1. a) After ablation; b) after illumination
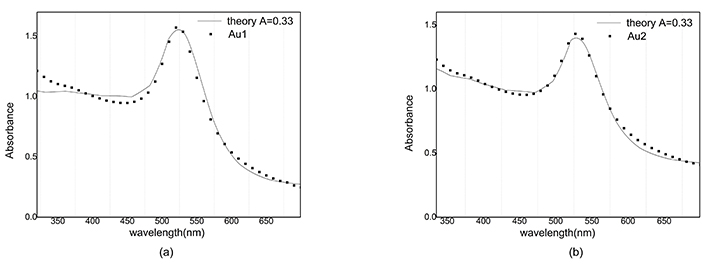
Absorbance of Au and reconstructed graph with A = 0.33. a) After ablation; b) after illumination
The mean free path of electrons in gold nanoparticles is greater than the corresponding value in silver nanoparticles, so for different values of A, no significant difference in the magnitude of absorption is observed in gold nanoparticles.
The size, concentration, and aggregation level of gold nanoparticles are key points for their applications. We produced silver and gold colloids with ablation of their foils in water without any surfactant, and then we fragmented the nanoparticles colloids with an intense nanosecond laser and studied the effect of illumination on peak position and size distribution of colloids. The wavelength of peak position shifted 1 nm and 4 nm for gold and silver colloids respectively. That shows both samples have gained size reduction after illumination, and the number of Ag/Au nanoparticles has been increased by a 16/12.4 fold multiplication factor.
For the same filling factor of different-sized nanoparticles, we obtained different absorbances. The amount of SPR absorbance in 20 nm gold nanoparticles toward 10 nm changed very small, but the change of absorbance was significant for 15 nm silver nanoparticles to 5 nm, so the sensitivity of gold nanoparticles to size distribution is less than silver nanoparticles.
Computational reconstruction of absorbance-wavelength graphs for silver nanoparticles showed a lot of difference between A = 0 and A = 1 modes. By consideration, the dependence of the dielectric function on the radius of nanoparticles can be seen as a better agreement between experiment and theory.
In this work, we used our idea for modeling dielectric function [17] and tried to reconstruct the absorbance-wavelength graphs for plasmonic nanoparticles by varying A parameter, and viewed a lot of differences between A = 0 and A = 1 mode. By this model, we can see a better agreement between experimentally produced UV/VIS absorption spectra and theoretically produced spectra.
SPR: surface plasmon resonance
TEM: transmission electron microscope
HN: Conceptualization (outline of the research topic and the title of the article, suggesting the addition of Mie theory), Investigation (performing experimental work and preparing TEM images), Visualization (adding Figures 1 to 5). HM: Writing—original draft (completing the article), Visualization (preparing Figures 6 to 11), Methodology (presenting a new theory for calculating the mean free path based on Figure 6), Conceptualization (conceptual investigation of the problem), Formal analysis (adding equations 7 to 10 to the article).
Both authors declare that they have no conflicts of interest.
Not applicable.
Not applicable.
Not applicable.
The data is available from the corresponding author upon reasonable request.
Not applicable.
© The Author(s) 2024.
Copyright: © The Author(s) 2024. This is an Open Access article licensed under a Creative Commons Attribution 4.0 International License (https://creativecommons.org/licenses/by/4.0/), which permits unrestricted use, sharing, adaptation, distribution and reproduction in any medium or format, for any purpose, even commercially, as long as you give appropriate credit to the original author(s) and the source, provide a link to the Creative Commons license, and indicate if changes were made.

Humaira Aslam ... Misbah Ullah Khan
