
Abstract
Aim:
Fructose is a highly lipogenic compound related to the onset of steatosis, its progression to steatohepatitis, and the eventual initiation of hepatocellular carcinoma (HCC). One of the cancer hallmarks is the metabolic adaptation to the environmental sources; however, this characteristic could be exploited to manipulate the HCC tumor’s response to therapies. Due to the high prevalence in the consumption of diets enriched with fructose and the unclear results in the literature, it is pertinent to characterize the effects of fructose on the biology of HCC as a possible beneficial player in the aggressiveness of this cancer. We focused on investigating the metabolic effect of fructose on the aggressiveness of liver cancer cells and chemotherapy response.
Methods:
We treated Huh-7 and HepG2 liver cancer cell lines with 1 mM fructose to address the metabolic reprogramming and its fructose-induced effects.
Results:
Cancer cells use fructose as an alternative fuel source in glucose-starved conditions, ensuring tumorigenic properties and cell survival in both cell lines. The metabolic effect differed depending on cell line origin and aggressiveness.
Conclusions:
HCC cells showed a metabolic adaptation under fructose treatment, enhancing the pentose phosphate pathway to fuel anabolism. Metabolic rewiring also improves the tumorigenic properties and chemoresistance of cancer cells in vitro and in vivo, contributing to chemotherapy failure and the aggressiveness of liver cancer cells.
Keywords
Fructose, metabolism, hepatocellular carcinoma, MASLDIntroduction
The consumption of ultra-processed foods, particularly those enriched with added sugars, has increased significantly in recent years, rising worldwide by 1.4% per annum; it is estimated that in the year 2030 will be used 196 million metric tons worldwide, according to the Food and Agriculture Organization (FAO) of the United Nations [1]. However, high fructose corn syrup (HFCS) as the primary sweetener is estimated to increase from 63% to 68% by 2030 [1].
This context is worrying since sugar consumption is implicated in the prevalence of metabolic dysfunction-associated steatotic liver disease (MASLD) [2–4]. Specifically, fructose (Fru) is associated with inflammation and liver disease progression to the cancer scenario [5–7]. In addition, the inflammatory stage (metabolic-dysfunction associated steatohepatitis, MASH) has been declared the fastest-growing etiology of hepatocellular carcinoma (HCC) [8].
One of the hallmarks of cancer cells is metabolic dysregulation [9], and some authors have proved that Fru metabolism is different in normal and transformed cells in many types of tumors [10–13]. Under normal conditions, the main enzyme of the pathway, the ketohexokinase C (KHK-C), has a higher affinity for Fru. The increased activity leads to the production of intermediary metabolites that can be incorporated into glycolysis, skipping the two main regulatory steps of the pathway and enhancing de novo lipid synthesis, liver steatosis, and aberrant lipogenesis [14]. Nevertheless, the metabolism of Fru is diminished in cancer cells [12]. Normal cellular metabolism produces reactive oxygen species (ROS), facilitating cellular adaptation to new conditions. This includes reducing KHK-C activity and replacing the latter with KHK-A, the isoform with reduced Fru affinity yet implicated in cancer progression and aggressiveness [10, 11, 15].
One recent approach to treating patients could be modifying the diet to enhance the effects of chemo, radio, and immunotherapy. Despite extensive research on the metabolism of Fru, the impact of Fru on liver cancer cells remains a topic of debate. Some contradictory results have indicated that Fru may promote cell death and be utilized to manipulate the metabolic environment of HCC tumors [16]. However, most of the published research in the field has highlighted the potential role of Fru in the aggravation of MASLD and cancer [4, 6, 7, 14, 17–21].
Given the high prevalence of Fru in the modern diet and the association of the monosaccharide with HCC progression and the emergence of a more aggressive HCC subtype, this study aimed to investigate the impact of Fru metabolism on liver cancer cell aggressiveness and its relevance in chemotherapy response. Our study demonstrates that Fru induces a metabolic adaptation in liver cancer cells associated with cellular differentiation, which promotes an aggressive phenotype and contributes to therapy failure in both in vitro and in vivo models.
Materials and methods
Cancer cell lines
Huh-7 and HepG2 cells were obtained from the American Cell Culture Collection (ATCC, Manassas, VA, USA). They were cultured in DMEM medium (Thermo Fisher Scientific, Waltham, MA, USA, 41965062) supplemented with 10% fetal bovine serum (FBS, Hy-Clone, Logan, UT, USA, SH30910.03), 100 U/mL ampicillin and 100 μg/mL streptomycin (Thermo Fisher Scientific, 15240-062), maintained at standard conditions, 37°C, 5% CO2 and 90% humidity. Cells were treated with Fructose (Fru, Sigma-Aldrich, St. Louis, MO, USA, F0127) at the physiological concentration (1 mM) [22]. Cell lines were mycoplasma free. Cell line authentication was confirmed using short tandem repeat analysis.
Proliferation and viability assay
To develop the assays, we used DMEM with high glucose (High Glc, 11 mM, Sigma-Aldrich, St. Louis, MO, USA, G8270), or low glucose (Low Glc, 0.4 mM), and supplemented it with 1 mM Fru with FBS. The cell proliferation and viability assays were carried out using the cell counting kit-8 (CCK-8, Dojindo Lab, Kumamoto, Japan, CK04), following the manufacturer’s instructions, and dimethyl sulfoxide (DMSO) 30% was used as a negative control of viability. On the other hand, to evaluate the importance of the pentose phosphate pathway we inhibited glutathione reductase (GR) enzyme. We treated the cells with 2-acetylamino-3-[4-(2-acetylamino-2-carboxyethylsulfanylthiocarbonylamino) phenylthiocarbamoylsulfanyl] propionic acid (2-AAPA) at 0, 40, and 80 μM for 48 h with High Glc and with/without Fru.
Cellular Fru uptake assay
Huh-7 and HepG2 cells were plated using 2 × 10⁴ cells/well in 96-well plates with clear bottoms. Cells were treated with High Glc media with 1 mM of Fru for 48 h before the assay. The day of the assay, cells were treated with DMEM Glc-free media (Thermo Fisher Scientific, 11966025) for 1 h and then incubated with treatment media containing 1-deoxy-1-[(7-nitro-2,1,3-benzoxadiazol-4-yl)amino]-D-fructose (1-NBDF; Cayman Chemicals, Ann Harbor, MI, USA, 940961-04-6) 100 μM for 1 h at 37°C, 5% CO2 and 90% atmospheric humidity. Then, the cells were washed twice with PBS, and each well remained with 100 μL of PBS for fluorescence determination. 1-NBDF fluorescence was measured at 475 nm excitation/550 nm emission. Data were normalized against cellular density in each well, determined by Hoechst fluorescence measured at 350 nm excitation/461 nm emission.
Ketohexokinase expression by real-time RT-PCR
After treatments, RNA extraction was performed using TRIzol reagent (Ambion, Inc, Austin, TX, USA, 15596018). A specific RT reaction was established with 2 μg of total RNA using M-MLV RT (Promega, Madison, WI, USA, M170A) and following manufacturer instructions.
The qRT-PCR analysis was performed with a CFX96 Touch (Bio-Rad, Hercules, CA, USA) thermal cycler in a 96-well reaction plate. The 10 μL PCR reaction mix contained 5 μL 2X SYBR Green PCR Master Mix (Bio-Rad, 1725271), 200 nM of each primer, and 1 μL cDNA template. Reactions were incubated for 10 min at 95°C, followed by 40 cycles of 30 s at 95°C and 60 s at specific khk-c and khk-a primers [15] temperatures (57°C). Melting analysis of the PCR products was also conducted to validate the amplification of the product. The expression level of mouse rps18 [23] was used as an internal reference. Relative gene expression level was calculated with the 2−ΔΔCT method. Primer sequences are listed in Table S1.
Real-time metabolism assay
HepG2 and Huh-7 were used to evaluate mitochondrial substrate oxidation by carrying out a Mito Fuel Flex Assay (Agilent Technologies, 103260-10) using Agilent Seahorse XFe96 (Agilent Technologies, Santa Clara, CA, USA). Then, the Glycolytic Rate Assay was run using Huh-7 cells using the Agilent Seahorse XFe24 Analyzer (Agilent Technologies) and the Agilent XF Glycolytic Rate Assay Kit (Agilent Technologies, 103344-100). We followed the manufacturer’s instructions for both assays and measured the oxygen consumption rate (OCR) and extracellular acidification rate (ECAR). Mito Fuel Flex Assay reflects the oxidation percentage for each mitochondrial substrate, Glc, glutamine (Gln), or palmitic acid, represented by capacity, dependency, and flexibility. For the second assay, we represented the GlycoPer (glycolysis contribution to media acidification), MitoPER (mitochondrial contribution to media acidification), and PER (proton efflux rate).
Spheroid formation
1 × 10³ cells were pre-coated with 300 μL agarose per well (6 mL DMEM 20% FBS + 4 mL 2% agarose). Once the agarose had solidified, we seeded the cells dissolved on 0.25% agarose and 20% DMEM. The next day, we applied the treatments. The Fru treatment was applied 24 h after the cells were seeded and left for 14 days. The spheroids were counted and photographed using a Carl Zeiss VERT.A1 microscope (Carl Zeiss VERT.A1, Zeiss, Oberkochen, Germany).
Wound-healing assay
Huh-7 and HepG2 cells were seeded using a 2-well culture insert with a defined cell-free gap for wound healing and migration assays (ibidi, Gräfelfing, Germany, 81176) (30,000 cells per well). After 12 h, cells were previously treated with Low Glc serum-free media for 24 h, and then the media was changed and treated with or without 1 mM of Fru in High Glc or Low Glc serum-free media. We followed the experiment for 24, 48, and 72 h.
Cell death determination by flow cytometry
The assay was performed by seeding 1 × 10⁶ cells per bottle (Millipore-Sigma, Saint Louis, MO, USA) using DMEM with Glc (Sigma-Aldrich, St. Louis, MO, USA) with FBS. The cells were pre-treated with Fru and left for 72 h. Then, 335,000 cells were re-seeded in a 35 mm plate and treated with Fru: 1 mM and cis-diaminplatin (II)-dichloride (CDDP) (ACCOCIT injectable solution 10 mg/10 mL, Accord Farma, Mexico City, Mexico): 22.11 μM to carry out the test. We followed the experimental model depicted in Figure 1.
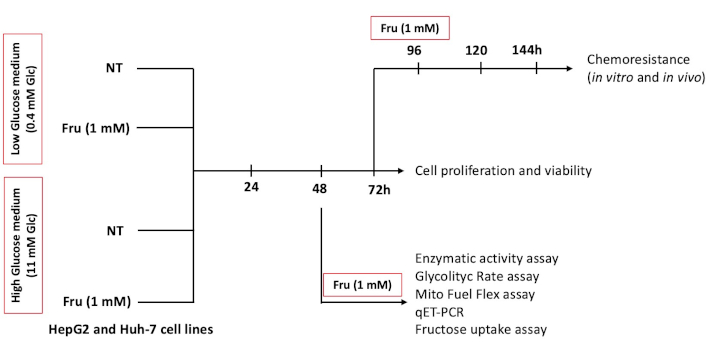
In vitro experimental design. HepG2 and Huh-7 liver cancer cells were used to establish the model. Cells were treated with or without fructose (Fru, 1 mM) with DMEM low glucose (Low Glc, 0.4 mM) or high glucose (High Glc, 11 mM) at the indicated time points
After treatments, cells were incubated with PBS-EDTA (5 mM) for 5 min at 37°C and trypsin-EDTA (1X) for 5 min at 37°C. They were then centrifuged at 1,800 rpm for 5 min and resuspended in PBS-heparin to proceed with the protocol. Then, 400 μL of cells were stained with 1 μL of iodine propidium. The assay used a flow cytometer (FACS Aria Fusion, BD, Franklin Lakes, NJ, USA).
Glucose-6-phosphate dehydrogenase activity
Glucose-6-phosphate dehydrogenase (G6PD) activity was measured using 5 mM glucose-6-phosphate (substrate) and 0.4 mM NADP+ (coenzyme) in 50 mM Tris-HCl containing and 5 mM MgCl2 (pH = 8). The assay was performed in a 96-well plate, and the reaction mixtures consisted of 180 µL of buffer, 20 µL of NADP+, 20 µL of substrate, and 20 µL of cell lysate. The mixture, excluding the substrate and coenzyme, was incubated for 5 min at room temperature, and the substrate and coenzyme were added just before starting the assay. NADPH production from the reaction was monitored kinetically every 5 min up to 1 h at an absorbance of 340 nm and 37°C.
ROS determination
Cells were seeded in 96-well-well plates. We established two models: (1) to pre-treat the cells with Fru (1 mM) for 48 h, or (2) to treat the cells for 5, 15, 30, and 60 minutes with Fru (1 mM); both conditions were treated in a High Glc media. After that time, we incubated the cells for 15 min with dihydroethidium (DHE, 5 μM) in the dark, at room temperature, to determine superoxide radical by detecting ethidium fluorescence. DHE-derived fluorescence was determined in a multipedal reader (Beckman Coulter DTX 880 Multimode Detector) at excitation and emission wavelengths of 485 nm and 570 nm.
Chorioallantoic membrane in vivo model
To study the impact of sugar metabolism on tumor formation capacity and therapy resistance, cells were pretreated for 5 days with DMEM High Glc with or without Fru (1 mM). Treated and control cells were inoculated on the extraembryonic chorioallantoic membrane (CAM) of chick embryos on the embryonic developmental day (EDD) 10 following the method described by Gerardo-Ramirez et al., 2019 and Meenen et al., 2022 [24, 25]. Briefly, 10 eggs per group were inoculated with 2 × 10⁶ cells suspended in 50 μL of PBS in at least three independent experiments and incubated at 37.8°C and 60% humidity up to the end of the experiments. Four days after grafting (EDD14), cells were treated with CDDP using 100 μM [26]. At EDD17, grown tumors were excised, measured, weighed, and photographed as described previously by Busch and collaborators, 2015 [27], Figure S1. This in vivo model has been approved by the ethical committee of the Universidad Autónoma Metropolitana-Iztapalapa (UAM-I): CECBS22-02.
Statistical analysis
All experiments were carried out, at least in triplicate. Data are expressed as the mean ± SEM. The t-test was performed to compare means, two-way ANOVA between treatment groups, and the Tukey-Kramer test. The GraphPad Prism 8.2.1 Software for Mac OsX (GraphPad Software, San Diego, California, USA) was used for data processing. Differences were considered significant at p ≤ 0.05.
Results
Fru treatment promotes proliferation and fructokinase isoform remodeling
We have treated cells with Fru (1 mM) under two different Glc concentrations at different times, as described in the materials and methods section in Figure 1. Under treatments, we observed refracted cells in media without Glc, even in the presence of Fru, after 48 h, suggesting that Glc starvation induces cell death in both conditions (black arrows, Figure S2A and B); however, the cells were able to survive in the combined treatment (Low Glc + Fru) compared to Low Glc alone, suggesting that Glc promotes Fru uptake and cancer cells can switch the substrate to obtain energy.
Next, we determined the relevance of Glc concentration in Fru internalization. In two scenarios, we explored the effect of low and High Glc concentrations in HepG2 and Huh-7 cells. In the first one, we determined Fru uptake in both cell lines with no previous presence of Fru (Figure 2A). Our data indicate that High Glc levels facilitate Fru uptake in both liver cancer cell lines. In the second scenario, cells were previously conditioned with Fru for 48 h, after which the media was changed to the previously established measurement conditions. Figure 2A shows that Huh-7 cells exhibited a 2-fold increase in Fru uptake in the presence of Glc, while there was no significant change in HepG2 cells. These findings suggest that using Fru may elicit an adaptive response, which is dependent on the origin and aggressivity of the cell.
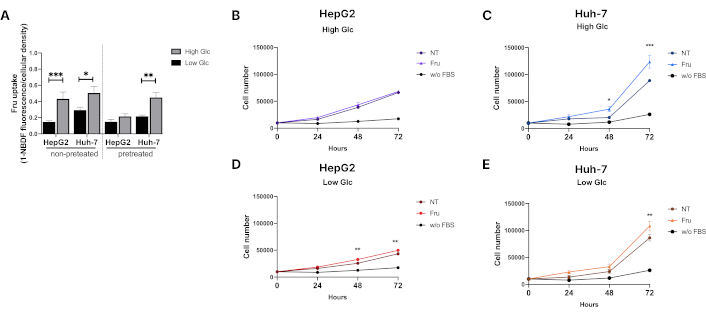
Fructose promotes liver cancer cell proliferation. (A) Fructose uptake in HepG2 and Huh-7 cells. Cells were treated for 48 hours before the assay with fructose (1 mM). (B) Proliferation of HepG2 cells in high glucose media (11 mM) and (C) proliferation of Huh-7 cells in high glucose media (11 mM). (D) Proliferation of HepG2 cells in low glucose media (0.4 mM) and (E) proliferation of Huh-7 cells in low glucose media (0.4 mM). Proliferation was measured using the CCK-8 assay kit. We employed DMEM low glucose media: 0.4 mM; DMEM high glucose media: 11 mM; Fru: 1 mM; for 24, 48, and 72 hours; without FBS: negative proliferation control, cells with no FBS and no fructose. Each group represents the median ± SEM from at least three independent experiments. NT: not treated. * p ≤ 0.05, ** p ≤ 0.01, *** p ≤ 0.001
We measured cell proliferation under these conditions to address the impact of Fru uptake. The HepG2 cell line did not proliferate in a High Glc media; however, Huh-7 cells exhibited increased proliferation compared to not treated (NT) cells after 48 h of treatment (Figure 2B and 2C), supporting previous results that suggested Fru metabolism has a differential effect on the differentiation level of transformed cells. Fru-alone treatment improved cell proliferation and survival under Low Glc conditions (Figure 2D and 2E), indicating that Fru could be an energy provider. Fru did not affect cell viability (Figure S2C–F).
Then, we aimed to determine whether proliferation enhancement was associated with fructokinase isoform switching (KHK-C to KHK-A), as previously reported [11]. Fru treatment (1 mM, 48 h) induced significant isoform switching, particularly in the more aggressive Huh-7 cell line, with higher expression in Fru-treated cells and downregulation regarding NT cells (Figure 3A and 3B); however, in HepG2 cells, higher expression of isoform khk-c was still observed with no difference in isoform khk-a expression (Figure 3C and 3D).
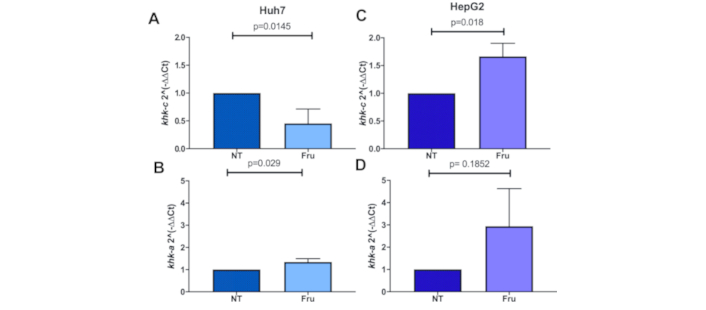
Fructose treatment induces the switching of ketohexokinase isoforms. Ketohexokinase expression analyzed by qRT-PCR of the isoforms: (A) khk-c and (B) khk-a in Huh-7 cells; (C) khk-c expression and (D) khk-a expression in HepG2 cells under fructose (Fru) treatment (1 mM) for 48 h; each bar represents the median ± SEM of three independent experiments
Fru treatment induces a metabolic rewiring to sustain proliferation and survival
Metabolic adaptation is related to the aggressiveness of cancer cells. Considering the earlier results, we investigated if the isoform switching induces metabolic rewiring to enhance proliferation and survival. We analyzed the ECAR and OCR to further explore the metabolic changes by implementing the Mito Fuel Flex Assay and Glycolytic Rate Assay using Seahorse technology.
We aimed to identify the metabolic substrates required for mitochondrial respiration by performing a Mito Fuel Flex Assay. Following treatment with High Glc, both cell lines revealed comparable Glc and fatty acid oxidation capacity, regardless of the presence or absence of Fru. However, analysis of the capacity for Gln oxidation revealed a reduction in the capacity of Huh-7 cells to oxidize this substrate compared to HepG2 cells (Figure 4A). Subsequently, the dependency and flexibility of both cell lines to oxidize Glc, Gln, and fatty acids in the mitochondria were compared. Our findings revealed a significant decrease in fatty acid dependency in Fru-treated HepG2 cells compared to NT (Figure 4B). Approximately 40% of the total mitochondrial energy in both cell lines depended on Glc oxidation with or without Fru supplementation. Huh-7 cells demonstrated a complete dependency for Gln oxidation in both conditions, yet less than 20% of the energy is obtained from this pathway (Figure 4C).
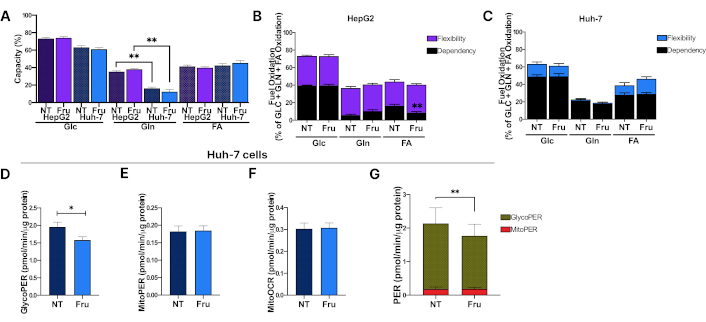
Fructose treatment induces metabolic rewiring in the Huh-7 cell line. Huh-7 and HepG2 cells were treated with fructose (Fru) at 1 mM in high glucose (Glc) media for 48 hours, and real-time cellular metabolism was assessed using Seahorse technology. (A) Mitochondrial substrate oxidation capacity in HepG2 and Huh-7 cells; (B) Mitochondrial fuel oxidation with Glc, glutamine (Gln), or fatty acids (FA) in HepG2 cells; (C) Mitochondrial fuel oxidation in Huh-7 cells; (D) GlycoPER representing the proton efflux rate (PER) dependent on the glycolysis contribution to media acidification in Huh-7 cells; (E) MitoPER represents the proton efflux rate dependent on mitochondrial media acidification in Huh-7 cells; (F) MitoOCR represents the oxygen consumption rate due to mitochondrial respiration in Huh-7 cells; (G) PER contribution from glycolytic and mitochondrial media acidification in Huh-7 cells. Each group represents the median ± SEM from at least three independent experiments. Glucose (Glc, 11 mM), fructose (Fru, 1 mM). * p ≤ 0.05, ** p ≤ 0.01
In contrast, HepG2 cells exhibited greater flexibility in utilizing different substrates to meet the energy demands in stressful conditions than Huh-7 cells (Figure 4B). This adaptability may be associated with the observed survival and low proliferation rates in HepG2 cells. These findings indicate that glucose oxidation represents the primary mitochondrial pathway for energy acquisition, and Fru does not induce significant changes at this metabolic level in the cells.
Considering that Fru treatment may elicit differential effects regarding cells’ origin and differentiation status, we pursued further exploration in Huh-7 cells and conducted a Glycolytic Rate Assay. Metabolic alterations were evident in Fru-treated cells, exhibiting a decline in glycolysis and a reduction in the PER relative to the control group (Figure 4D and 4G). We could not observe any change in mitochondrial metabolism (MitoPER and MitoOCR) in Fru-treated cells in either scenario (Figure 4E and 4G) or between treatments (Figure 4F), thereby corroborating the earlier results obtained from the Mito Fuel Flex Assay. These results indicate that Fru impairs glycolysis, which could activate alternative pathways to support survival and proliferation.
Fru treatment favors the pentose phosphate pathway
It is known that the pentose phosphate pathway (PPP) is critical for anabolic activities in cancer cells. The pathway is critically regulated by the activity of G6PD, the rate-limiting enzyme in the PPP; in fact, the upregulation of G6PD is associated with a poor outcome in liver cancer patients as indicated by the Kaplan-Meier plot (Figure 5A), obtained from the GEPIA2 software [28]. Fru in the medium increased levels of NADPH (Figure 5B), and G6PD achieved Vmax in the shorter time frame (Figure 5C). Moreover, to investigate whether PPP plays a pivotal role in the metabolic effects of Fru on cancer cells, we used the 2-AAPA to inhibit glutathione reductase (GR) activity, one enzyme that uses the NADPH to reduce oxidized glutathione (GSSG); Huh-7 cells treated with Fru exhibited higher viability than NT cells, which is related to the higher proliferation obtained previously. However, cells treated with 2-AAPA demonstrated a 43% reduction in viability compared to NT, confirming that Fru favors the PPP (Figure 5D). Then, we established two models. We followed the previous pre-treatment with Fru for 48 h (model 1) or treated the cells directly for 5, 15, 30, and 60 min with Fru (model 2) and measured the ROS by superoxide anion production. As we expected, short-time treatments did not counteract the production of ROS (model 2, Figure 5E); however, the pre-treatment with Fru agreed with our previous results and decreased superoxide anion content (model 1, Figure 5F), demonstrating that the metabolic rewiring is induced by the monosaccharide.
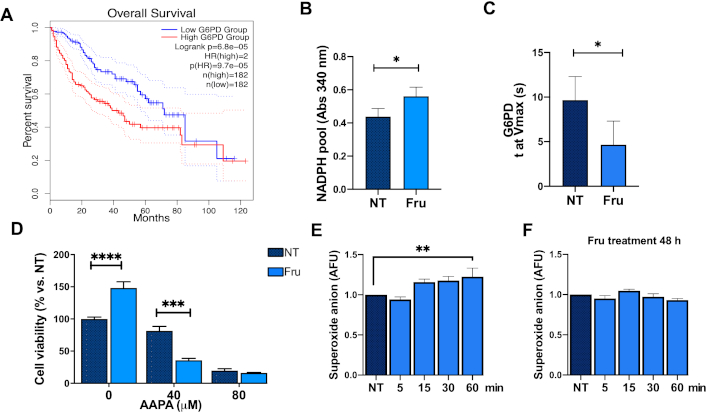
Fructose treatment favors the pentose phosphate pathway. (A) Overall survival of HCC patients regarding glucose-6-phosphate dehydrogenase (G6PD) expression. G6PD activity is measured by (B) NADPH pool and (C) time to maximal velocity (Vmax). (D) Glutathione reductase (GR) inhibition using 2-AAPA: 0, 40, and 80 μM. Superoxide anion determined by DHE fluorescence in Huh-7 cells following (E) the model (2) (fructose treatment, 1 mM, for 5, 15, 30, and 60 min); and (F) model (1) [fructose pre-treatment (1 mM, for 48 h before DHE measuring)]. Each group represents the mean ± SEM of at least three independent experiments. Glucose (Glc, 11 mM), fructose (Fru, 1 mM). AFU: arbitrary fluorescent unit. * p ≤ 0.05, ** p ≤ 0.01, *** p ≤ 0.001, **** p ≤ 0.0001
Metabolic rewiring enhances chemoresistance and aggressiveness
Metabolic adaptation in cancer cells may promote therapy failure and aggressiveness. First, to test the hypothesis, we pretreated cells with Fru for 72 h and then with CDDP (22 μM) for 48 h. We observed that Fru-treated cells exhibited no difference in morphology regarding NT cells, but CDDP treatment induced evident damage (Figure 6A). Flow cytometry analysis of cell death revealed that Fru treatment induced significant chemoresistance to the CDDP cytotoxicity compared to CDDP treatment alone, according to the dot plots (Figure 6B) and percentage of cell death (Figure 6C). These results strongly suggest that Fru is bringing an aggressive phenotype. To gain more confidence, we assayed some parameters of cellular aggressivity.
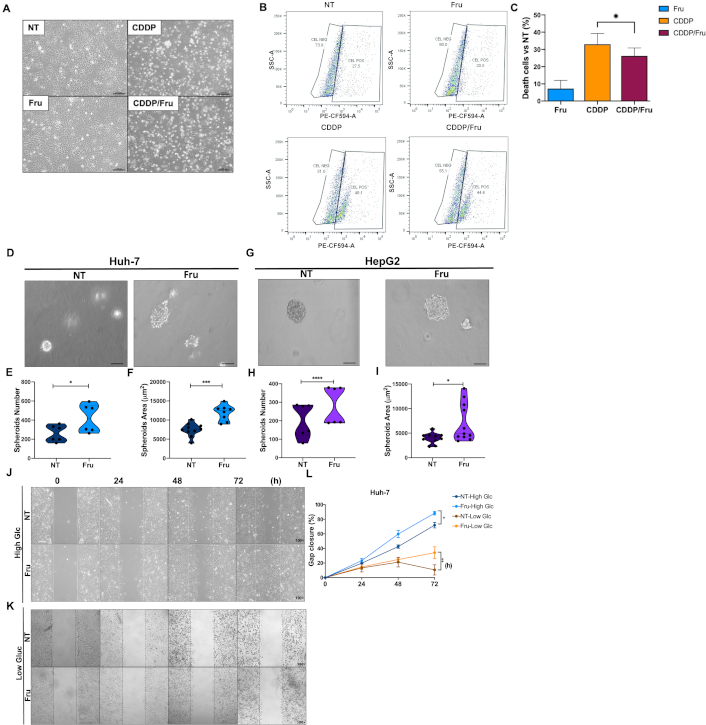
Metabolic rewiring sustains liver cancer cell proliferation and survival. (A) Representative images of Huh-7 cell morphology under treatments with Fru and cisplatin (Cis, 22 μM) (scale bar 1 mm; original magnification 100×); (B) Dot plots of the cellular positive subset to propidium iodide (PE-CF594-A); (C) Percentage of cell death determined by flow cytometry using propidium iodide staining; (D) Spheroid formation on Huh-7 treated with fructose (Fru) (scale bar 1 mm); (E) Spheroid number and (F) size in Huh-7 cell line treated with fructose; (G) Spheroid formation on HepG2 treated with fructose (scale bar 1 mm); (H) Spheroid number; and (I) size in HepG2 cell line treated with Fru quantification of the rate of gap closure; (J) Wound-healing assay to address Huh-7 cells migration with High Glc media; (K) Wound-healing assay to address Huh-7 cells migration with Low Glc media; (L) Gap closure quantification. Treatments: for the spheroids assay, we used fructose at 1 mM for 48 h; for the wound-healing assay, we used 1 mM of fructose in DMEM complete media with High Glc (11 mM) or Low Glc (0.4 mM). Images are representative of at least three independent experiments. * p ≤ 0.05, ** p ≤ 0.01, *** p ≤ 0.001, **** p ≤ 0.0001
Fru treatment significantly increased spheroid number and size in the Huh-7 cell line; spheroids’ phenotype presented less compaction, probably suggesting an increment in cellular scattering (Figure 6D and 6F). Although HepG2 cells presented less spheroid formation due to their nature, we observed similar findings to Huh-7 cells (Figure 6G–6I). To gain evidence of cell migration, suggested by the irregular borders observed in spheroids, we conducted a wound-healing assay demonstrating that Fru treatment enhanced wound closure in both Huh-7 (Figure 6J–6L) and HepG2 cells (Figure S3A–3C) compared to the control group. In addition, we tested the hypothesis that Fru treatment promoted resistance to starvation and evaluated the migratory capacity in both cell lines using Low Glc media. The cells treated with Fru demonstrated enhanced survival and migration capabilities. Conversely, the NT cells exhibited a notable decline in migration and started to detach from the plate after 72 h of treatment (Figure 6K and 6L, Figure S3B and C). These findings demonstrate that liver cancer cells can use Fru metabolism to facilitate tumorigenesis, enhancing their survival potential in response to therapeutic interventions.
Metabolic rewiring enhances the chemoresistance capacity in vivo
To corroborate the in vitro findings, we employed the in vivo model of the chick CAM model. Two days before cell inoculation, Huh-7 cells were treated with Fru. On EDD10, 2 × 10⁶ cells were inoculated. Two days before completing the treatments (EDD15), the tumors were treated with Fru (1 mM), CDDP (100 μM), or a combination of CDDP and Fru.
Tumor growth under Fru treatment exhibits a prominent vascularization regarding the NT (Figure 7A). The size of the tumors is significantly increased in Fru-treated compared with NT and CDDP-induced good toxicity, but this was impaired by Fru treatment (Figure 7B and 7C). The tumor capacity remained consistent across all treatment groups (Figure 7D). However, the Fru-treated cells exhibited a significant tendency for embryo death compared to the NT cells (Figure 7E). As previously shown, the results are associated with the observed differences in cell migration capacity. In addition, Fru promoted the formation of larger tumors compared to NT. In line with our earlier observations, Fru treatment enhanced cell survival in the presence of CDDP. Our results indicate that Fru plays a critical role in the aggressiveness of HCC cells in vitro and in vivo, revealing the underlying causes of therapy failure.
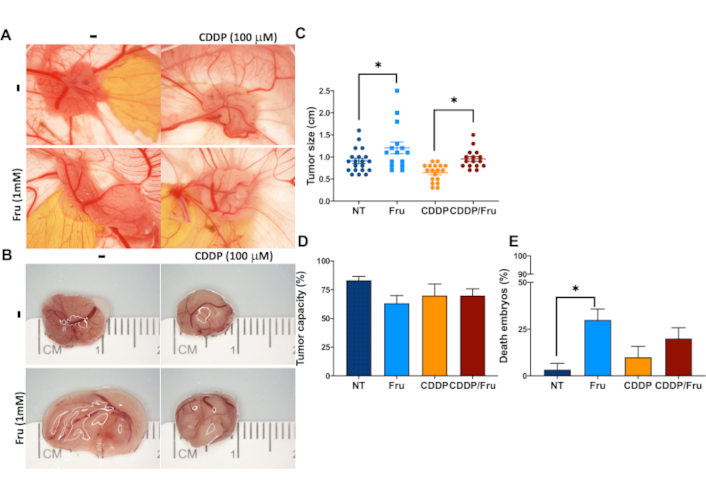
Fructose treatment confers chemoresistance to the Huh-7 cell line in vitro and in vivo. (A) Photographs of CAM tumors in situ (upper row) and (B) Gross inspection of excised CAM tumors 7 days after inoculating the Huh-7 cells; (C) Tumor size; (D) Tumor capacity; (E) Embryo death. Treatments: NT: non-treated cells; Fru: fructose-treated cells (1 mM); CDDP: cisplatin 100 μM; Fru/CDDP: fructose-treated cells plus cisplatin 100 μM; CAM: chorioallantoic membrane. Images are representative of at least three independent experiments. * p ≤ 0.05
Discussion
HCC is the third leading cause of death worldwide [29]. During the last decade, the burden and etiology of liver diseases have changed, placing MASH, the inflammatory state of MASLD, as the leading cause of incidence and death of HCC [8], and it has been estimated that approximately 15% and 19% of this population could develop a MASH-HCC [30].
The consumption of ultra-processed food enriched with added sugars has been related to the development of MASLD: hepatic steatosis, the progression to MASH until the appearance of HCC [5, 7, 14, 21]. One of the primary sweeteners used in the food market is HFCS, and among its main components is Fru, representing between 42% and 65% of the product’s composition. Fru consumption contributes to the onset and development of MASLD by serving as a highly lipogenic metabolite [4, 14, 31, 32]. In murine models, high-fat and Fru-enriched diets have been demonstrated to promote insulin resistance, obesity, hypertriglyceridemia, liver steatosis, fibrosis, and HCC [5, 33]. These changes occur in conjunction with fat-enriched diets, but the consumption of a diet that is high in Fru has also been demonstrated to enhance the formation of liver tumors [21].
One advantage of cancer cells is metabolic reprogramming, which enables the transformed cell to survive, proliferate, and disseminate to other tissues. Fru plays a role in the metabolic reprogramming of cancer cells [6]. Fru metabolism induces a switch from the KHK-C to the KHK-A isoform [11]. In normal liver cells, KHK has a high content and activity, and it is related to the initial stages of MASLD [6]. However, in cancer cells, KHK-A has higher expression, and due to the isoform change, there are lower levels of Fru-1-phosphate, uric acid, and ROS [11]. Instead, KHK-A facilitates nucleic acid synthesis by directly phosphorylating the phosphoribosyl pyrophosphate synthetase 1 (PRPS1) and activating the antioxidant response through p62 phosphorylation and Nrf2 activation, which contributes to HCC progression [10, 11, 13, 34].
Our findings indicate that Fru treatment drives a metabolic adaptation exacerbating aggressiveness, characterized by increased proliferation, survival, and chemoresistance. This may be associated with the elevated expression of KHK-A isoform in Huh-7, which is consistent with findings in esophageal cancer [34]. This evidence supports the premise that Fru may protect cells against the damaging effects of ROS and the subsequent damages triggered by oxidative stress, which can lead to the development of HCC, as shown in our results and other works [11].
Cells treated with Fru undergo a metabolic shift towards a reverse Warburg effect [35]. The canonical Warburg effect is based on the reduction of pyruvate’s mitochondrial oxidation and the enhancement of glycolysis, resulting in increased lactate and ATP production [35]. However, because Fru metabolism induces cellular stress, they need to reorganize their metabolism to achieve the non-canonical Warburg effect, directing glycolysis towards the stromal cells while continuing the substrate oxidation through mitochondria. Considering these findings, our data demonstrates that cells treated with Fru exhibited a reduction in glycolysis support compared to non-treated cells. Metabolic adaptation drives non-canonical functions of the KHK-A and intermediate metabolites, resulting in a deviation from the alternative pathways that support the tumorigenic properties in other tumors [10, 11, 13, 34]. Considering this, we observed a correlation between the reduction in lactate production and the activation of the PPP in Fru-treated cells. Huh-7 cells exhibited enhanced NADPH production, and the inhibition of glutathione reductase abolished the benefits conferred by Fru treatment, highlighting the pivotal role of this pathway in this context.
The metabolic reprogramming induced by Fru was observed to contribute less to glycolysis compared to non-treated cells. Based on these observations, Fru treatment may induce cell death. Notably, Dewdney and colleagues [16] have proposed that Fru reduces the HCC cells’ aggressiveness through cell death induction. However, our data and evidence previously published indicate this is not the case [10, 11, 13, 36]. Remarkably, liver cancer cells could not survive without Glc, even when Fru was present in the culture media. This suggests that Fru requires the presence of Glc for optimal metabolic assimilation.
Nevertheless, when Fru is supplemented, the Low Glc concentrations available in Glc-deprived conditions can effectively preserve cellular viability and promote proliferation in these cells. These results are supported by the Fru uptake capacity of liver cells in both Glc conditions. Dewdney and colleagues [16] did not declare the presence of Glc in the treatment media when Fru was implicated. It is essential to state that Fru has been demonstrated to promote the formation and migration of spheroids, a specific feature of cancer aggressiveness, which is in line with another report [15].
Our results indicate that treatment with Fru induces death resistance in HCC cells, which is corroborated by both in vitro and in vivo evidence and aligns with a recent report on colorectal cancer [20]. These findings are promising, as previous research has indicated that sucrose can prevent cisplatin-induced fatigue [37]. On the other hand, dietary modulation may prove advantageous for chemotherapy, radiotherapy, and immunotherapy, potentially leading to enhanced outcomes [38]. Metabolic modulation of the tumor microenvironment could also be a means of improving results. It is crucial to highlight the function of Fru in rescuing cells from starvation and fasting conditions, as evidenced by our findings. This could present a significant challenge for health professionals in recommending an appropriate diet for HCC patients. Fru may enhance cancer cells’ survival and contribute to therapy failure in HCC patients.
In conclusion, we demonstrate that Fru promotes metabolic remodeling, leading to the sustained proliferation of liver cancer cells. Fru metabolism enhances alternative metabolic pathways that contribute to cancer aggressiveness. Moreover, Fru favors cell survival and reduces the efficacy of chemotherapy. Further, in vivo studies are needed to complete the metabolic rewiring in mice and humans.
Abbreviations
| 1-NBDF: | 1-deoxy-1-[(7-nitro-2,1,3-benzoxadiazol-4-yl)amino]-D-fructose |
| CAM: | chorioallantoic membrane |
| CDDP: | cis-diaminplatin (II)-dichloride |
| DHE: | dihydroethidium |
| ECAR: | extracellular acidification rate |
| EDD: | embryonic developmental day |
| FBS: | fetal bovine serum |
| Fru: | fructose |
| G6PD: | glucose-6-phosphate dehydrogenase |
| Glc: | glucose |
| Gln: | glutamine |
| HCC: | hepatocellular carcinoma |
| HFCS: | high fructose corn syrup |
| High Glc: | DMEM with high glucose (11 mM) |
| KHK-C: | ketohexokinase C |
| Low Glc: | DMEM with low glucose (0.4 mM) |
| MASH: | metabolic dysfunction-associated steatohepatitis |
| MASLD: | metabolic dysfunction-associated steatotic liver disease |
| NT: | non treated |
| OCR: | oxygen consumption rate |
| PPP: | pentose phosphate pathway |
| ROS: | reactive oxygen species |
Supplementary materials
The supplementary materials for this article are available at: https://www.explorationpub.com/uploads/Article/file/100572_sup_1.pdf.
Declarations
Author contributions
LCR: Conceptualization, Investigation, Formal analysis, Validation, Writing—original draft, Writing—review & editing. AEC, VJ, and JM: Investigation, Validation, Writing—review & editing. MB and ND: Methodology, Resources. MVM: Resources. VSA, LBO, and RUML: Methodology, Writing—review & editing. APA: Methodology, Resources, Writing—review & editing. MCGR: Conceptualization, Funding acquisition, Writing—review & editing. DFC: Conceptualization, Writing—review & editing. LEGQ: Conceptualization, Funding acquisition, Resources, Supervision, Project administration, Writing—original draft, Writing—review & editing.
Conflicts of interest
Luis E. Gomez-Quiroz, a member of the Editorial Board of Exploration of Digestive Diseases, had no involvement in the decision-making or the review process of this manuscript. The other authors declare no conflicts of interest.
Ethical approval
The Ethical Academic Commission approved this study of the CBS division, Universidad Autónoma Metropolitana-Iztapalapa (UAM-I), number CECBS22-02.
Consent to participate
Not applicable.
Consent to publication
Not applicable.
Availability of data and materials
The data supporting this study’s findings are available from the corresponding author on reasonable request.
Funding
This work was partially funded by a grant from the Consejo Nacional de Ciencia y Tecnología (CONACYT): [Fronteras de la Ciencia 1320], [Infra-2017 280788], and Universidad Autónoma Metropolitana-Iztapalapa (UAM-I). The funders had no role in study design, data collection and analysis, decision to publish, or preparation of the manuscript.
Copyright
© The Author(s) 2025.
Publisher’s note
Open Exploration maintains a neutral stance on jurisdictional claims in published institutional affiliations and maps. All opinions expressed in this article are the personal views of the author(s) and do not represent the stance of the editorial team or the publisher.