
Abstract
Aim:
To evaluate the prediction ability for quantitative computed tomography (QCT)-based metabolic dysfunction-associated fatty liver disease (MAFLD) of four widely known hepatic steatosis algorithms, namely the fatty liver index (FLI), the hepatic steatosis index (HSI), the Framingham Steatosis index (FSI) and the Zhejiang University index (ZJU index).
Methods:
From July 2020 to June 2022, health checkup subjects who accepted liver fat quantification with QCT at the Health Management Center of the Second Affiliated Hospital of Chongqing Medical University were recruited in this study. MAFLD was diagnosed by using QCT-based liver fat quantification. The prediction performance of FLI, HSI, FSI, and ZJU index on MAFLD was evaluated using the area under the receiver operating characteristic curve (AUC).
Results:
Of a total of 4,566 subjects enrolled in this study, 48.7% were diagnosed with MAFLD. The AUC values of FLI, HSI, FSI, and ZJU index were 0.819, 0.792, 0.822 and 0.826, respectively. FLI exhibited the highest sensitivity (SN) of 79.42%, while the ZJU index demonstrated the highest specificity (SP) of 75.35%.
Conclusions:
All four indices (FLI, HSI, FSI, and ZJU index) have acceptable predictive performance for patients with QCT-based MAFLD. Our study suggests that the above indices have a stable ability for detecting MAFLD.
Keywords
Metabolic dysfunction-associated fatty liver disease, hepatic steatosis, quantitative computed tomography, validation studyIntroduction
Metabolic dysfunction-associated fatty liver disease (MAFLD) has emerged as the most prevalent chronic liver disease globally [1, 2]. It can progress from slight hepatic steatosis to advanced cirrhosis and even hepatocellular carcinoma [3, 4]. Furthermore, MAFLD is a multi-systemic metabolic disease that encompasses various extrahepatic complications [5], including cardiovascular (CV) disease [6], chronic kidney disease [7], extrahepatic malignancies [8], osteoporosis [9], and cognitive disorders [10]. Given the increasing prevalence of obesity and diabetes, MAFLD has become a significant global public health concern. Early identification of MAFLD facilitates timely interventions before irreversible health consequences arise.
According to guidelines [11], the diagnosis of MAFLD is based on histological biopsy, imaging, or blood biomarker evidence of fat accumulation in the liver (hepatic steatosis), along with one of the following three conditions: 1) overweight/obesity, 2) type 2 diabetes mellitus (T2DM), or 3) evidence of metabolic dysregulation. However, liver biopsy and imaging are not always feasible or accessible when applied to diagnose hepatic steatosis in large-scale populations. Therefore, many indicators based on serum biomarkers for predicting MAFLD have been developed over the past few years, such as the fatty liver index (FLI) [12], the hepatic steatosis index (HSI) [13], the Framingham Steatosis index (FSI) [14], and the Zhejiang University index (ZJU index) [15]. Several validation studies utilizing ultrasonography (US) and computed tomography (CT) have demonstrated that the above four algorithms have satisfactory prediction ability in detecting MAFLD [16–18].
Recently, quantitative CT (QCT) has been employed for the assessment of fatty liver [19]. It is derived from traditional CT imaging and is initially used for bone mineral density measurement. Based on routine clinical chest and abdominal CT scans, QCT can simultaneously measure liver fat content while assessing vertebral bone mineral density in the thoracic and lumbar spine without increasing radiation dosage. The liver fat quantitative principle of QCT involves determining the X-ray attenuation value of specific regions of interest (ROIs) in liver tissue and converting it into the volume ratio of pure fat to pure liver tissue using phantom conversion and formulas [20]. By calculating the liver fat fraction β (%), QCT has been validated to provide an intuitive and accurate estimation of hepatic steatosis. Moreover, the adjusted QCT-β (%) is comparable to proton density fat fraction (PDFF) measured via magnetic resonance imaging (MRI) [21], which is currently the most accurate noninvasive technique for liver fat quantification [3]. The QCT adopts the same grading criteria as MRI-PDFF, that is, the liver fat content (β or PDFF < 5%) is normal; the liver fat content (β or PDFF ≥ 5%, ≥ 14% and ≥ 28%) suggests mild, moderate, to severe fatty liver, respectively [21]. Thus, liver QCT can serve as an alternative to liver US or MRI in diagnosing MAFLD. Clinical applications of the QCT technique in MAFLD diagnosis have been reported [22]. However, the aforementioned steatosis algorithms, which were validated using US-based MAFLD, have not been evaluated using QCT-based MAFLD.
Therefore, we used liver QCT to measure the liver fat content and diagnosis of MAFLD. Based on that diagnosis, the prediction ability of four widely used hepatic steatosis indices, namely the FLI, HSI, FSI, and ZJU index on MAFLD was evaluated.
Materials and methods
Subjects
A cross-sectional analysis was conducted using health examination data collected from the Health Management Center of the Second Affiliated Hospital of Chongqing Medical University. The participants voluntarily selected a chest and abdominal CT scan due to concerns about age-related abnormal bone mineral density. Their liver scan images were collected at the same time without adding extra exposures of X-rays to subjects. The research was approved as Clinical Trial 2020261 by the Ethics Committee of the Second Affiliated Hospital of Chongqing Medical University, and all subjects signed an informed consent form.
Liver fat QCT assessment
CT was performed using a 64-detector row scanner (Siemens, SOMATOM go. Top, Germany). The scan parameters aligned with our previous study [23]. The scanning and computational processes were carried out as described by Guo et al. [21]. Four ROIs with a cross-sectional area of 290–310 mm2 and a slice thickness of 1 mm were manually selected on the automatically reconstructed 3D images. The average measurements of four ROIs were calculated to determine the liver fat fraction, denoted as β (%).
Anthropometric and biochemical examinations
Height and weight were measured using the Omron body scale (Omron HNH-219, Nanjing, China). Body mass index (BMI) was calculated as the weight (in kilograms) divided by the square of height (in meters). Waist circumference (WC) was defined as the circumference of the midpoint line between the lower edge of the costal arch and the upper edge of the iliac crest. Systolic blood pressure (SBP) and diastolic blood pressure (DBP) were measured using the Omron blood pressure monitor (Omron HBP-1320, Dalian, China). Fasting blood samples were collected for biochemical analysis. Aspartate aminotransferase (AST), alanine aminotransferase (ALT), gamma-glutamyl transferase (GGT), high-density lipoprotein cholesterol (HDL-C), triglyceride (TG), fasting plasma glucose (FPG), serum uric acid (SUA) and serum creatinine (SCr) levels were measured using a Hitachi automated biochemical analyzer (Hitachi 7600, Tokyo, Japan).
Definitions of MAFLD
The diagnosis of MAFLD was established on the existence of hepatic steatosis in combination with one of the following three conditions, 1) overweight/obesity (defined as BMI ≥ 23 kg/m2 for the Asian population), or 2) T2DM, or 3) evidence of metabolic dysregulation [11]. Metabolic dysregulation was defined as the appearance of at least two metabolic risk abnormalities, including (1) BP ≥ 130/80 mmHg or under anti-hypertensive treatment; (2) WC ≥ 90/80 cm for males and females; (3) TG levels ≥ 1.70 mmol/L or specific drug therapy; (4) pre-diabetes, indicated by FPG levels of 5.6–6.9 mmol/L; (5) low levels of HDL-C < 40 mg/dL (< 1.0 mmol/L) for men and < 50 mg/dL (< 1.3 mmol/L) for women or on specific drug treatment.
Hepatic steatosis was defined as liver fat fraction β ≥ 5% by QCT in this study. Diabetes was defined as patients with a history of diabetes or FPG levels higher than 7.0 mmol/L [24]. Hypertension was defined as subjects with BP ≥ 130/80 mmHg or those already receiving hypertension medication.
Formulae for 4 indices
FLI = (e0.953 * loge (TG) + 0.139 * BMI + 0.718 * loge (GGT) + 0.053 * WC – 15.745) / (1 + e0.953 * loge (TG) + 0.139 * BMI + 0.718 * loge (GGT) + 0.053 * WC – 15.745) * 100, TG (mg/dL), BMI (kg/m2), GGT (U/L), WC (cm) [12]
HSI = 8 * (ALT / AST ratio) + BMI +2 (if female) +2 (if diabetes mellitus) [13]
FSI = 1 / (1 + exp(−x)) * 100, where x = −7.981 + 0.011 * age (years) − 0.146 * sex (female = 1, male = 0) + 0.173 * BMI (kg/m2) + 0.007 * TG (mg/dL) + 0.593 * hypertension (yes = 1, no = 0) + 0.789 * DM (yes = 1, no = 0) + 1.1 * ALT : AST ratio ≥ 1.33 (yes = 1, no = 0) [14]
ZJU index = BMI + FPG (mmol/L) + TG (mmol/L) + 3 * ALT (U/L) / AST (U/L) +2 (if female) [15]
Statistical analysis
Categorical and continuous variables were compared between participants with and without MAFLD using the χ2 test and the Mann-Whitney U-test, respectively. The diagnostic accuracy was evaluated by determining the areas under the receiver operating characteristic curve (AUCs) with a 95% confidence interval (CI). The AUC values were categorized as “poor” (0.5 < AUC < 0.7), “acceptable” (0.7 ≤ AUC < 0.8), “excellent” (0.8 ≤ AUC < 0.9), or “outstanding” (0.9 ≤ AUC < 1) based on guidelines by Hosmer and Lemeshow’s guidelines [25]. Optimal cut-offs were determined at the highest value of Youden’s J statistic. Simultaneously, sensitivity (SN), specificity (SP), positive predictive value (PPV,) and negative predictive value (NPV) were calculated. Pairwise comparisons between AUC values of different steatosis indices were performed using the method of DeLong et al. [26]. Additionally, a higher QCT-β (%) cut-off value (≥ 6%) was applied as a diagnostic criterion for hepatic steatosis in sensitivity analysis. All statistical analyses were conducted using MedCalc 20.0 (MedCalc Software Ltd., Ostend, Belgium) and SPSS 25.0 (IBM Corp, Armonk, NY, USA). A two-tailed P-value below 0.05 was considered statistically significant.
Results
Participant selection
After excluding subjects with missing anthropometric or biochemical data and unclear QCT imaging (N = 1,078, 19.1%), 4,566 subjects were included in the study. Among them, 2,225 participants (48.7%) were diagnosed with MAFLD (Figure 1).
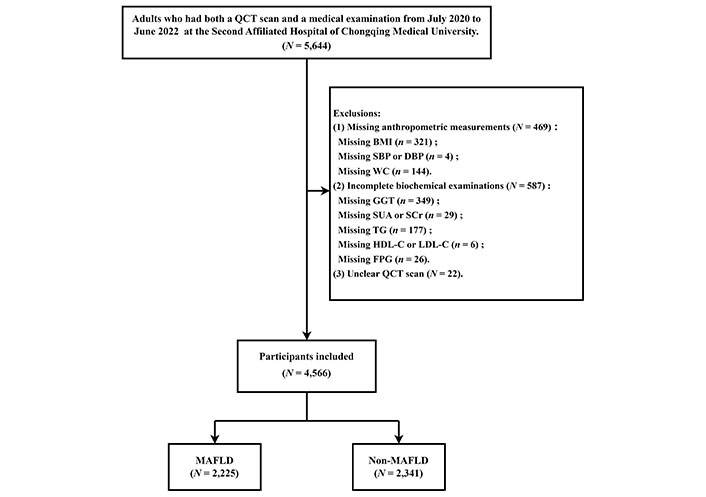
Flowchart of selection of participants. QCT: quantitative computed tomography; BMI: body mass index; SBP: systolic blood pressure; DBP: diastolic blood pressure; WC: waist circumference; GGT: gamma-glutamyl transferase; SUA: serum uric acid; SCr: serum creatinine; TG: triglyceride; HDL-C: high-density lipoprotein cholesterol; LDL-C: low-density lipoprotein cholesterol; FPG: fasting plasma glucose; MAFLD: metabolic dysfunction-associated fatty liver disease
Characteristics of participants
Among study subjects, the mean age was 53.2 years, with 43.6% being female; 48.7% were diagnosed with MAFLD (57.5% for men and 37.4% for women). Participants with MAFLD were typically older, and more likely to be men, with a higher prevalence of diabetes (15.0%) and hypertension (64.2%) compared to those without MAFLD. Several anthropometric and biochemical parameters were significantly different between the MAFLD and non-MAFLD groups. The MAFLD group had higher values of BMI, WC, SBP, DBP, TG, low-density lipoprotein cholesterol (LDL-C), FPG, ALT, AST, GGT, SUA, SCr, and liver fat fraction β (%), while the HDL-C level was lower (all P < 0.001). Furthermore, the MAFLD group had higher FLI, HSI, FSI, and ZJU index scores. The characteristics of subjects categorized according to the presence or absence of MAFLD were summarized in Table 1.
Characteristics of the study population
| Characteristics | Total | Non-MAFLD | MAFLD | P-value |
|---|---|---|---|---|
| (N = 4,566, 100%) | (N = 2,341, 51.3%) | (N = 2,225, 48.7%) | ||
| Demographic characteristics | ||||
| Male, n (%) | 2,574 (56.4%) | 1,095 (46.8%) | 1,479 (66.5%) | < 0.001 |
| Female, n (%) | 1,992 (43.6%) | 1,246 (53.2%) | 746 (33.5%) | < 0.001 |
| Age (years) | 52 (47–58) | 51 (46–57) | 54 (48–59) | < 0.001 |
| Hypertension | 2,295 (50.3%) | 867 (37.0%) | 1,428 (64.2%) | < 0.001 |
| Diabetes | 442 (9.7%) | 108 (4.6%) | 334 (15.0%) | < 0.001 |
| Anthropometric variables | ||||
| BMI (kg/m2) | 24.0 (22.1–26.0) | 22.5 (21.0–24.2) | 25.5 (23.9–27.3) | < 0.001 |
| WC (cm) | 82 (75–89) | 77 (72–83) | 87 (82–92) | < 0.001 |
| SBP (mmHg) | 124 (113–137) | 119 (109–131) | 130 (118–142) | < 0.001 |
| DBP (mmHg) | 75 (67–83) | 72 (65–79) | 78 (70–86) | < 0.001 |
| Biochemical examinations | ||||
| TG (mmol/L) | 1.46 (1.03–2.11) | 1.20 (0.90–1.66) | 1.80 (1.28–2.64) | < 0.001 |
| HDL-C (mmol/L) | 1.28 (1.10–1.51) | 1.39 (1.19–1.63) | 1.19 (1.03–1.38) | < 0.001 |
| LDL-C (mmol/L) | 2.84 (2.36–3.38) | 2.81 (2.34–3.30) | 2.88 (2.41–3.46) | < 0.001 |
| FPG (mmol/L) | 5.08 (4.73–5.57) | 4.94 (4.65–5.30) | 5.26 (4.83–5.93) | < 0.001 |
| ALT (U/L) | 20 (14–28) | 17 (13–23) | 23 (17–32) | < 0.001 |
| AST (U/L) | 21 (17–25) | 20 (17–23) | 22 (18–26) | < 0.001 |
| GGT (U/L) | 23 (16–38) | 19 (14–28) | 29 (20–46) | < 0.001 |
| SUA (umol/L) | 354.9 (293.3–421.7) | 326.0 (275.3–390.0) | 385.1 (324.8–450.9) | < 0.001 |
| SCr (umol/L) | 65.2 (54.1–76.6) | 62.6 (52.9–73.9) | 68.2 (56.0–79.0) | < 0.001 |
| Imaging assessment | ||||
| β (%) | 6.1 (3.8–9.1) | 3.9 (2.5–5.2) | 8.7 (6.6–12.3) | < 0.001 |
| Index calculation | ||||
| FLI | 32.30 ± 25.08 | 19.62 ± 18.48 | 45.65 ± 24.16 | < 0.001 |
| HSI | 33.46 ± 4.97 | 31.22 ± 4.25 | 35.82 ± 4.57 | < 0.001 |
| FSI | 23.11 ± 22.92 | 12.74 ± 14.45 | 34.01 ± 25.03 | < 0.001 |
| ZJU index | 35.44 ± 4.75 | 33.06 ± 3.55 | 37.94 ± 4.57 | < 0.001 |
Continuous variables were displayed as median (with inter-quartile range) and categorical variables were represented as counts (with percentages). The scores of the four indices were expressed as mean ± standard deviation. The χ2 test and the Mann-Whitney U-test were respectively used to compare categorical and continuous variables according to the absence or presence of MAFLD. A P-value < 0.05 indicated a statistically significant difference between the non-MAFLD group and the MAFLD group. MAFLD: metabolic dysfunction-associated fatty liver disease; BMI: body mass index; WC: waist circumference; SBP: systolic blood pressure; DBP: diastolic blood pressure; TG: triglyceride; HDL-C: high-density lipoprotein cholesterol; LDL-C: low-density lipoprotein cholesterol; FPG: fasting plasma glucose; ALT: alanine aminotransferase; AST: aspartate aminotransferase; GGT: gamma-glutamyl transferase; SUA: serum uric acid; SCr: serum creatinine; FLI: fatty liver index; HSI: hepatic steatosis index; FSI: Framingham Steatosis index; ZJU index: Zhejiang University index
Prediction performance of the hepatic steatosis indices on MAFLD
The AUCs of FLI, HSI, FSI, and ZJU index for identifying MAFLD among all participants were 0.819 (95% CI: 0.807–0.830), 0.792 (95% CI: 0.779–0.804), 0.822 (95% CI: 0.810–0.833) and 0.826 (95% CI: 0.814–0.836), respectively. Thus, the HSI had an acceptable discriminative ability for detecting MAFLD, whereas the FLI, FSI, and ZJU index had excellent discriminative ability. Pairwise comparisons between AUC values among these indices indicated that the diagnostic performance of HSI was statistically inferior to that of FLI, FSI, and ZJU index. The false positive rates were plotted against the sensitivities of these indices (Figure 2). ZJU index seemed to show the highest diagnostic performance, however, the AUC values of FLI, FSI, and ZJU index were relatively close.
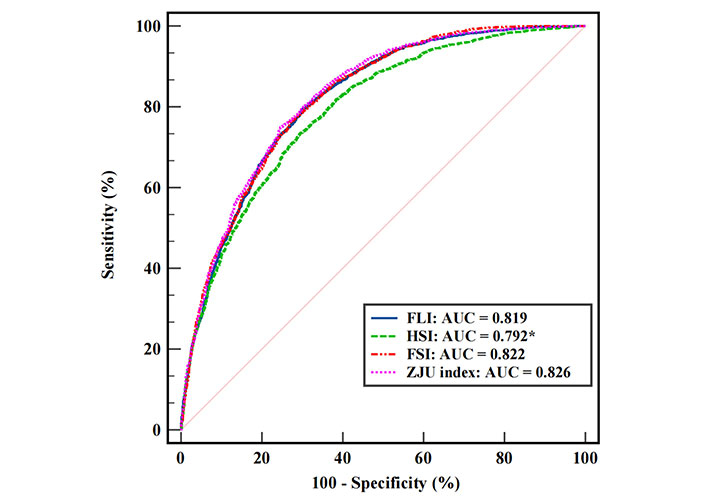
Receiver operating characteristic curves of FLI, HSI, FSI, and ZJU index. The asterisk (*) means a statistically lower AUC than the other three. FLI: fatty liver index; HSI: hepatic steatosis index; FSI: Framingham Steatosis index; ZJU index: Zhejiang University index; AUC: area under the receiver operating characteristic curve
Optimal cut-off points
The prediction accuracy of four indices at different cut-off points is listed in Table 2. The AUC values at the traditional cut-off points were significantly inferior to those at the new cut-off points obtained in the study population. For FLI and FSI, the optimal cut-off points at FLI > 22.4 and FSI > 13.6 demonstrated higher SN of 79.42% and 76.13%, respectively. As for the HSI and ZJU index, the traditional dual diagnostic criteria (HSI < 30 or ZJU index < 32 rules out hepatic steatosis; HSI > 36 or ZJU index > 38 suggests fatty liver) provided a relatively high SN or SP (close to 90% and even over) for MAFLD prediction. In this study, when using single cut-off points obtained at the highest Youden’s J statistic, FLI had the highest SN of 79.42%, and the ZJU index had the highest SP of 75.35%.
Comparison of the prediction accuracy of the optimal cut-off points
| Indices | Cut-off point | AUC (95% CI) | SN (%) | SP (%) | PPV (%) | NPV (%) | Youden’s J statistic |
|---|---|---|---|---|---|---|---|
| FLI | |||||||
| Traditional | < 30 | 0.735 (0.721–0.747) | 68.22 | - | 75.26 | 72.26 | 46.90 |
| > 60 | 0.623 (0.609–0.637) | - | 94.53 | 83.92 | 58.70 | 24.55 | |
| New | > 22.4 | 0.819 (0.807–0.830) | 79.42 | 69.88 | 71.48 | 78.13 | 49.30 |
| HSI | |||||||
| Traditional | < 30 | 0.668 (0.654–0.681) | 92.58 | - | 59.85 | 85.32 | 33.55 |
| > 36 | 0.667 (0.653–0.681) | - | 89.83 | 80.30 | 62.63 | 33.43 | |
| New | > 32.9 | 0.792 (0.779–0.804) | 73.17 | 70.74 | 70.39 | 73.50 | 43.91 |
| FSI | |||||||
| Traditional | > 23 | 0.701 (0.687–0.714) | 54.43 | 85.73 | 78.38 | 66.44 | 40.16 |
| New | > 13.6 | 0.822 (0.810–0.833) | 76.13 | 73.17 | 72.95 | 76.34 | 49.30 |
| ZJU index | |||||||
| Traditional | < 32 | 0.684 (0.670–0.697) | 95.87 | - | 60.67 | 91.24 | 36.79 |
| > 38 | 0.667 (0.653–0.680) | - | 91.88 | 82.91 | 62.28 | 33.32 | |
| New | > 34.9 | 0.826 (0.814–0.836) | 74.92 | 75.35 | 74.29 | 75.97 | 50.27 |
The hyphen (-) was used to conceal data that were not necessary in that comparison. AUC: area under the receiver operating characteristic curve; 95% CI: 95% confidence interval; SN: sensitivity; SP: specificity; PPV: positive predictive value; NPV: negative predictive value; FLI: fatty liver index; HSI: hepatic steatosis index; FSI: Framingham Steatosis index; ZJU index: Zhejiang University index
Sex-specific analysis
Sex-stratified analysis revealed that the AUC of each index was generally higher in females compared to males. In males, the AUC of HSI (0.766) was similar to that of FLI (0.776), FSI (0.776), and ZJU index (0.799). However, in females, the AUC of HSI (0.811) was significantly lower than that of the other three indices. Moreover, optimal cut-off values for diagnosis differed between sexes for FLI and FSI, while the values for HSI and ZJU index were close in both males and females and aligned with traditional studies. Table 3 summarizes the prediction performance of FLI, HSI, FSI, and ZJU index in sex-specific subgroups, including AUC values, SN, SP, and 95% CI.
Prediction performance of FLI, HSI, FSI, and ZJU index in sex-specific subgroups
| Indices | Male (N = 2,574) | Female (N = 1,992) | ||||||
|---|---|---|---|---|---|---|---|---|
| AUC (95% CI) | Cut-off | SN (%) | SP (%) | AUC (95% CI) | Cut-off | SN (%) | SP (%) | |
| FLI | 0.776 (0.760–0.792) | 32.4 | 76.11 | 65.31 | 0.850 (0.834–0.865) | 15.5 | 77.08 | 76.81 |
| HSI | 0.766 (0.749–0.782) | 32.9 | 74.98 | 65.57 | 0.811 (0.793–0.828) | 31.6 | 84.32 | 63.16 |
| FSI | 0.776 (0.760–0.792) | 15.3 | 78.97 | 61.92 | 0.852 (0.836–0.867) | 9.9 | 77.61 | 76.81 |
| ZJU index | 0.799 (0.783–0.814) | 34.4 | 79.24 | 66.48 | 0.852 (0.836–0.868) | 34.9 | 77.08 | 78.73 |
AUC: area under the receiver operating characteristic curve; 95% CI: 95% confidence interval; SN: sensitivity; SP: specificity; FLI: fatty liver index; HSI: hepatic steatosis index; FSI: Framingham Steatosis index; ZJU index: Zhejiang University index
Age-stratified analysis
The predicting power of the indices showed a decreasing trend with increasing age but remained acceptable (AUC > 0.7). All four indices had excellent prediction performance in individuals aged < 50 years. In the age-stratified analysis, there were minimal differences among the AUC values of the indices, except for HSI which had a significantly lower AUC in the subgroup aged ≥ 50 years with a predictive value of 0.774. Furthermore, the age-stratified analyses yielded similar results, with the optimal cut-off values for FLI and FSI varying among age subgroups, while the cut-off values for HSI and ZJU index were relatively close and comparable to those in traditional studies. Table 4 presented the prediction performance of FLI, HSI, FSI, and ZJU index in age-stratified subgroups.
Prediction performance of FLI, HSI, FSI, and ZJU index in age-stratified subgroups
| Indices | Age < 50 (N = 1,655) | Age ≥ 50 (N = 2,911) | ||||||
|---|---|---|---|---|---|---|---|---|
| AUC (95% CI) | Cut-off | SN (%) | SP (%) | AUC (95% CI) | Cut-off | SN (%) | SP (%) | |
| FLI | 0.840 (0.822–0.858) | 26.7 | 72.87 | 79.81 | 0.804 (0.789–0.818) | 22.5 | 80.41 | 66.98 |
| HSI | 0.827 (0.808–0.845) | 33.0 | 75.28 | 73.29 | 0.774 (0.758–0.789) | 32.9 | 72.39 | 69.57 |
| FSI | 0.843 (0.825–0.860) | 10.0 | 79.12 | 73.61 | 0.806 (0.792–0.821) | 13.6 | 79.29 | 67.55 |
| ZJU index | 0.851 (0.833–0.868) | 35.0 | 73.58 | 80.23 | 0.808 (0.793–0.822) | 35.0 | 75.28 | 72.88 |
AUC: area under the receiver operating characteristic curve; 95% CI: 95% confidence interval; SN: sensitivity; SP: specificity; FLI: fatty liver index; HSI: hepatic steatosis index; FSI: Framingham Steatosis index; ZJU index: Zhejiang University index
Sensitivity analysis
When applying QCT-β ≥ 6% as the diagnostic criterion for hepatic steatosis, 41.4% of the participants (1,892 / 4,566) were diagnosed with MAFLD. The AUC values of the four indices saw a slight reduction but still showed similar prediction accuracy as before adjusting the β cut-off value. The predictive performance parameters of the four steatosis indices are shown in Table 5.
Prediction performance of FLI, HSI, FSI, and ZJU index for MAFLD based on QCT-β ≥ 6%
| Indices | AUC (95% CI) | Cut-off | SN (%) | SP (%) |
|---|---|---|---|---|
| FLI | 0.810 (0.798–0.821) | 27.0 | 75.26 | 71.91 |
| HSI | 0.782 (0.770–0.794)* | 33.4 | 70.98 | 70.57 |
| FSI | 0.812 (0.800–0.823) | 13.6 | 78.75 | 68.89 |
| ZJU index | 0.810 (0.799–0.822) | 35.0 | 76.90 | 70.57 |
The asterisk (*) means a statistically lower AUC than the other three. AUC: area under the receiver operating characteristic curve; 95% CI: 95% confidence interval; SN: sensitivity; SP: specificity; FLI: fatty liver index; HSI: hepatic steatosis index; FSI: Framingham Steatosis index; ZJU index: Zhejiang University index
Discussion
The diagnosis of MAFLD typically involves evidence of fat accumulation in the liver, along with indicators of metabolic dysregulation [11]. In this study, hepatic steatosis was diagnosed using QCT-based liver fat fraction β ≥ 5%. The ability of common hepatic steatosis algorithms (FLI, HSI, FSI, and ZJU index) for identifying MAFLD was validated. The results showed that the FLI, HSI, FSI, and ZJU index demonstrated acceptable performance in the present population for detecting MAFLD. In subgroup analyses, prediction accuracy for all indices decreased in the male and advanced age groups (≥ 50 years). Therefore, our findings affirmed the effectiveness of these indices in detecting the MAFLD population on a wide scale. Nonetheless, the cut-off points for the FLI (< 30 or > 60) and FSI (> 23) may need to be re-evaluated.
Non-invasive diagnosis of hepatic steatosis is eagerly awaited both in the research realm and clinical practice. US is currently a recommended diagnostic tool due to its affordability, safety, and relatively reliable repeatability [2]. However, it provides a relatively low SN in detecting slight fatty changes. Although MRI-PDFF is regarded as the gold standard for detecting liver fat, it is expensive and less widely available both in clinical and epidemiological research. This study utilized QCT for assessing steatosis. QCT, originally developed for measuring bone mineral density, can also assess soft tissue composition in non-osseous tissues like the liver [20, 27, 28]. QCT scans offer a dual benefit by providing bone mineral density values for thoracic and lumbar vertebrae in a single chest and abdominal CT scan. Simultaneously, it allows for measurement of abdominal soft tissue (such as muscle area and subcutaneous adipose tissue) and visceral fat content without additional exposure to ionizing radiation. Previous studies have reported a strong correlation and high accuracy between liver fat fraction β (%) assessed using QCT and MRI-PDFF [29–31]. Guo et al. developed QCT grading criteria for assessing steatosis and was applied in clinical practice [21]. The QCT standard was entirely equivalent to the grading criteria of MRI-PDFF. Therefore, this study was based on this criterion with β ≥ 5% as the cut-off for hepatic steatosis. In general, however, normal liver fat content in liver biopsy is defined as histological steatosis in less than 5% of hepatocytes. According to Petäjä et al. [32], 5% macroscopic steatosis corresponds to a PDFF of 6% to 6.4%, which means a QCT-β ≥ 5% in this study may lead to over-diagnosis. In this context, we applied a higher cut-off value (β ≥ 6%) for sensitivity analysis. The results revealed that the prediction accuracy of the four hepatic steatosis algorithms remained almost unchanged.
A higher prevalence of MAFLD in this study was observed compared to several similar investigations in the Chinese population (37.2% of 352,911 [33]; 40.3% of 9,927 [34]; 33.4% of 10,451 [35], respectively), despite the adoption of an elevated threshold for steatosis (QCT-β ≥ 6%). On the one hand, age distribution and sex proportion might account for the difference. The majority of our participants were 50 years or older, with a higher proportion of men and hypertension, while age, sex, and blood pressure are risk factors for adipose tissue metabolism and inflammation [36]. It is worth noting that the participants were individuals who voluntarily selected a chest and abdominal QCT scan due to concerns about age-related abnormal bone mineral density. Therefore, subjects in this study might have a high likelihood of having metabolic problems. The results indicated that it was a biased population with a notably high prevalence of metabolic disorders (72.4%, 3,309 / 4,566). On the other hand, we adopted QCT for liver fat quantitation so as to assess steatosis. Compared to other studies using US diagnosis of fatty liver, this novel imaging technology could find more potential fatty liver patients, which means that slight liver fat accumulation may be diagnosed as hepatic steatosis, thus providing the prerequisite for the diagnosis of MAFLD.
Based on QCT imaging, this study validated and compared the discriminative ability of the four non-invasive tests (FLI, HSI, FSI, and ZJU index) for MAFLD. The observations aligned with several previous validation studies [16, 17, 37–39]. The FLI, based on BMI, WC, GGT, and TG, has been recognized as a practical and cost-effective tool for screening fatty liver in large-scale epidemiology studies. Of the components, GGT is an enzyme that indicates liver damage or inflammation, even though an elevated GGT level has been confirmed not to be a specific indicator for fatty liver. Previous research reported promising predictive power of FLI, with AUC values ranging from 0.776 to 0.827 [33, 37, 40]. This study obtained similar results, confirming the accuracy of FLI in diagnosing MAFLD. In contrast, the HSI is much simpler in composition and calculation, merely incorporating the ALT / AST ratio, BMI, sex, and diabetes. The components integrate indicators of liver damage, obesity, hormones, and glucose metabolism. HSI also demonstrated good accuracy for identifying MAFLD in the present population. Consistent with the results of other previous validation studies [41, 42], the FSI and the ZJU index also exhibited excellent predicting performances. The FSI, based on age, BMI, TG, hypertension, diabetes, and ALT / AST ratio, is another predictive model for hepatic steatosis. Although external validation of FSI in Asian populations is rarely documented, this study confirmed its excellent performance in identifying MAFLD in the Chinese population. The ZJU index, developed in China [15], has been considered a powerful indicator for identifying fatty liver [43]. In previous studies involving liver biopsy, the ZJU index exhibited high accuracy in detecting steatosis, with an AUC of 0.896. While the AUC value of the ZJU index in this study was slightly lower than in prior research, changes in the prevalence of MAFLD might explain the discrepancy. The higher prevalence observed in our participants could have influenced the performance of the ZJU index compared to previous studies.
Several studies have reported a reciprocal comparison of the prediction efficacy of FLI, HSI, FSI, and ZJU index [16, 18, 44]. Obviously, the algorithms and equations differ from each other. FLI includes GGT which is associated with cardio-metabolic risk [45]. It can recognize the risk of atherosclerosis, as well as detect the onset of diabetes and chronic kidney disease [46]. The advantage of FLI and HSI lies in their simple components, however, both of them fail to comprehensively reflect various aspects of MAFLD. In contrast, the FSI and ZJU index incorporate multiple dimensions of MAFLD. Moreover, FSI has been validated to have prognostic value for detecting individuals at higher risk of CV events [47]; the ZJU index has proven valuable in identifying insulin resistance (IR) among the general population [48]. In identifying MAFLD, FLI was always the best at predicting steatosis, with the highest AUC, better than HSI and ZJU index. Shen et al. [49] compared the accuracy and externally validated clinical utility of FLI, HSI, FSI, and ZJU index for US-diagnosed hepatic steatosis in a Chinese population (N = 4,247) and concluded that the FLI had slightly better performance. In this study, however, FLI had similar performance to FSI and ZJU index, with at least no significant statistical differences being observed, suggesting their comparable utility for screening MAFLD. Therefore, our findings support the utility of the above indices as convenient, alternative non-invasive tools for detecting MAFLD.
However, the traditional cut-off values for FLI (< 30 or > 60) and FSI (> 23) were found to be inappropriate for assessing MAFLD in the current population. Relatively, the HSI < 30 or > 36 and the ZJU index < 32 or > 38 providing a near-true estimation of the risk of MAFLD seemed as expected. After all, the HSI and the ZJU index were developed based on Korean and Chinese populations, respectively, while similar BMI grading criteria were adopted for Eastern Asians. The FLI and FSI were developed based on Italian Caucasian and American populations, respectively, with limited direct application to our verification population. For the FSI, the optimal cut-off value obtained in this study (> 13.6), was lower compared to that proposed in Western populations, possibly due to a higher prevalence of central abdominal obesity and fatty liver among non-obese Asians [50]. As for the FLI, validation studies have highlighted the necessity of discussing specific cut-off points for FLI in different populations [51–53]. Huang et al. [53] indicated that the FLI threshold was 30 for middle-aged and elderly Chinese individuals. As per another investigation conducted in Taiwan [40], FLI > 35 for males and > 20 for females detected ultrasonic fatty liver with high SP. Additionally, Cho et al. [52] suggested that a cut-off value of FLI > 31 for males and > 18 for females predicted fatty liver with good accuracy. Similarly, the optimal cut-off values were found to be FLI > 32.4 for men and FLI > 15.5 for women in our study. It is believed that factors such as race, region, sex, and age may influence the accuracy of these indices. The variations in the optimal cut-off values observed in the study precisely confirmed this point.
In the context of personalized and precision healthcare, the limitations of directly applying the non-invasive algorithms to general populations should be noted. In sex-stratified analysis, the prediction performances of the four indices were better in females compared to males. Previous research has reported that sexual dimorphism plays an important role in the progress of MAFLD [54]. Compared to males, a higher incidence of MAFLD in females aged 50 years or older (especially postmenopausal women) was noticed. Along with estrogen level declines, postmenopausal females have an increased risk of steatohepatitis and advanced fibrosis [55, 56]. This might elucidate the necessity of setting a lower FLI cut-off point for females. Similarly, age is another confounding factor that affects the accuracy of the non-invasive tests [57]. In the present population, a large proportion was 50 years or older. Age-stratified analysis showed decreased prediction performances of the four indices in the advanced group (≥ 50 years), suggesting that the tests should be used carefully in elderly people. Besides, due to a lack of young adults (20 to 30 years), the study failed to provide more detailed age-stratified cut-off values.
The present study has some strengths. Firstly, we defined a diagnosis of MAFLD based on QCT imaging and physical and serum indicators. Secondly, we described the prevalence of MAFLD and metabolic disorders in the population. Additionally, four non-invasive tests (FLI, HSI, FSI, and ZJU index) were validated. It can serve as a reference for the selection of personalized medical approaches within the context of metabolic fatty liver syndromes (MFLS) and metabolic disorders. The findings contribute to the diversification of available diagnostic options and help guide healthcare professionals in adopting interventions so as to enhance the precision and efficacy of personalized healthcare strategies.
Certainly, we have to admit some limitations. Firstly, our study population was biased, drawn exclusively from a single physical examination center, restricting the generalizability of our results. Secondly, liver biopsy, the gold standard for diagnosing steatosis, was not conducted. Therefore, the necessity for further validation of QCT as a diagnostic tool represents another limitation. Considering the potential exposure to ionizing radiation, it is advisable not to frequently rely on QCT for liver fat content assessment. There is no doubt that the US remains the safest and most universally embraced primary screening method [58]. Additionally, the lack of certain metabolic markers, such as glycated hemoglobin (HbA1c) and C reactive protein (not available in our study), may have led to misclassifications. Further studies should aim to explore simpler non-invasive indicators for identifying MAFLD when biopsy and imaging tests are not available.
In conclusion, FLI, HSI, FSI, and ZJU index all demonstrated acceptable predictive ability for MAFLD. These indices can serve as useful substitute tools for screening MAFLD, but specific cut-off values may need to be determined. Further research is needed to validate and refine these indices for accurate diagnosis of MAFLD.
Abbreviations
| ALT: | alanine aminotransferase |
| AST: | aspartate aminotransferase |
| AUC: | area under the receiver operating characteristic curve |
| BMI: | body mass index |
| CI: | confidence interval |
| CT: | computed tomography |
| FLI: | fatty liver index |
| FPG: | fasting plasma glucose |
| FSI: | Framingham Steatosis index |
| GGT: | gamma-glutamyl transferase |
| HDL-C: | high-density lipoprotein cholesterol |
| HSI: | hepatic steatosis index |
| MAFLD: | metabolic dysfunction-associated fatty liver disease |
| MRI: | magnetic resonance imaging |
| PDFF: | proton density fat fraction |
| QCT: | quantitative computed tomography |
| ROIs: | regions of interest |
| SN: | sensitivity |
| SP: | specificity |
| TG: | triglyceride |
| US: | ultrasonography |
| WC: | waist circumference |
| ZJU index: | Zhejiang University index |
Declarations
Acknowledgments
We express gratitude to all staff at the Health Management Center of the Second Affiliated Hospital of Chongqing Medical University for their assistance during the data collection process.
Author contributions
BX: Formal analysis, Writing—original draft. CL: Investigation, Formal analysis. MC: Investigation, Data curation. YZ: Conceptualization, Project administration, Methodology, Supervision, Writing—review & editing. All authors read and approved the submitted version.
Conflicts of interest
The authors declare that they have no conflicts of interest.
Ethical approval
This study was approved by the Ethics Committee of the Second Affiliated Hospital of Chongqing Medical University (approval no.2020261).
Consent to participate
Informed consent was obtained from all participants prior to participation.
Consent to publication
Not applicable.
Availability of data and materials
The raw data supporting the conclusions of this article will be made available by the authors, without undue reservation.
Funding
This work is supported by the Chongqing Talents Project [cstc2021ycjhbgzxm0150] and the Chongqing Science and Technology Commission Joint Medical Project [2021MSXM057]. The funders had no role in study design, data collection and analysis, decision to publish, or preparation of the manuscript.
Copyright
© The Author(s) 2024.