Original Article

Affiliation:
Diagnostics and Metrology Laboratory, Italian National Agency for New Technologies, Energy and Sustainable Economic Development, ENEA, 00044 Frascati, Italy
Email: florinda.artuso@enea.it
ORCID: https://orcid.org/0000-0002-5704-1511
Affiliation:
Diagnostics and Metrology Laboratory, Italian National Agency for New Technologies, Energy and Sustainable Economic Development, ENEA, 00044 Frascati, Italy
Affiliation:
Diagnostics and Metrology Laboratory, Italian National Agency for New Technologies, Energy and Sustainable Economic Development, ENEA, 00044 Frascati, Italy
ORCID: https://orcid.org/0000-0001-9696-3124
Affiliation:
Diagnostics and Metrology Laboratory, Italian National Agency for New Technologies, Energy and Sustainable Economic Development, ENEA, 00044 Frascati, Italy
Affiliation:
Diagnostics and Metrology Laboratory, Italian National Agency for New Technologies, Energy and Sustainable Economic Development, ENEA, 00044 Frascati, Italy
Affiliation:
Diagnostics and Metrology Laboratory, Italian National Agency for New Technologies, Energy and Sustainable Economic Development, ENEA, 00044 Frascati, Italy
ORCID: https://orcid.org/0000-0003-0733-0291
Affiliation:
Diagnostics and Metrology Laboratory, Italian National Agency for New Technologies, Energy and Sustainable Economic Development, ENEA, 00044 Frascati, Italy
Affiliation:
Diagnostics and Metrology Laboratory, Italian National Agency for New Technologies, Energy and Sustainable Economic Development, ENEA, 00044 Frascati, Italy
Affiliation:
Diagnostics and Metrology Laboratory, Italian National Agency for New Technologies, Energy and Sustainable Economic Development, ENEA, 00044 Frascati, Italy
ORCID: https://orcid.org/0000-0002-4217-3968
Explor Foods Foodomics. 2024;2:542–554 DOI: https://doi.org/10.37349/eff.2024.00050
Received: April 30, 2024 Accepted: July 26, 2024 Published: September 10, 2024
Academic Editor: Maria Tsimidou, Aristotle University of Thessaloniki, Greece
The article belongs to the special issue Metrological Aspects in the Analysis of Nutrients, Functional Compounds, Additives and Contaminants in Food and Feed
Aim: Rice, one of the most widely consumed staple foods globally, relies on amylose content for its quality, impacting cooking, digestibility, and health properties. Conventional amylose determination methods are time-consuming and involve complex chemical treatments. Thus, there is growing interest in rapid, non-destructive techniques for food quality control. This study explores the potential of laser photoacoustic spectroscopy (LPAS) for predicting amylose content in rice flour.
Methods: Certified rice flour standards of varying amylose levels have been analyzed using a quantum-cascade LPAS system. Preliminary analysis utilized Fourier transform infrared/attenuated total reflectance (FTIR/ATR) to identify rice starch spectral features in the IR region. Multivariate data tools like principal component analysis (PCA) and partial least squares (PLS) regression have been combined with LPAS measurements to extract information from the complex spectral data set and to demonstrate the ability of the system to predict their amylose content.
Results: LPAS spectra, recorded between 7.0–11.0 μm, displayed two broad bands, showing a linear increase in signal with amylose content, especially notable in the specific fingerprint region within 8.5–10.0 μm. The prominent peak at 9.3 μm exhibited a high linear correlation with amylose levels (R2 > 0.99). PCA effectively differentiated rice flour samples, while PLS accurately predicted amylose content. The difference between predicted and actual amylose is significantly less than the statistical error of the measurement.
Conclusions: LPAS combined with chemometric analysis emerges as a promising non-destructive method for rapidly assessing rice amylose content, potentially supplementing or replacing current standard methods. Its advantages, limitations, and future prospects in rice quality analysis are discussed, highlighting its role in preliminary screening.
Rice is the dietary staple for nearly two-thirds of the world’s population, and rice production has an important position as its global consumption continues to rise, now exceeding approximately 520 million metric tons. The increasing usage of rice depends upon its cost effectiveness, nutritional and health properties. According to the United Nations Food and Agriculture Organization, more than half of the world’s population depends on rice as staple food, contributing approximately 20% of their nutritional intake [1]. Asian rice Oryza sativa L. is the most widely cultivated species [2]. After sugarcane and corn, rice is the third most produced agricultural crop in the world. China is the largest rice producer in the world, followed by India [3]. Italy and Spain are the major European rice-producing countries accounting for 80% of the total EU production [4, 5].
The quality taste of rice and its consequent market value are related to various parameters that define its cooking, eating, and nutritional quality properties [6]. Such quality parameters are governed by processing conditions, environment [7, 8], and intrinsic physicochemical properties such as amylose/amylopectin ratio and protein content [9, 10]. The carbohydrates amylose and amylopectin are the main constituents of starch in rice endosperm, the internal part of the processed rice grain. Amylose is the linear component of starch and is constituted by a straight chain of glucose molecules, while amylopectin represents the branched chain of starch molecules. The ratio of these two types of starch carbohydrates contributes to the functional properties of rice [10, 11] and is the major determining factor of its cooking behavior and digestibility [12].
The amylose content (AC) in rice can vary significantly, typically ranging from 10% to 30% of the total starch. Juliano [13] proposed a classification system based on AC, which includes the following categories: waxy rice (AC: 0–5%), very low (AC: 5–12%), low (AC: 12–20%), intermediate (AC: 20–25%), and high (AC: 25–33%). Commercially, rice is further categorized based on AC as follows: low (less than 20% amylose), medium (21–25%), and high (26–33%).
Rice varieties with a high AC are characterized by a high consistency and low stickiness after cooking. On the other hand, varieties with a low AC have low consistency and are soft, moist, and sticky in texture. In the varieties capable of maintaining greater consistency after cooking its percentage must be higher than 23% but must not exceed 27% in order not to encounter difficulties in completing cooking. Amylose is not only associated with the cooking properties of rice, but also with its digestibility and health properties. Several studies have demonstrated that the digestibility and health benefits of rice starch are associated with rice amylose levels [12]. The low-amylose varieties have faster starch digestibility with a high sugar release than the ones with high amylose [14–16].
For those reasons, the determination of this parameter is a property that is of primary interest for geneticists and the seed industry, with a view to introducing new varieties into the market and genetically improving them.
Various methods have been developed for determining the AC of cereal grains. Traditional methods, such as iodine staining, gel permeation chromatography, and enzymatic assays, involve time-consuming and labor-intensive processes, often requiring chemical reagents. The standard reference method currently used for the determination of rice AC is an iodine-colorimetric method based on the protocol ISO 6647-1-2007 [17]. The protocol involves complex manipulations of the sample: rice is ground to a very fine flour and then chemically treated to form a colored iodine-complex which is finally determined through spectrophotometry.
The development of rapid and non-destructive diagnostic techniques applied to food quality control is receiving growing interest since they offer high sensitivity, fast response time, cost effectiveness, and easy-to-use solution without any sample treatment and/or modification. In particular, non-targeted optical and spectroscopic techniques coupled with multivariate analysis methods have proved their efficiency in the food safety control sector. Such techniques offer great benefits to the control authorities that routinely verify food quality as they can be used as portable and user-friendly small size systems. In recent years, spectral analysis technology has been used for testing food quality, in particular conventional near infrared (NIR) spectroscopy is used to obtain information in the “fingerprint region”, a broad band in which many organic compounds can be detected. Sampaio et al. [18] demonstrated that NIR spectroscopy associated with multivariate analysis techniques allows efficient discrimination of rice samples and could be effective in the determination of rice authenticity. However traditional NIR spectroscopy techniques are limited by the low power of the source which influences their sensitivity. For this reason, laser spectroscopy has emerged as a powerful tool to replace conventional spectroscopy for analyzing molecular compositions in various samples due to its high sensitivity, selectivity, and non-destructive nature. Laser photoacoustic spectroscopy (LPAS) is a spectroscopic technique that combines laser excitation with acoustic detection, enabling the analysis of molecular vibrations and absorptions in solid, liquid, and gaseous samples. LPAS has been successfully applied in diverse fields, including environmental monitoring, biomedical diagnostics, and material science. The Diagnostics and Metrology Laboratory of ENEA has a long experience in the development of LPAS systems applied to food fraud and adulteration. The first LPAS prototype was based on a continuous wave (CW) CO2 laser and was successfully applied to different contaminants, adulterants of food such as seafood, sugar, milk, and to the detection pathogens of orange fruit [19–21]. In recent years, an LPAS system based on quantum cascade lasers (QCLs) tunable in the fingerprint region has been successfully developed and applied to the detection of spice (saffron, oregano) adulterants and also to the discrimination of rice varieties [22–25]. Compared to the CO2 lasers, QCLs have less power but are significantly smaller and offer wider tuneability providing more information on the sample spectra and giving the possibility to develop portable field systems. Two different industrialized LPAS systems and many prototypes have been developed. Although the developed systems are prototypes, they are highly engineered. Currently, the main systems are the LPAS-cart (for research purposes in laboratory) and the LPAS-suitcase (for in-situ testing). In this work, we focused on the application of the LPAS-cart, which is based on QCLs having wavelength tuneable in an IR range matching the fingerprint region of many organic molecules. Non-targeted spectral techniques such as LPAS are often used in combination with chemometric analysis that are a powerful tool to extract accurate information from a complex spectral data set.
The main objective of this study is to explore the potential of the QCL-based LPAS system as a fast, non-destructive and alternative method to investigate AC in rice flour samples. The LPAS spectra were recorded on standard rice flours at different certified AC. The linearity of the LPAS response with the amylose level has been analyzed in some specific fingerprint regions. Assignment of the spectral region characteristics of starch molecules was carried out by comparison with the literature and with Fourier transform infrared (FTIR) absorption spectra of the samples. Multivariate data analysis tools such as principal component analysis (PCA) and partial least squares (PLS) regression were also combined with the LPAS data to allow discrimination and characterization of the samples.
Samples used in this work are standard rice flours with different certified content of amylose (low BCR-465, medium BCR-466, and high amylose BCR-467) from IRMM Institute for Reference Materials and Measurements, EC JRC, purchased by Sigma-Aldrich. Table 1 shows the certified values of AC and uncertainties of the different standards used.
List of standard rice flour samples analyzed
| Cod. n. | Sample name* | Amylose conc. (%)** | Uncertainty (%) |
|---|---|---|---|
| BCR-465 | LAC | 15.40 | 0.30 |
| BCR-466 | MAC | 23.10 | 0.50 |
| BCR-467 | HAC | 27.70 | 0.80 |
* Low, medium, and high amylose rice flours are indicated as LAC, MAC and HAC in the text; ** mass fraction g/100g. Cod. n.: code number; conc.: concentration
As reported in the certificate, the value is the unweighted mean of accepted mean values, independently obtained by 7 laboratories. The certified value is traceable to the International Standard Method ISO 6647:1987 rice-determination of AC. The uncertainty is taken as the half-width of the 95 % confidence interval of the certified value. The three standard samples were weighted (50 mg) and inserted into the sample holder located in the photoacoustic (PA) cell of the LPAS instrument without any pre-treatment or manipulation process. The measurement is performed directly on the powder sample as described in the sections below.
Rice flours were preliminarily analyzed by a Fourier transform infrared/attenuated total reflectance (FTIR/ATR) system in order to identify the distinctive spectral features of rice starch in the IR spectral range.
ATR is a technique that in recent years has revolutionized the IR analysis of solid samples. It is particularly useful for studying samples that are difficult to analyze directly, such as liquids, powders, and solids. A beam of infrared light is directed into a crystal made of a material with a high refractive index, such as diamond or germanium. When the light hits the surface of the crystal at a specific angle (the critical angle), it undergoes total internal reflection, reflecting back into the crystal. The sample of interest is placed in contact with the surface of the crystal. Only a thin layer of the sample near the crystal surface interacts with the light. As the IR light travels through the crystal, it generates an evanescent wave at the crystal/sample interface. This evanescent wave penetrates the sample and interacts with its molecules. The sample’s chemical composition, structure, and other properties affect the attenuation of the evanescent wave as it passes through the sample layer. A detector measures the intensity of the light after it has interacted with the sample. The attenuation of the evanescent wave carries information about the sample composition.
The apparatus used in this work is an IR Affinity-1S Shimadzu FTIR spectrophotometer equipped with a high-energy ceramic light source and a deuterated lanthanum α alanine doped TriGlycine Sulphate (DLATGS) temperature-controlled detector. The FTIR/ATR was operated in the spectral range of 4000–800 cm–1 with a resolution of 2 cm–1 and 40 scans per spectrum were carried out. About three milligrams of each sample were used for analysis. The collected data were compared with the internal reference library spectra.
The basic functioning principle of an LPAS detection system relies on the induction of the PA effect [26] due to the interaction between a laser radiation beam and the sample. The scheme of the LPAS-cart version developed at ENEA is shown in Figure 1 and comprises several key components. Central to its operation are quantum-cascade laser sources with continuous emission (QCL-CW, Day Light MIRcat) in the IR spectral range between 7.0–11.0 μm, controlled by a host PC through a dedicated software developed in our laboratory in the LabVIEW environment. A laser beam is intensity modulated at acoustic frequencies (up to 6 kHz) by a mechanical chopper. A fraction of the optical power is diverted by a beam splitter towards a power meter (Gentec-EO Maestro) for continuous monitoring, while the bulk of the beam is directed by a mirror into the PA cell. Inside the PA cell, the interaction of the modulated laser beam with the sample induces cyclic thermal expansion of the irradiated sample, corresponding to the generation of an acoustic pressure wave. This wave is detected by a miniaturized microphone (Knowles, model EK-23024) and the amplitude of the component synchronized to the chopper reference is extracted by a lock-in amplifier (Zurich Instruments, model MFLI).
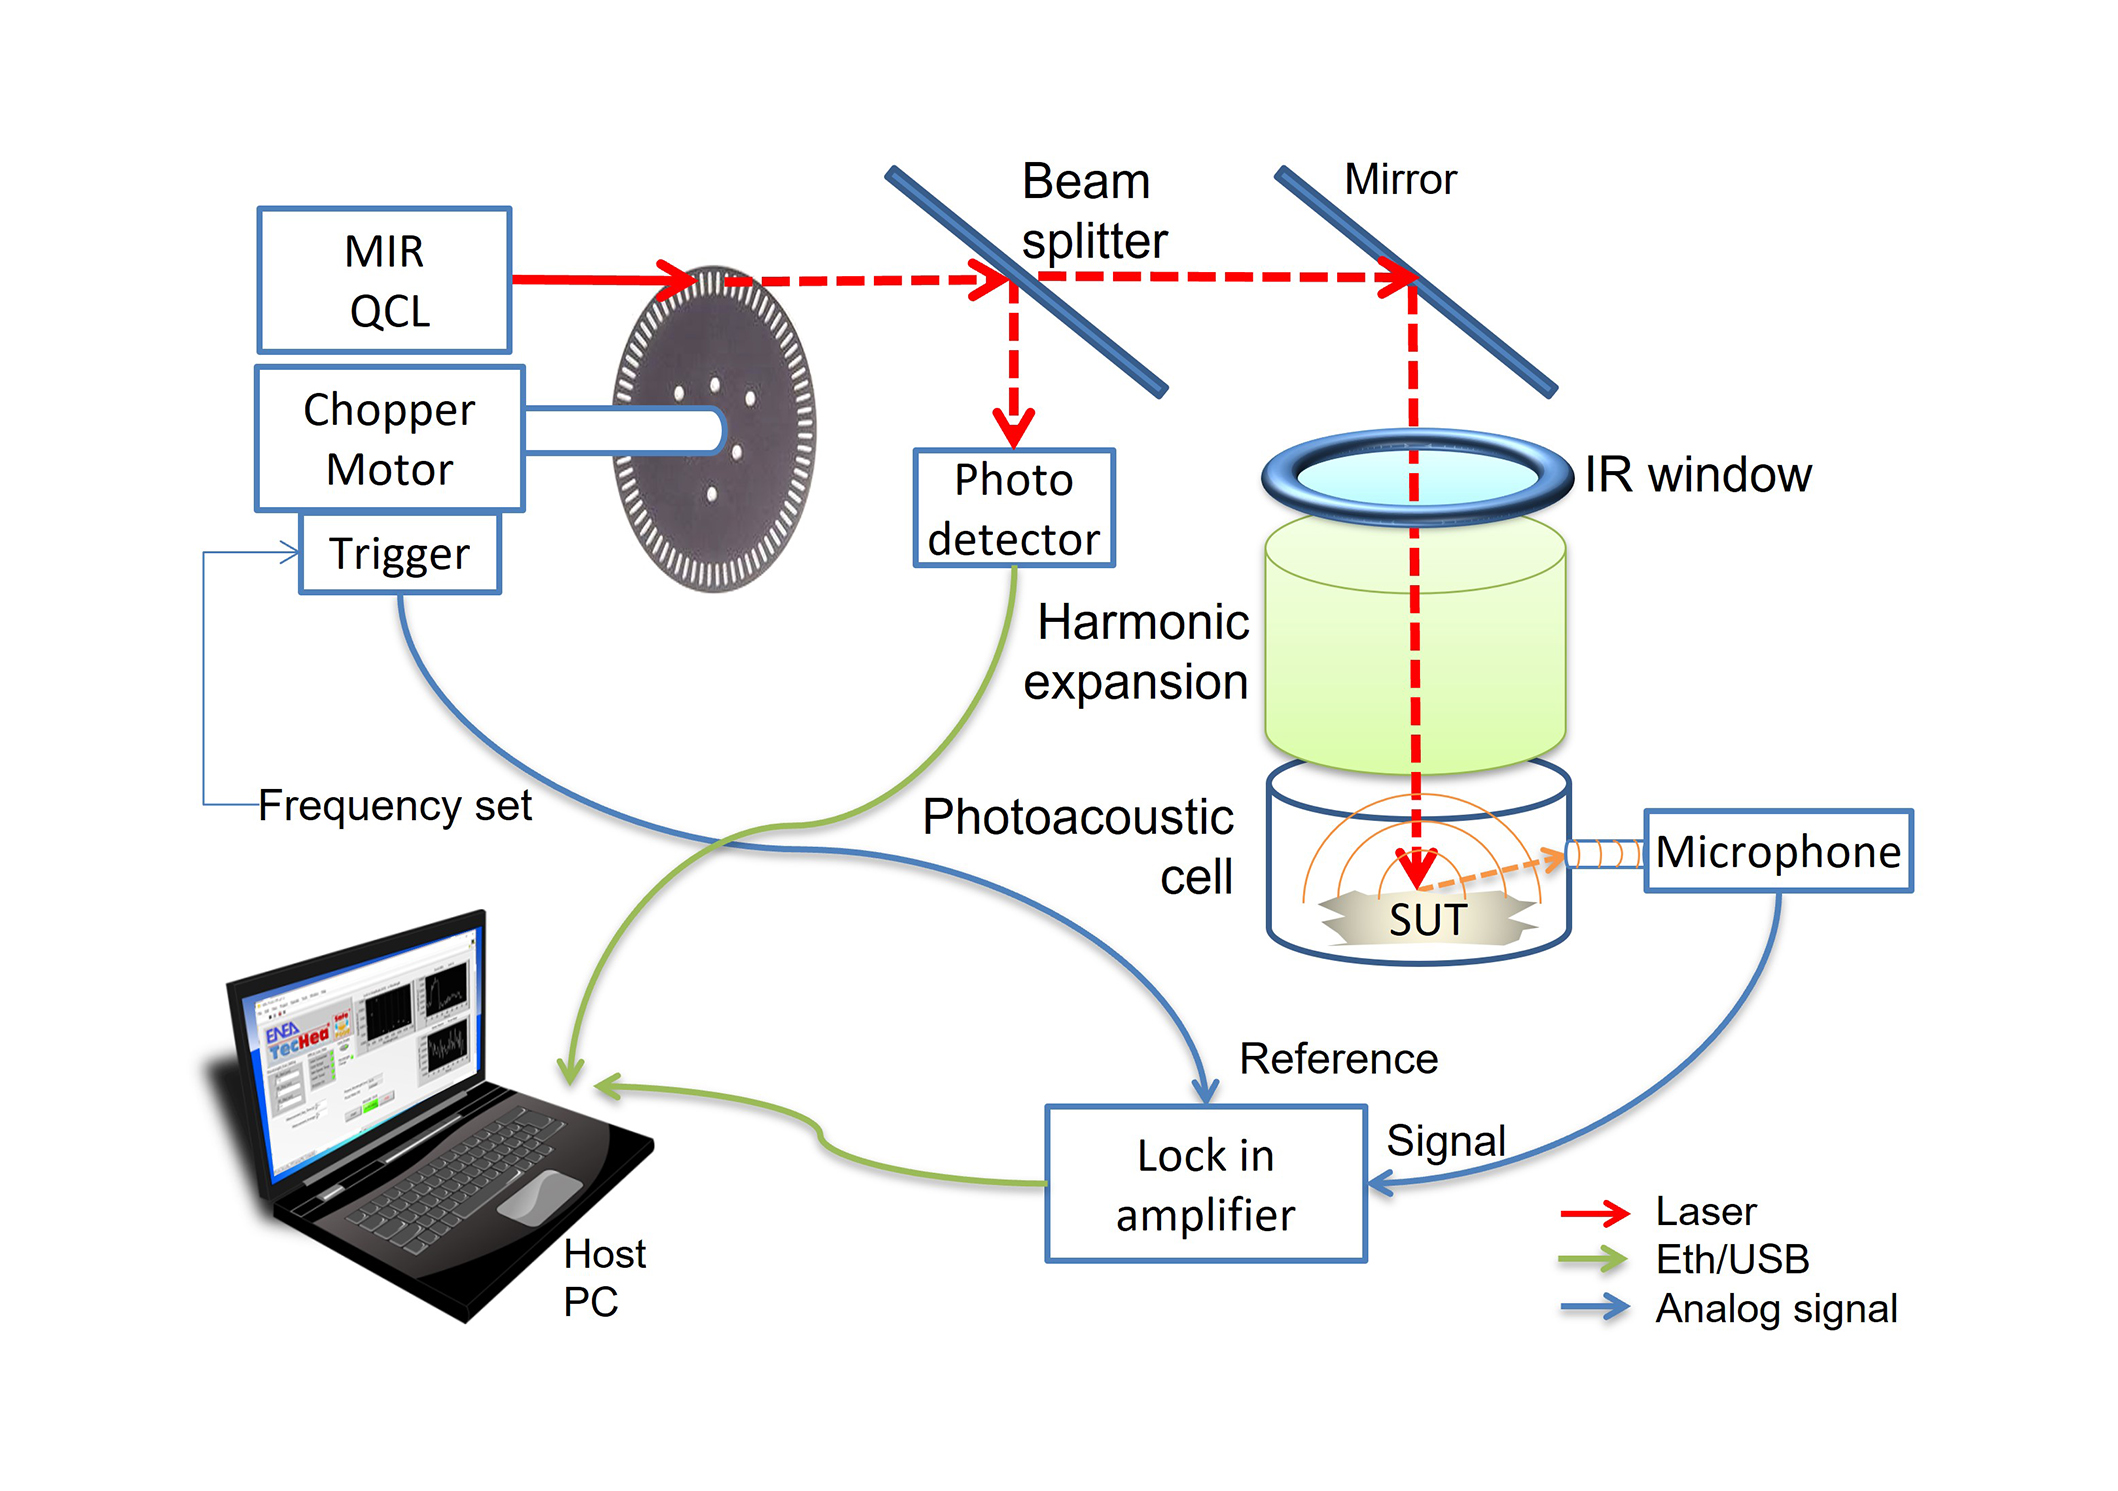
Scheme of the QCL based LPAS-cart system developed at ENEA. System image developed in the ENEA-funded TecHea project. QCL: quantum cascade laser; LPAS: laser photoacoustic spectroscopy; MIR: medium infrared region
The intensity of the sound wave is directly related to the radiation absorption of the sample at the wavelength emitted by the QCL. By varying the wavelength in the medium infrared region (MIR), it is possible to obtain a MIR absorption spectrum.
The MIR absorption spectrum is normalized with respect to the power emitted by the laser and measured by the power meter. Notably, this method offers distinct advantages over alternative spectroscopic techniques, primarily due to its ability to use a significantly more powerful radiation source.
The components and measurement parameters of the LPAS system have been designed and optimized to improve the accuracy and sensitivity of the detection system. The PA cell has been designed and realized in our laboratory. To achieve better audio detection, we improved the sensibility and stability of the microphone and studied the acoustic characteristics of the resonance cells through finite elements method (FEM) simulations. Concerning the optical management, we reduced the effect of the beam heating to avoid the degradations of the sample under investigation, using a defocusing lens. Moreover, a laser optical modulation system upgrade has been implemented. To check the effectiveness of the LPAS system applied to the determination of the AC in rice, high resolution absorption spectra have been recorded on three standard rice flours with low, medium, and high amylose. Preliminarily, the spectra have been obtained with the following procedure: the QCL scanned the wavelengths from 7.00 to 11.00 μm with a step of 0.025 μm; each measurement was repeated 10 times and the 10 measurements of lock-in amplifier PA signal (V) and the laser power (W) were averaged. The normalized spectra of the LPAS signal with respect to the emitted laser power (V/W) are obtained by the ratio of those averaged measurements; final spectra have been smoothed applying a first order Savitzky-Golay filter on 7 points.
Spectral data analysis has been combined with multivariate statistical tools such as PCA and PLS regression, that allow extracting information from a complex data set reducing its dimensionality and widely applied in combination with non-targeted spectral techniques [27].
PCA is often used for data visualization, as it enables the visualization of high-dimensional data in a lower-dimensional space (typically two or three dimensions), identifying correlations in a big dataset and retaining only a subset of the principal components that capture most of the variability in the data. These components are ranked by the amount of variance they explain in the data. By projecting the original data onto this reduced set of principal components, PCA effectively reduces the dimensionality of the dataset while preserving as much information as possible.
PCA is also used for feature extraction and noise reduction in datasets, aiding in tasks such as pattern recognition, classification, and clustering. In this work, PCA has been applied to discriminate the three rice flour samples. Our data set of 163 dimensions corresponding to the scanning wavelengths is reduced to a data set of 3 principal components using the routines available in OriginPro.
PLS is a statistical technique used for modeling the relationship between a set of independent variables (predictors) and a dependent variable (response). It is particularly useful when dealing with datasets with high dimensionality, multi-collinearity, and noisy data. PLS regression constructs a set of latent variables (called X and Y components), also known as components or factors, which are linear combinations of the original predictor variables. These latent variables are constructed iteratively to maximize the covariance between the predictor variables and the response variable. PLS estimates the regression coefficients between the constructed latent variables and the response variable. These coefficients represent the relationship between the predictors and the response. In this work, PLS was applied to the experimental data using OriginLab (Northampton, MA, USA) OriginPro 2024 [28].
All rice flour samples were first analyzed with FTIR/ATR in order to identify the IR spectral ranges most useful for the investigation by LPAS method. Figure 2 shows the FTIR/ATR absorption spectra of the samples under study. Data have been compared to the reference library spectra, which confirmed that the spectral profiles are typical of starch.
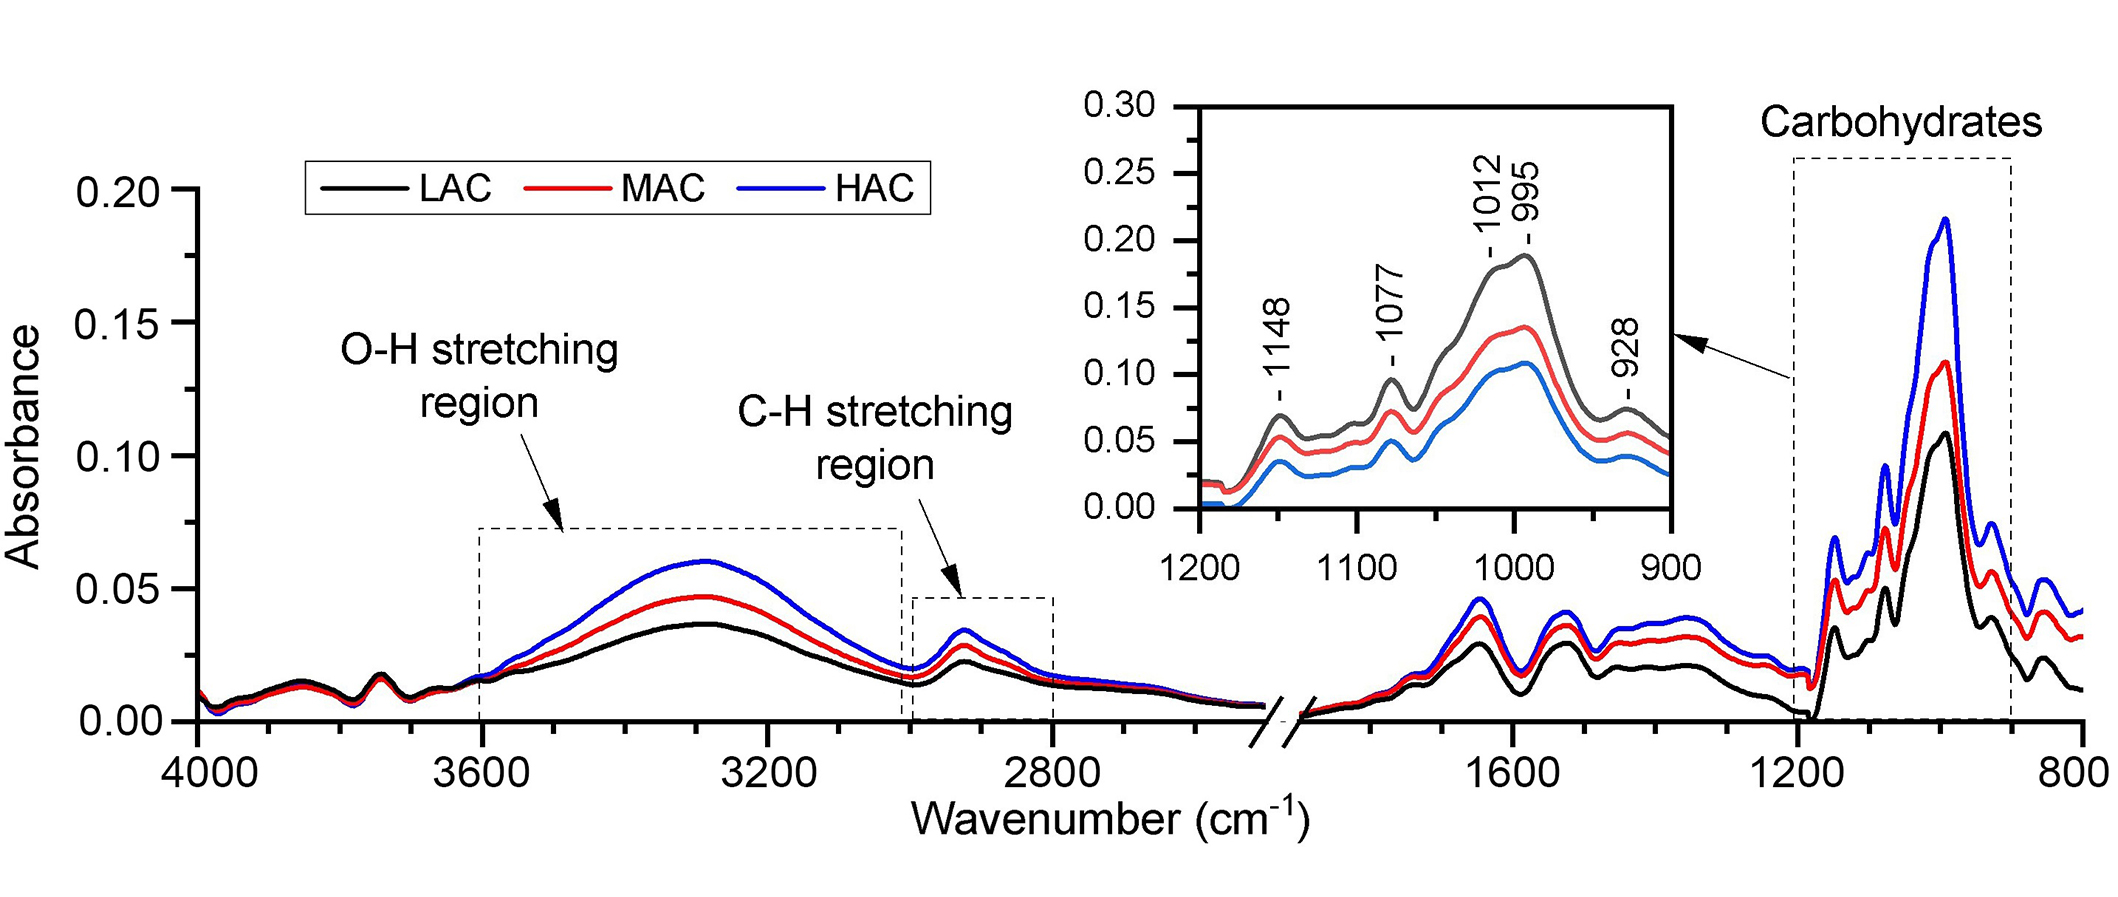
FTIR spectra of the standard rice flours with low, medium, and high amylose content (LAC black line, MAC red line, HAC blue line). FTIR: Fourier transform infrared; LAC: low amylose content; MAC: medium amylose content; HAC: high amylose content
FTIR spectra exhibit different transitions of the vibrational modes in four main regions: between 3000 and 3600 cm–1 (O-H stretch region), within 2800–3000 cm–1(C-H stretch region), between 1200 and 1700 cm–1, and finally the region at 800–1200 cm–1where starch carbohydrates, such as amylose, show their characteristic bands (fingerprint region) [29–31].
Vibrational bands in the fingerprint region of carbohydrates were used in this work to verify the response of the FTIR signal to the different AC of the flour samples. After the normalization of the signal and baseline correction, we checked the linear response of the band height at 995 cm–1 with respect to the amylose level in the three samples.
Figure 3 reports the linear fit of the intensity height of the peak at 995 cm–1 vs. amylose concentration. The absorption intensities of the three peaks show a good linearity confirming that this spectral feature should be directly related to the amylose level of the different milled rice mixtures under investigation.
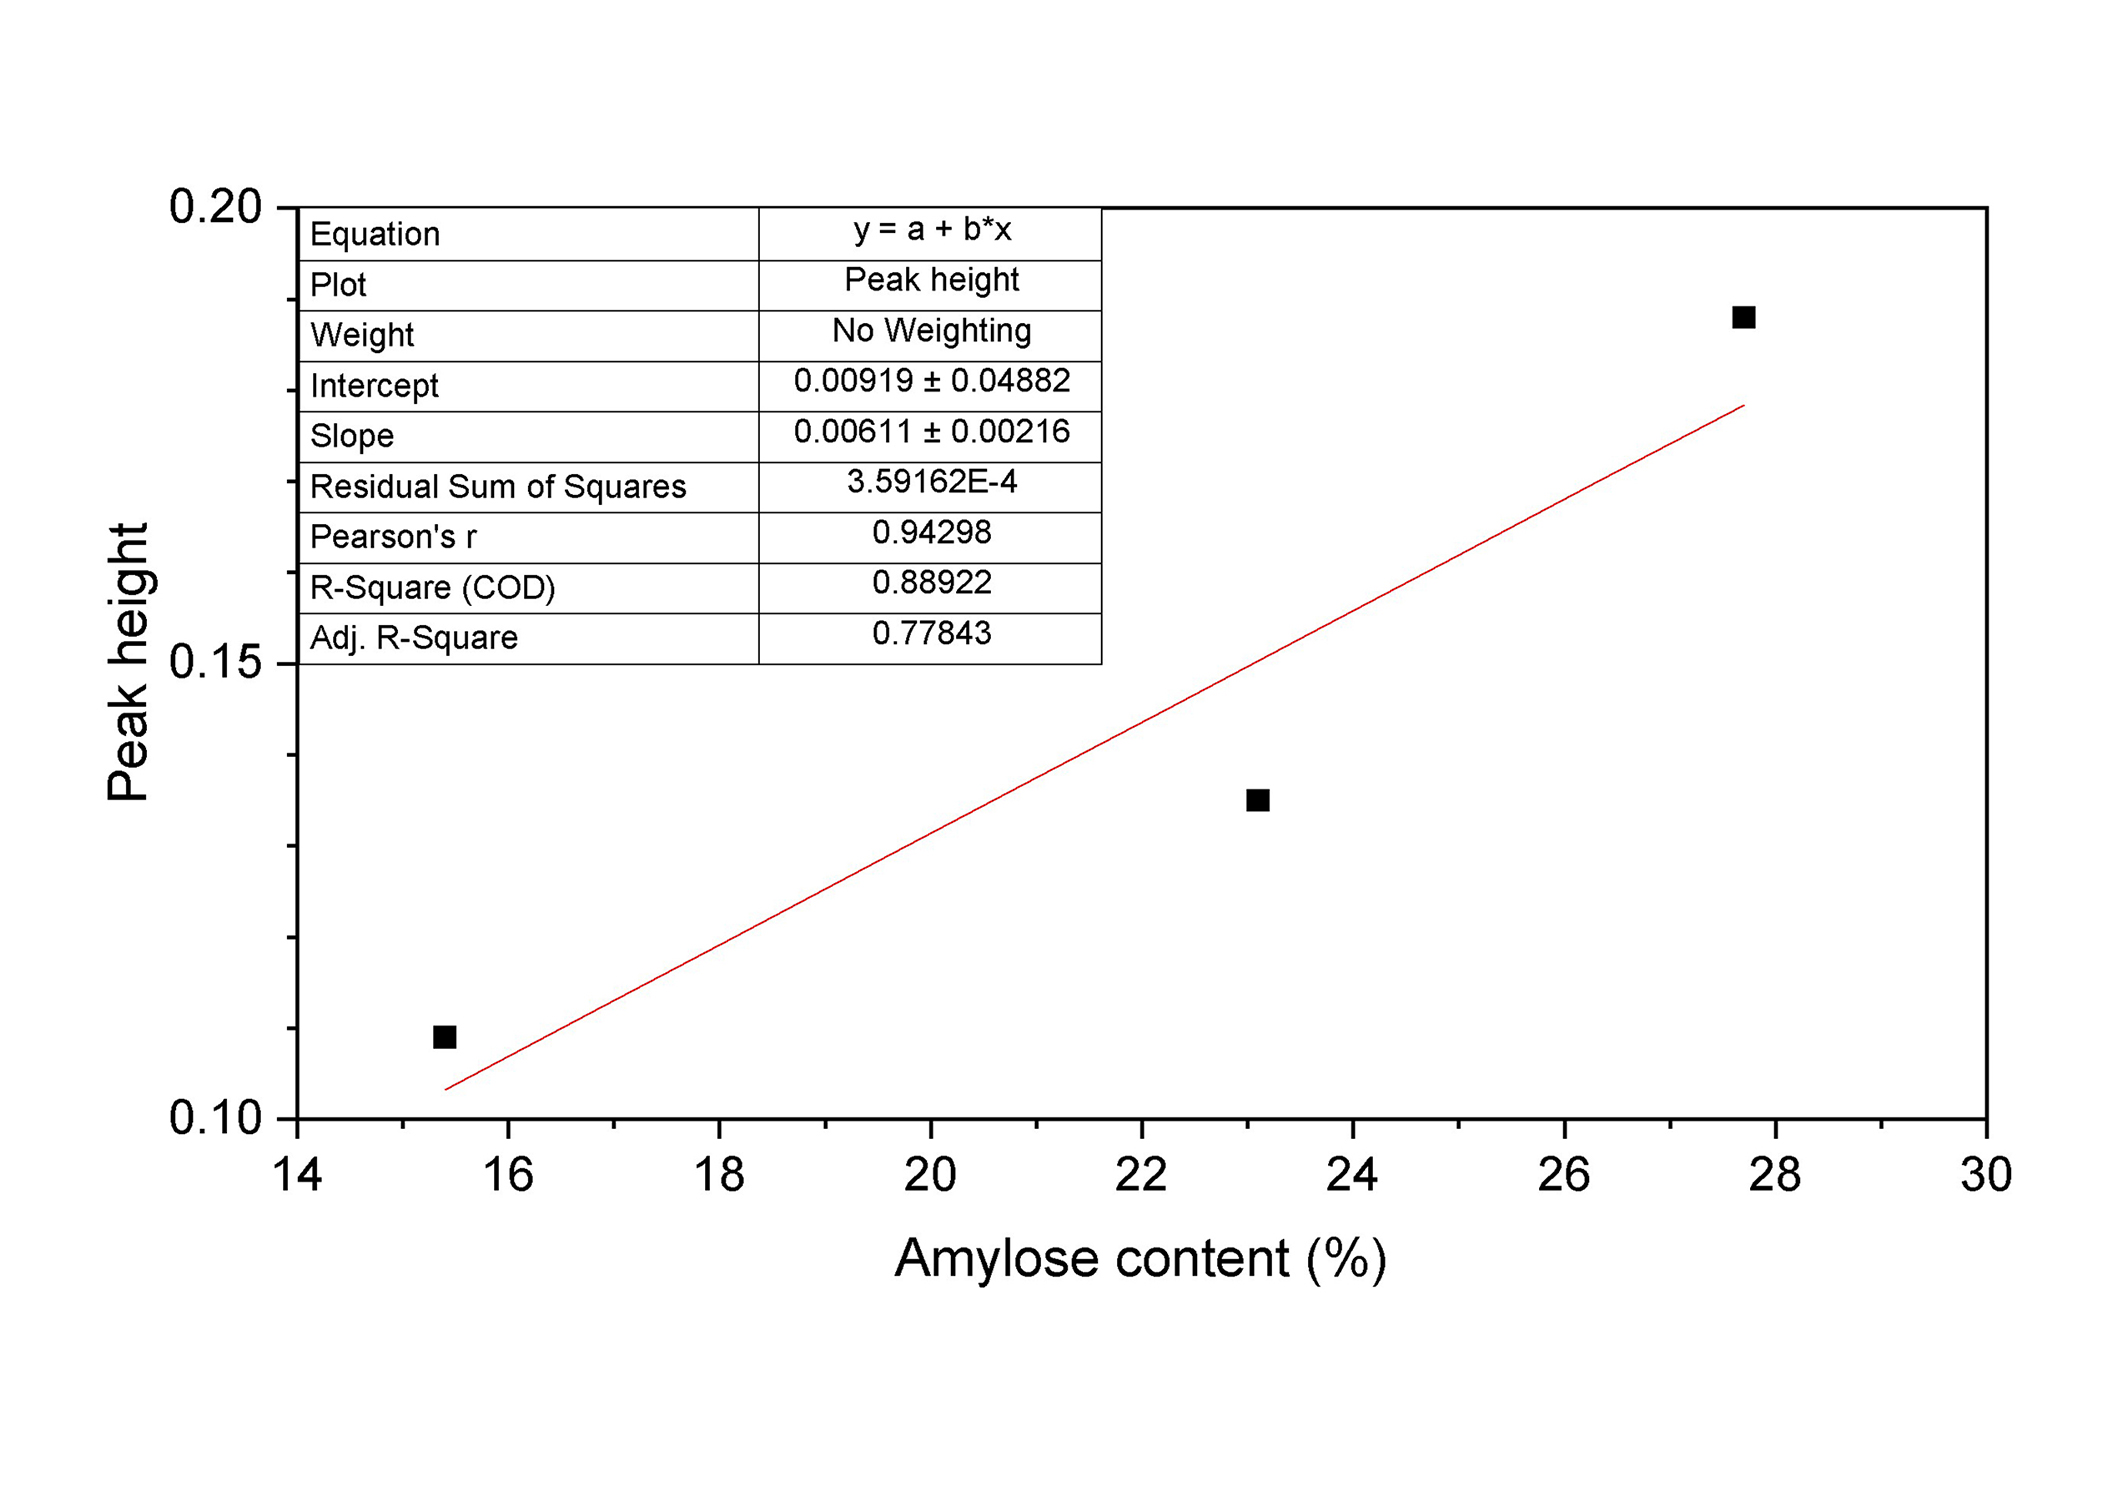
Linear fit of the peak heights recorded by FTIR measurements at 995 cm–1. FTIR: Fourier transform infrared
This study aims to explore the potential of LPAS for predicting AC in rice samples has been conducted using a set of diverse rice flour standards with known amylose concentrations as described before. Laser wavelength scanning is commonly employed in the infrared region of the spectrum where many organic compounds can be detected. LPAS measurements were performed on the rice samples in the whole spectral range accessible by QCLs from 7.0 to 11.0 μm, in a high-resolution mode (λ = 0.025 μm). The recorded spectra of the three standard reference samples are reported in Figure 4. Each spectral profile is the average of 10 spectra (1 cycle of 10 measurements for each IR wavelength). A first order Savitzky-Golay filter on 7 points has been applied to smooth the signals. Figure 4 reports the smoothed spectra.
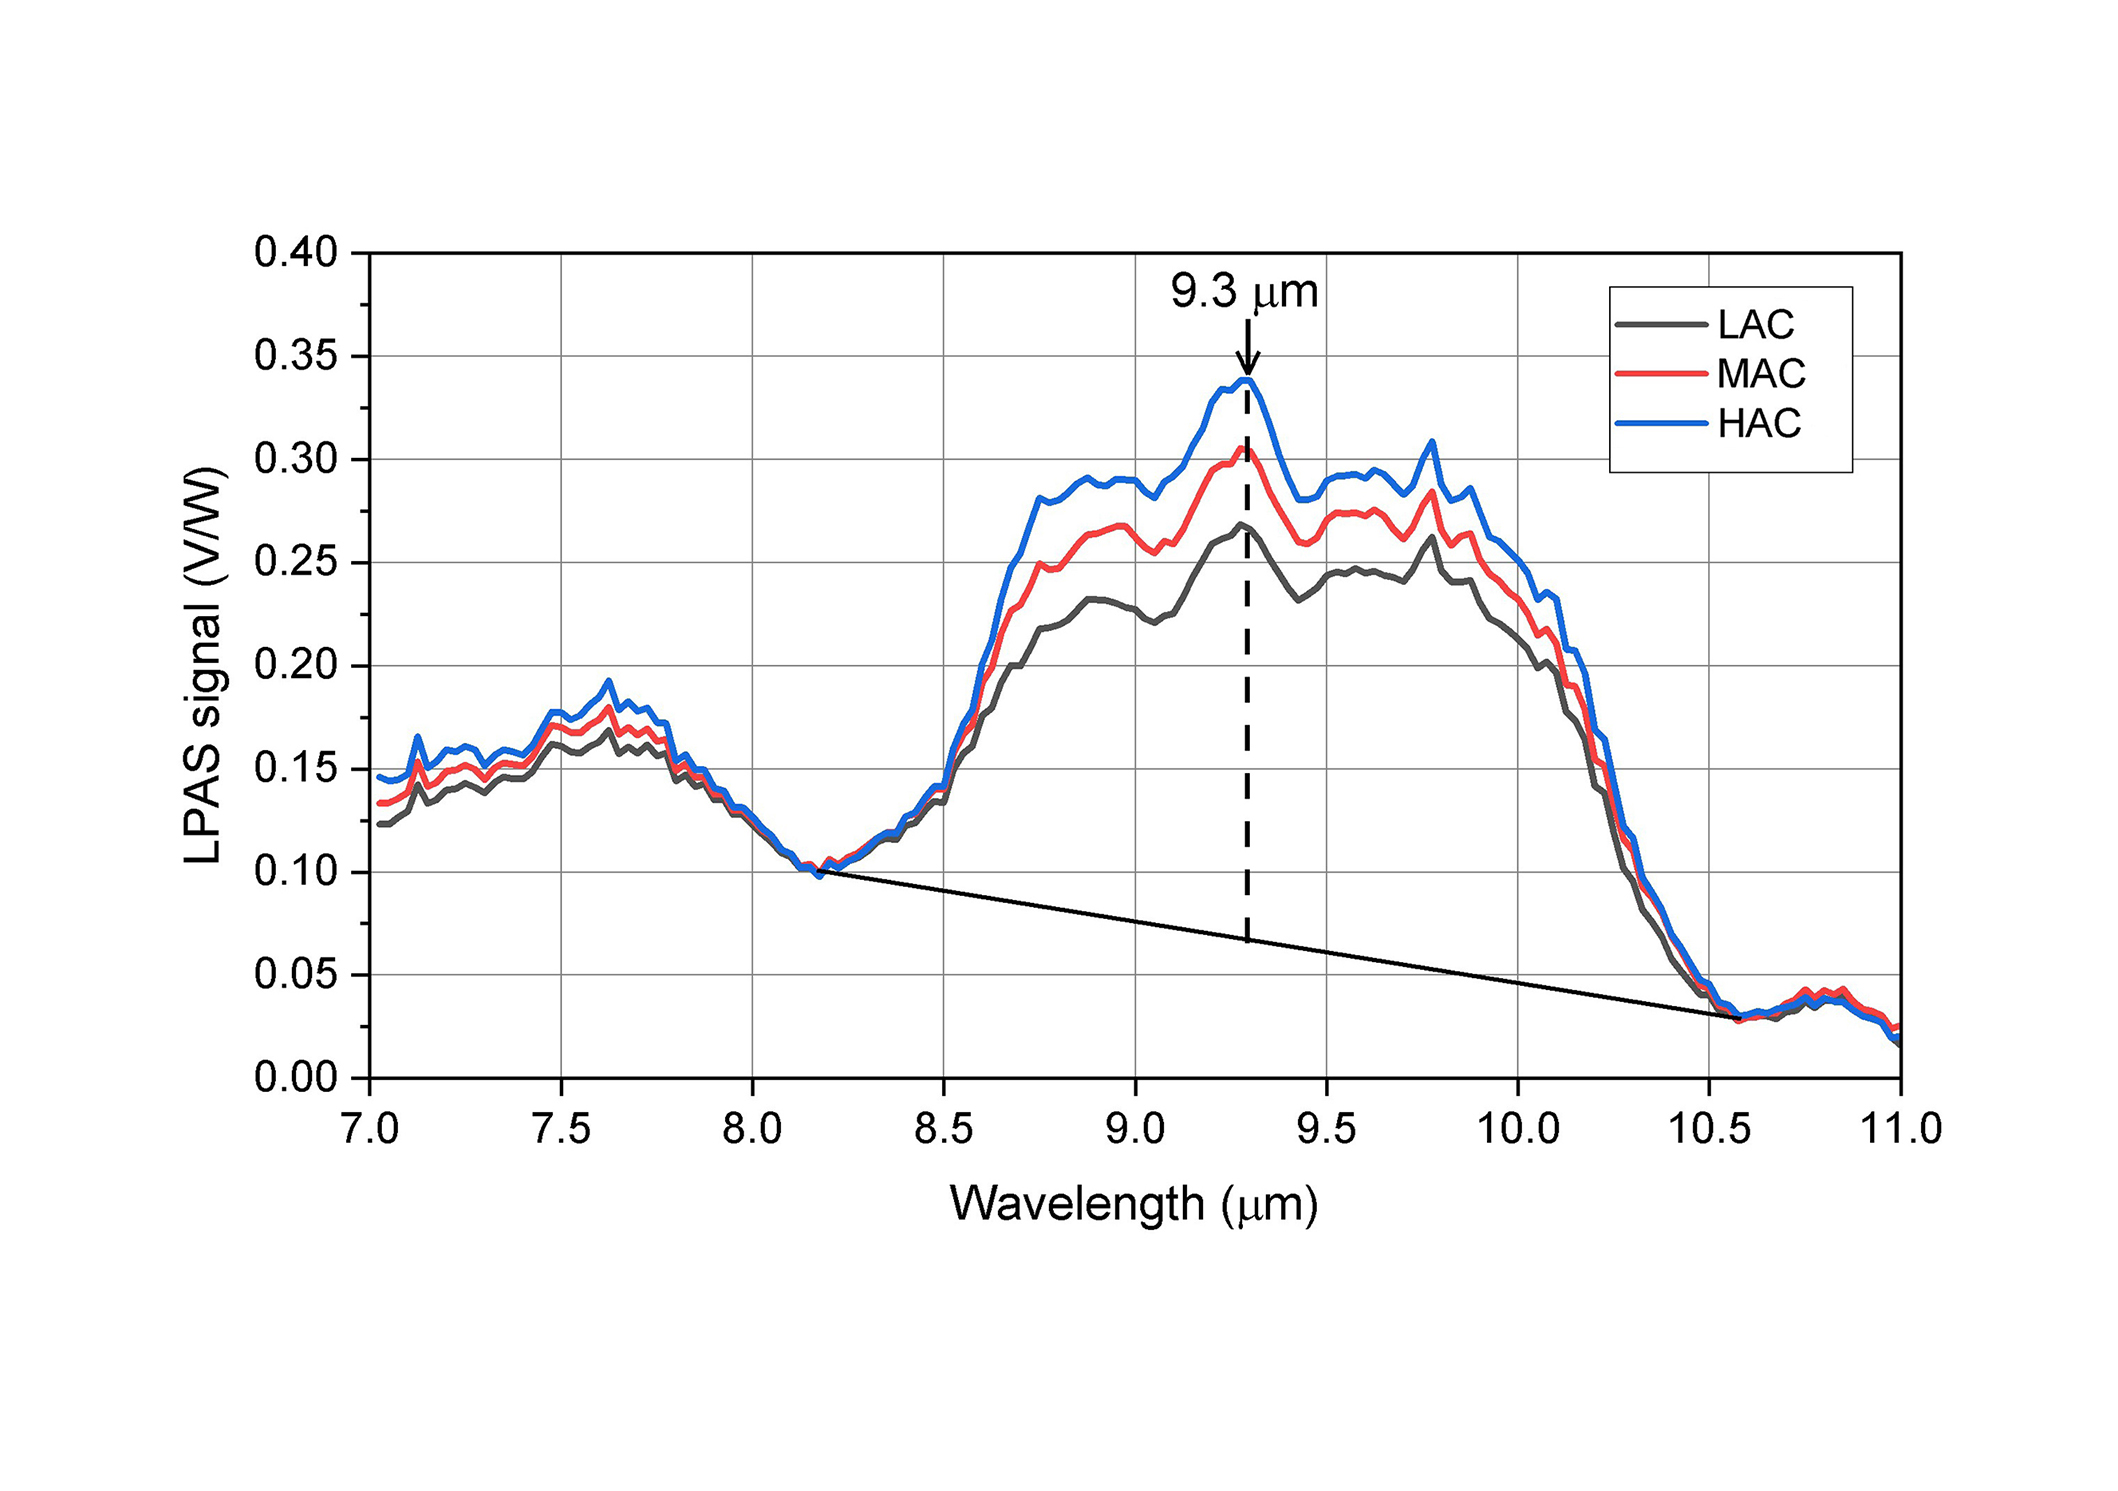
LPAS spectra of different rice flour standards with low, medium, and high amylose content (LAC, MAC, HAC). LPAS: laser photoacoustic spectroscopy; V/W: photoacoustic signal/laser power
The spectra reported in Figure 4 clearly show that LPAS is weakly sensitive to the different samples in the spectral region between 7.0–8.0 μm, while between 8.5–10.0 μm, the fingerprint region of starch molecules including amylose, the PA signal shows pronounced broad bands whose intensity is clearly proportional to the flour chemical composition. The three rice flours analysed are certified samples that have the same composition and only differ in the AC so it can be assumed that the signal response depends on it. A first rough check to investigate the linearity of the instrument response to the amylose level has been carried out by fitting the three peak heights recorded by LPAS measurements at 9.3 μm, where the band shows a maximum. Peak heights have been calculated with respect to the baseline shown in Figure 4. The resulting plot is reported in Figure 5.
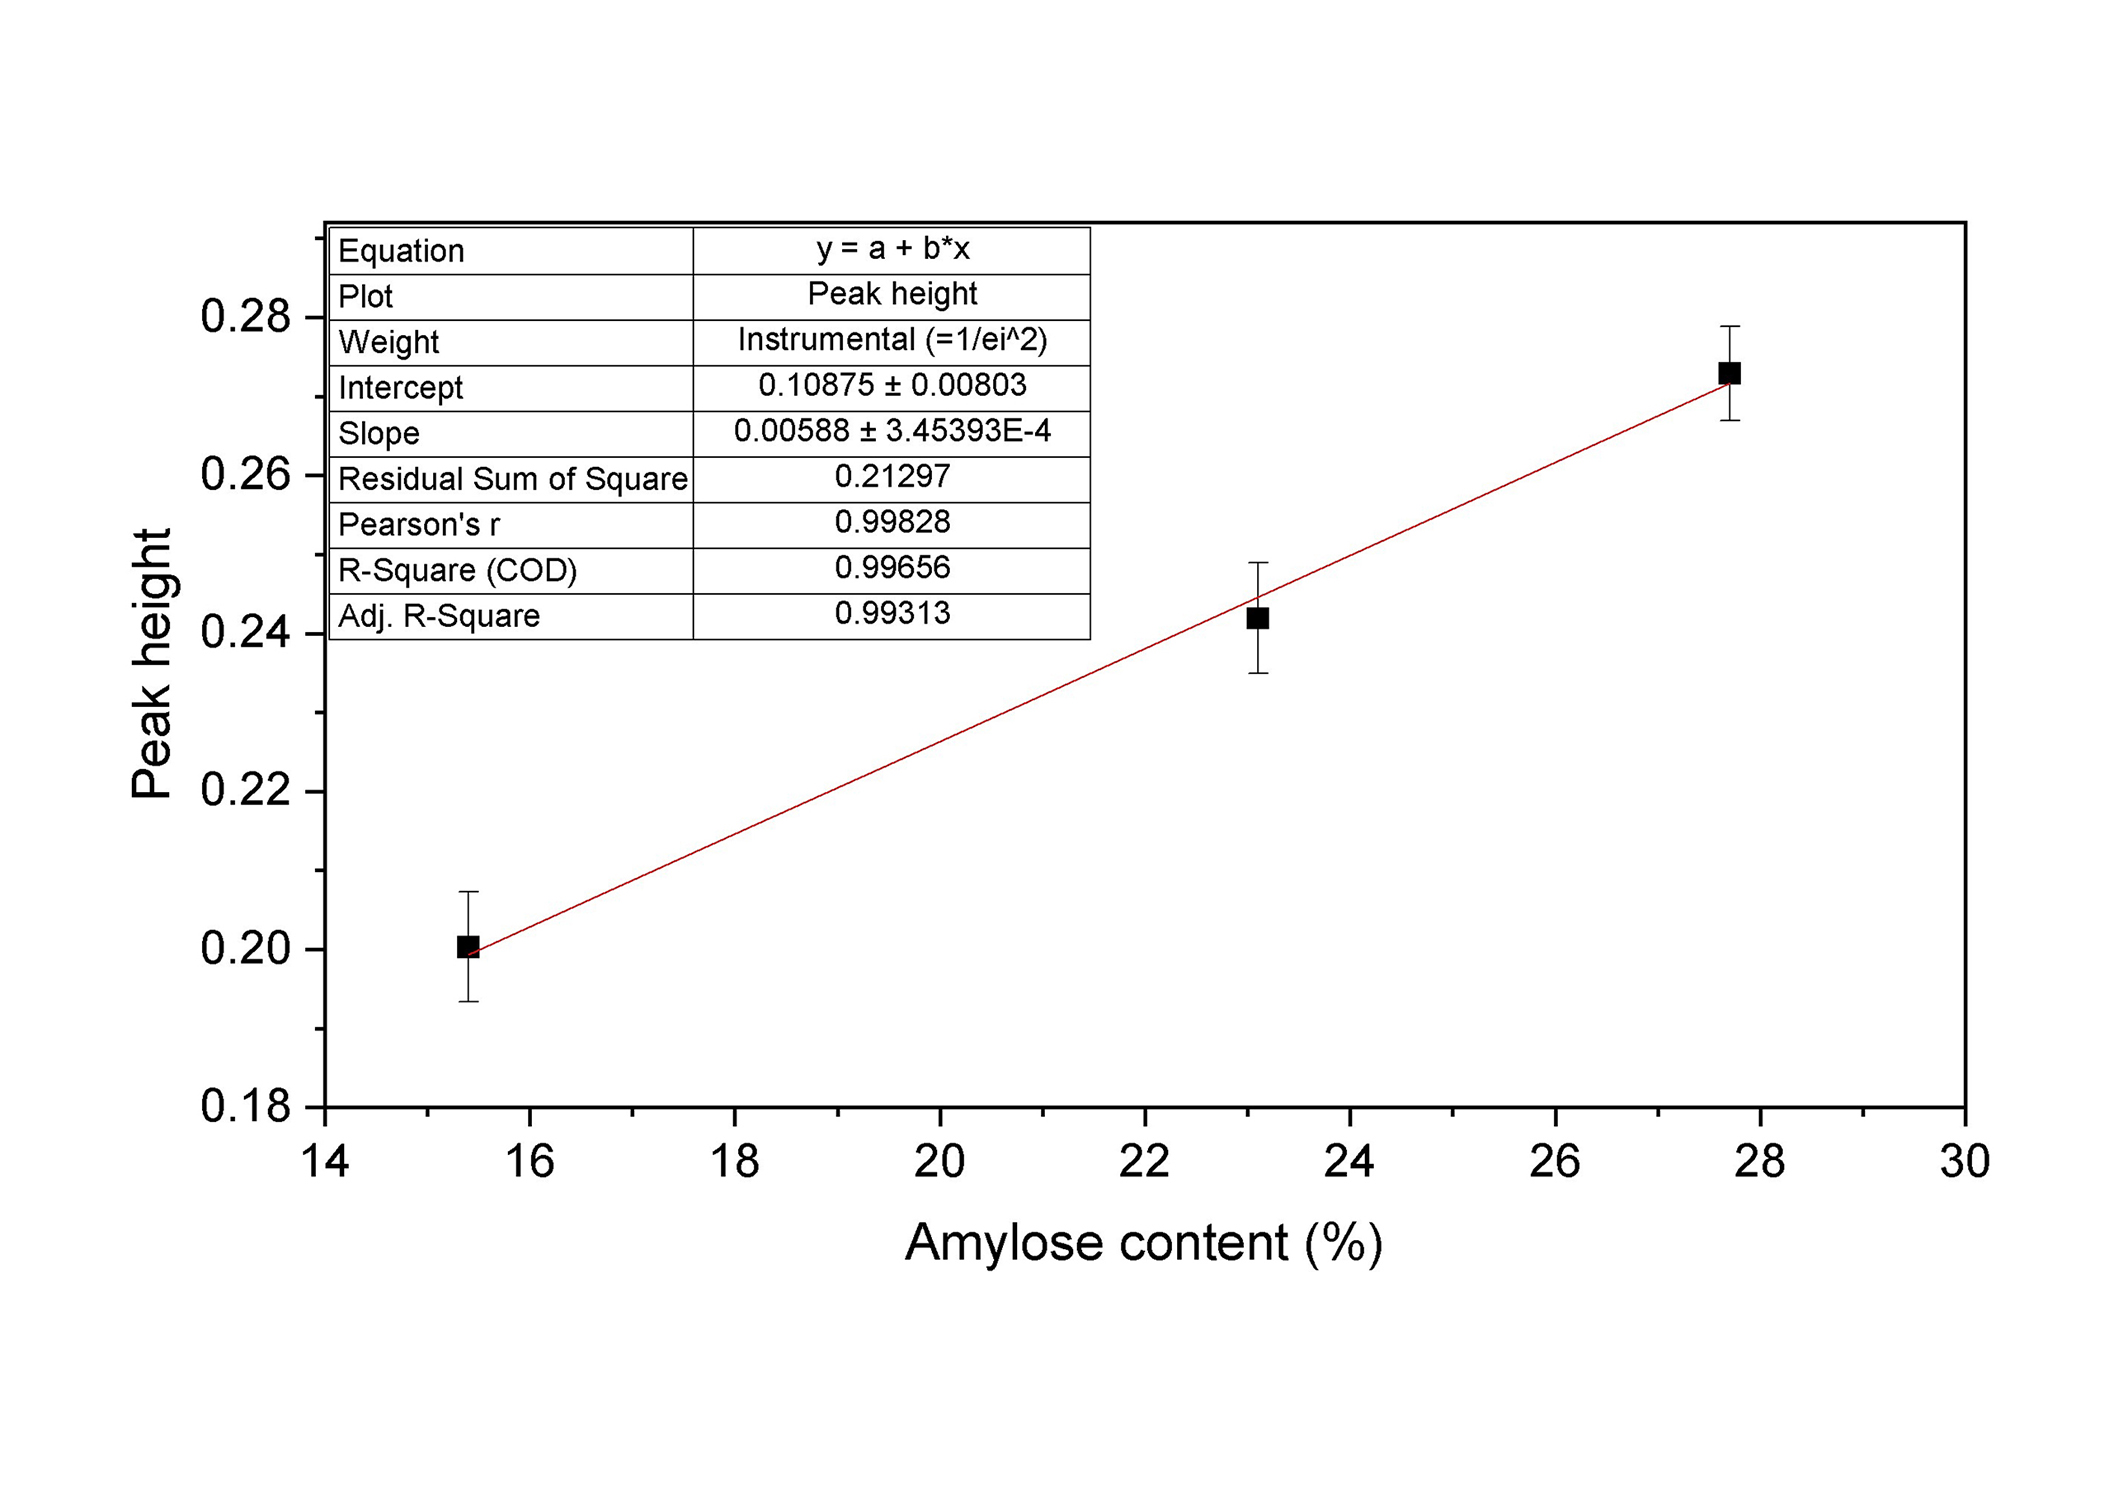
Linear fit of the LPAS peak heights at 9.3 μm vs. amylose content. The error bars represent the standard deviations of the ten measurements carried out on each sample. LPAS: laser photoacoustic spectroscopy
The fit is quite encouraging as suggested by the high value of the coefficient of determination R2 obtained, indicating that the intensity of the LPAS signal in this spectral region linearly increases with the amylose content and that the application of chemometric analysis could be successful.
PCA was performed over the great amount of data provided by the LPAS measurements. PCA revealed a compelling alignment between the spectral trends and the principal components. Particularly, the trend of increasing AC corresponded closely with the position of the scores, related to the three samples, along the principal component 1 (PC1) axis, which accounted for 86.8% of the overall variability. Notably, the loadings associated with PC1 were predominantly concentrated within the 8.5–10.0 μm range, where the trend in spectral features was most pronounced (Figure 6).
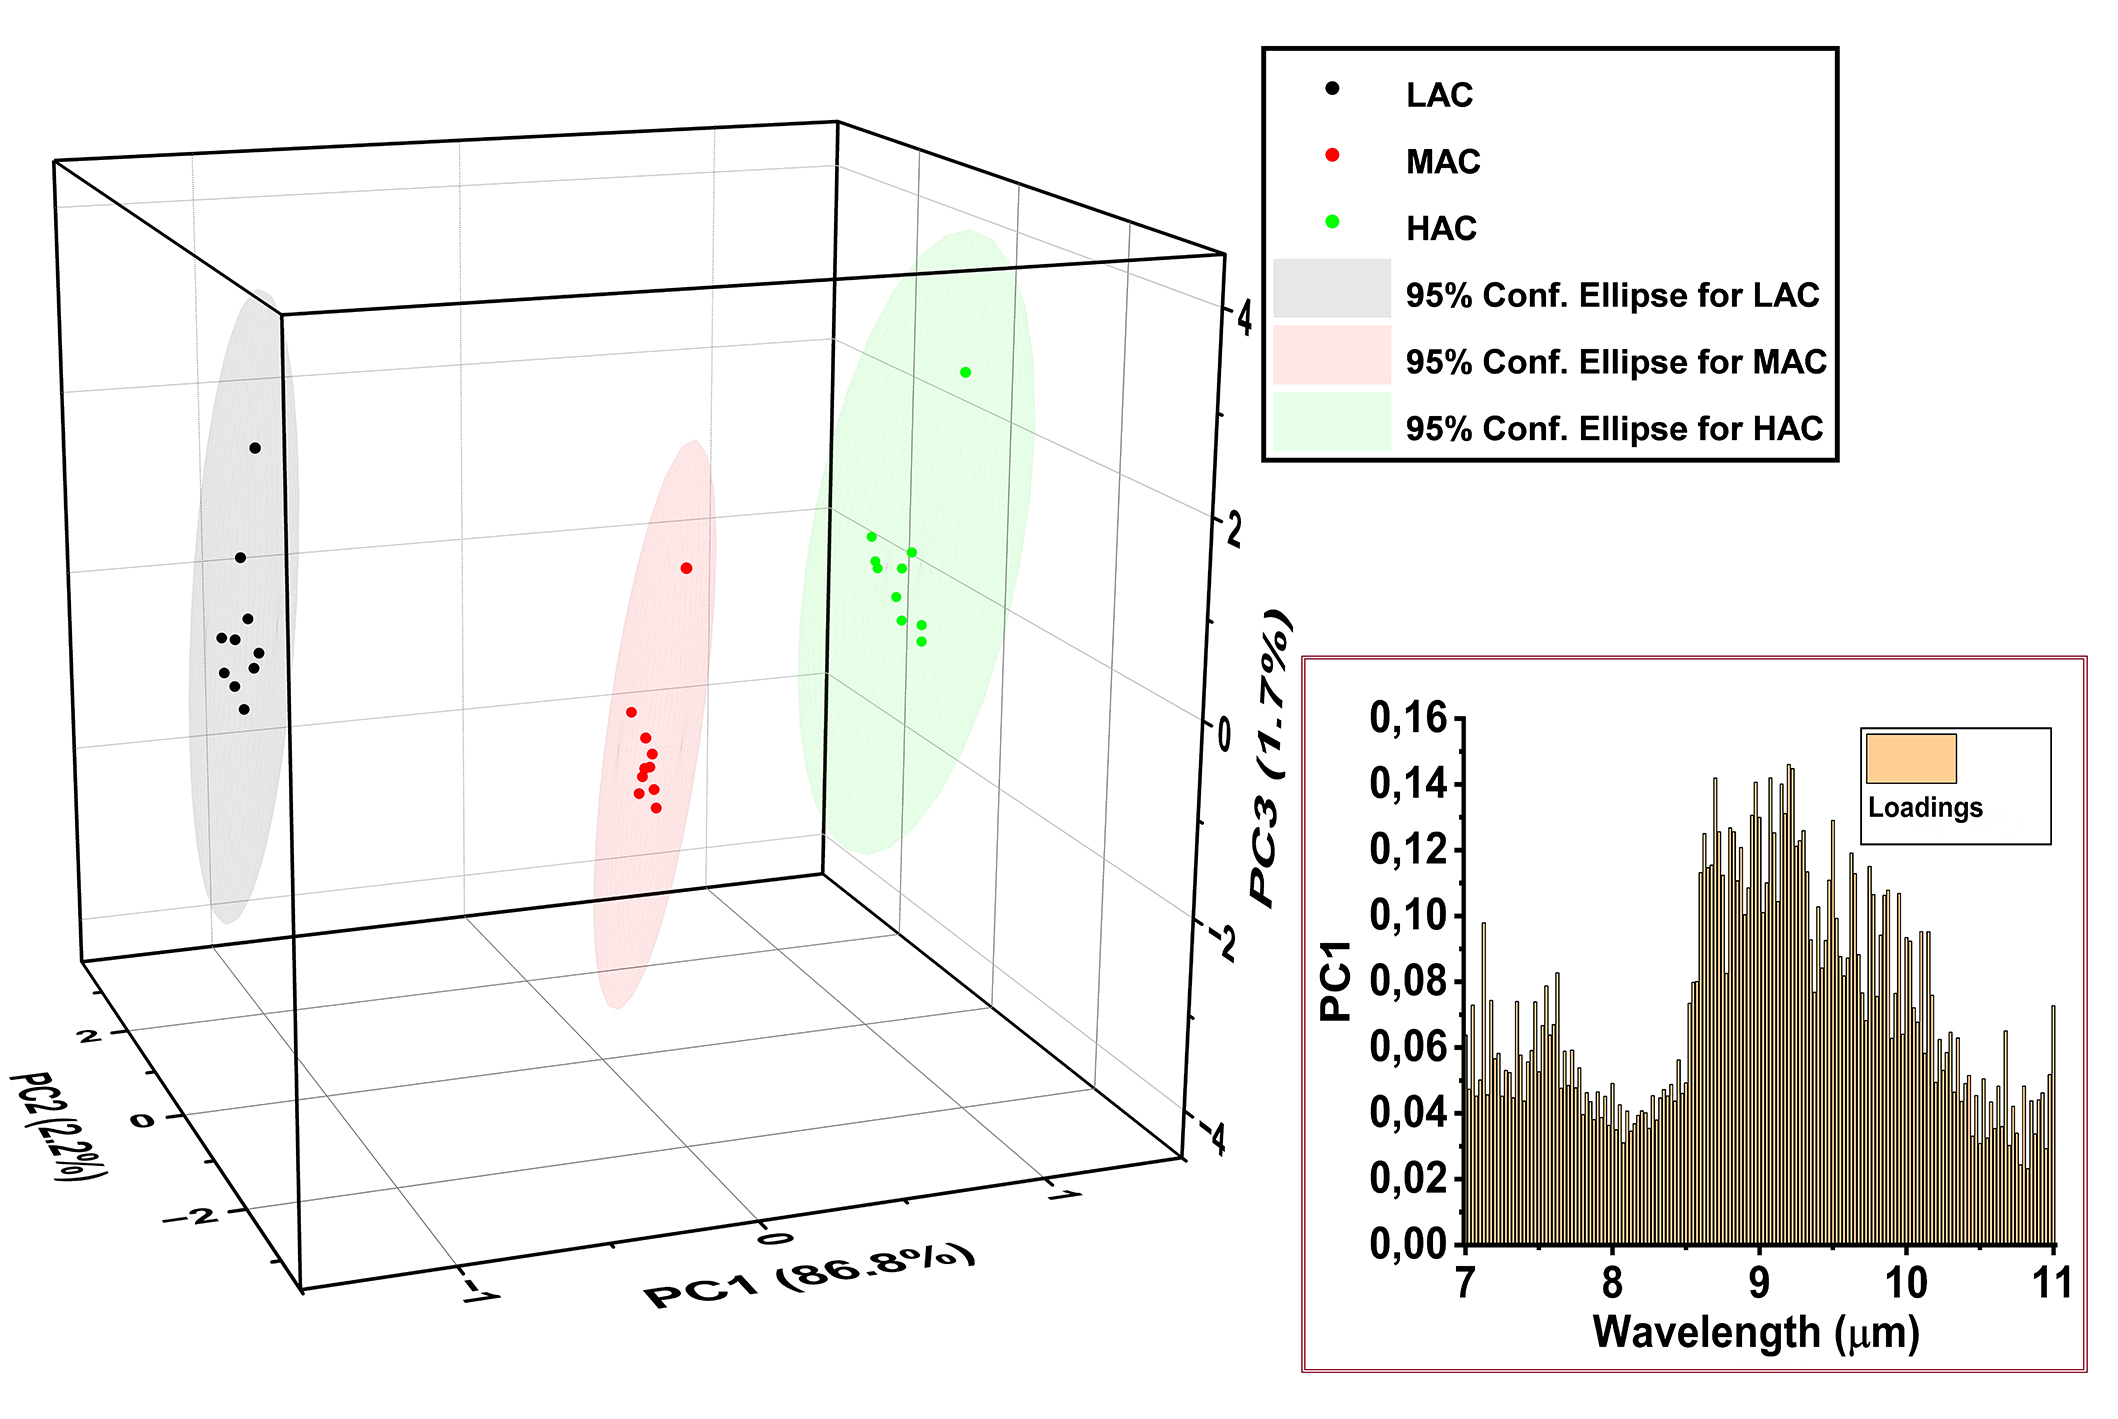
Score plot and PC1 loading plot of PCA performed over the original LPAS set-up data. LAC: low amylose content; MAC: medium amylose content; HAC: high amylose content; LPAS: laser photoacoustic spectroscopy; PCA: principal component analysis; PC1: principal component 1
These findings underscore the robustness of PCA in capturing nuanced relationships between spectral data and AC, offering valuable insights into the compositional analysis of rice flour using LPAS.
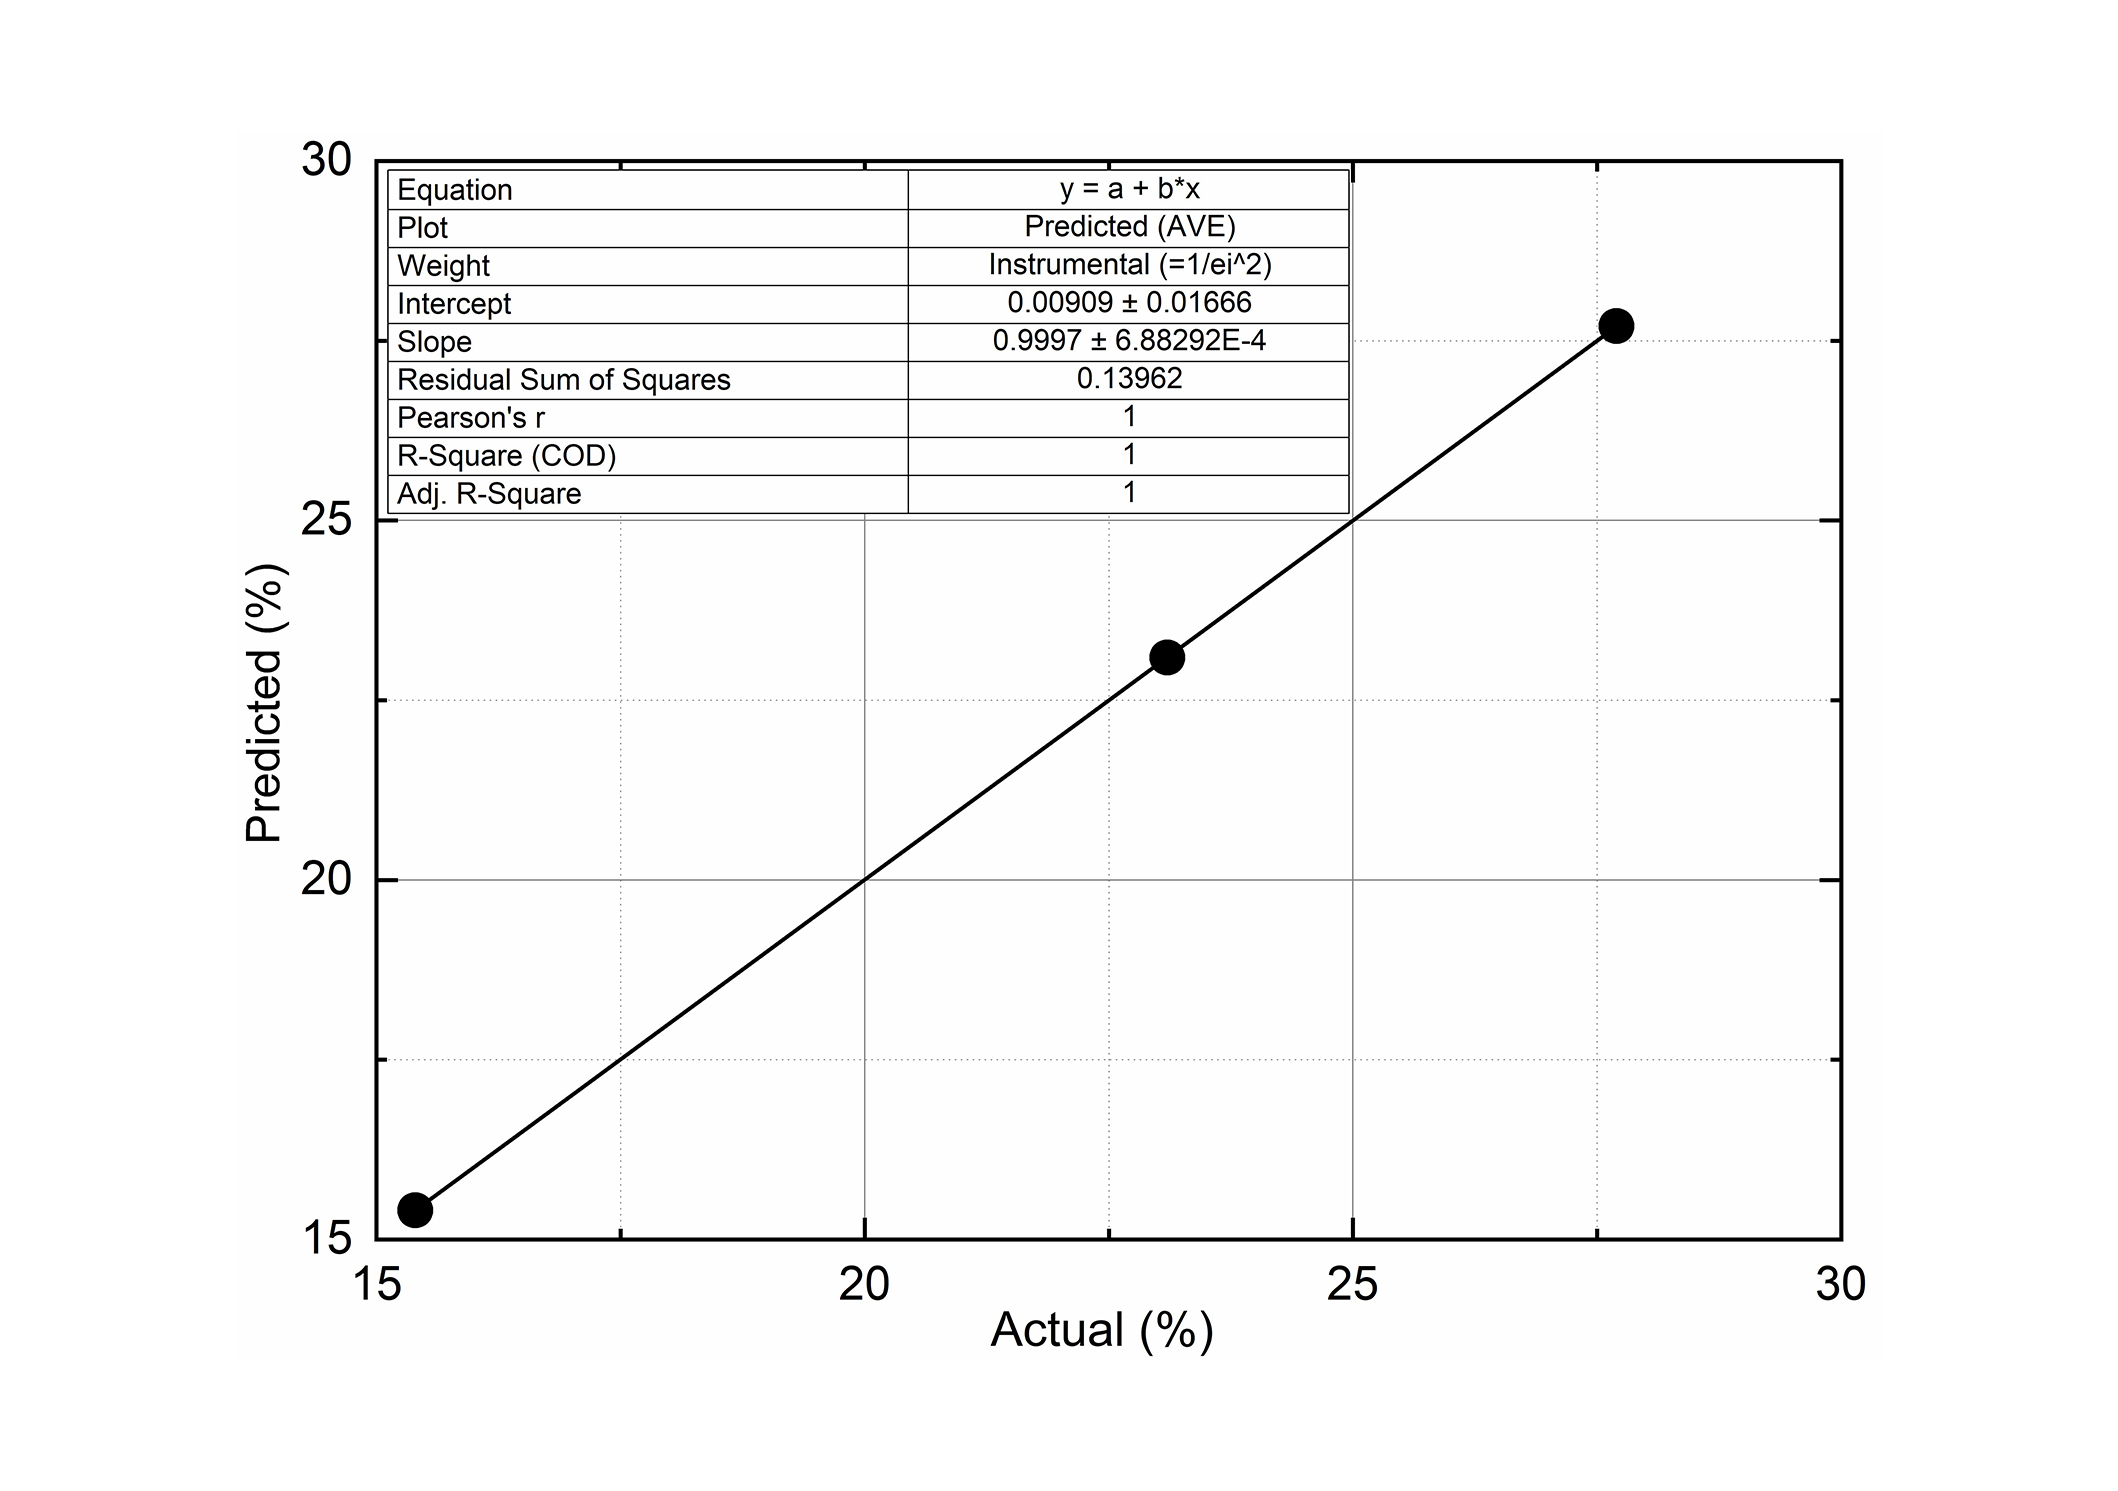
Given the promising PCA results, we further explored the power of the chemometric tools through the application of PLS. The PLS analysis converged with four factors, explaining 93.2% of the variance for X and 99.9% of the variance for Y variables. This convergence was evaluated using the root mean square of the predicted residual sum of squares [27]. Table 2 summarizes the PLS findings and Figure 7 reports the difference between the predicted and actual values of AC in the investigated samples.
PLS results
| Actual AC* (%) | Predicted AC* (%)(Average ± statistical error) | Absolute difference (%) |
|---|---|---|
| 15.40 | 15.41 ± 0.02 | 0.01 |
| 23.10 | 23.09 ± 0.03 | 0.01 |
| 27.70 | 27.70 ± 0.01 | 0.00 |
AC* stands for “amylose content”. The maximum absolute difference, defined as the absolute value of the difference between the observed value and the predicted value (residual), is 0.01%. The maximum statistical error is 0.03%. For all samples, the absolute difference is less than the statistical error
The results of our exploring work on the application of LPAS technique to the assessment of AC in rice flours are encouraging. The samples have been preliminary analyzed by a FTIR/ATR system to pinpoint the unique spectral features of rice starch within the infrared range and to interpret the behavior of the LPAS spectral response.
The FTIR spectra reported in Figure 2 reflect the typical features of rice starch. A literature-based [29–31] IR band assignment has been attempted. FTIR spectra of the three flour samples showed O-H stretching modes in the region 3000–3600 cm–1 and a broad band between 2800–3000 cm–1 that can be assigned to the C-H stretching. Bands between 1200–1700 cm–1 (8.3–5.9 μm) are related to low intensity bending, twisting, and stretching modes and are affected also by different rice flour components including proteins and fats [31]. Our attention has been focused on the region between 900 and 1200 cm–1 (11.1–8.3 μm) where most of the spectral signatures of the carbohydrates are visible and intense. The vibrations originating from C-O-C of α-1,4 glycosidic linkages, and are assigned to the IR absorption band at 928 cm–1 (10.8 μm). Bands localized at 1148 cm–1 (8.7 μm), 1077 cm–1 (9.3 μm), 1077–995 cm–1 (10.0–9.9 μm) are due to C-O stretching, C-O-H bending and C-C stretching modes respectively and are also mostly related to the starch carbohydrate molecules (amylose and amylopectin) [29, 30].
The heights of the vibrational band at 995 cm–1 in the individuated carbohydrates fingerprint region were used to verify the response of the FTIR signal to the different ACs (Figure 3). The good linear fit confirms that the region between 8.5–10 μm should be selected for LPAS investigation.
Measurements of PA signals emitted by the rice flour samples detected from 7.0 to 11.0 μm and reported in Figure 4, are in accordance with the FTIR results. Two broad bands may be identified: between 7.0–8.0 μm (1428–1250 cm–1) and within 8.5–10.0 μm (1176–1000 cm–1). The spectral signature between 7.0–8.0 μm mirrors the behavior observed in the FTIR analysis: the band exhibits relatively weak intensities. In contrast, the absorptions generating LPAS spectral features between 8.5 and 10.0 μm and ascribable to transitions of the vibrational modes of C-O and C-C bonds of amylose (carbohydrates fingerprint region) [29, 30] show elevated intensities, notably displaying a distinctive and pronounced feature at 9.3 μm. The fit of the 9.3 μm band heights reported in Figure 5 shows excellent linearity, thus proving that the application of this method could be considered promising for amylose assessment.
Encouraged by those results, the ability of LPAS to discriminate the three samples under investigation and predict their amylose level has been further afforded through PCA and PLS analysis.
The PCA results reported in Figure 6 show that the three rice flour mixtures are distinctly separated along the PC1 axis following the AC trend. PC1 explains the 86.8% of the overall covariance predominantly due to the variability within the wavelength between 8.5–10.0 μm, where the intensity of the broad LPAS bands is more pronounced and that can be considered the fingerprint region of amylose. The clear amylose fingerprint between 8.5 and 10.0 μm and the distinct separation of the three concentrations by PCA suggested that PLS would correctly predict the concentrations, and indeed the difference between predicted and actual amylose is significantly less than the statistical error of the measurement.
The results presented in this paper highlight the potential of LPAS as a rapid and non-destructive method for predicting AC in rice samples for preliminary rapid screening and routine quality control applications. Comparison with FTIR/ATR analysis allowed us to identify the IR spectral range most useful for the investigation by LPAS method, which was restricted to the region between 8.5–10.0 μm. The multivariate analysis treatment based on the PCA and PLS applied to the set of spectral data confirmed that LPAS shows promise as an alternative method for amylose assessment in rice flour.
LPAS offers several advantages, including rapid analysis, non-destructive nature, and minimal sample preparation requirements. However, challenges such as instrument optimization, standardization of measurement protocols, and calibration model development and validation need to be addressed to facilitate the widespread adoption of this technique in rice quality analysis. The method requires additional validation through comparison with conventional chemical measurement techniques and should be optimized by measurements on a broader range of samples, encompassing different varieties of commercial rice flours. Future research directions include also the investigation of other spectroscopic techniques, such as Raman spectroscopy, for rice quality assessment. Additionally, the development of portable LPAS devices for on-site analysis and the integration of machine learning algorithms for data analysis could further enhance the applicability and accuracy of LPAS in predicting AC and other quality parameters in rice and other food crops.
AC: amylose content
ATR: attenuated total reflectance
FTIR: Fourier transform infrared
HAC: high amylose content
LAC: low amylose content
LPAS: laser photoacoustic spectroscopy
MAC: medium amylose content
MIR: medium infrared region
NIR: near infrared
PA: photoacoustic
PC1: principal component 1
PCA: principal component analysis
PLS: partial least squares
QCLs: quantum cascade lasers
FA: Conceptualization, Investigation, Formal analysis, Writing—original draft, Writing—review & editing. CC: Formal analysis, Writing—review & editing. LF: Conceptualization, Formal analysis, Funding acquisition, Writing—review & editing. IG: Investigation, Methodology, Data curation, Writing—review & editing. MF: Investigation, Data curation, Writing—review & editing. FP: Software, Writing—review & editing. AL: Conceptualization, Investigation, Writing—review & editing. MN and IM: Resources. All authors read and approved the submitted version.
The authors declare that there are no conflicts of interest regarding the publication of this article.
Not applicable.
Not applicable.
Not applicable.
Data are available on request.
This study was carried out within the METROFOOD-IT project and has received funding from the European Union–Next Generation EU, PNRR-Mission 4 “Education and Research” Component 2: from research to business, Investment 3.1: Fund for the realisation of an integrated system of research and innovation infrastructures. This manuscript reflects only the authors’ views and opinions, neither the European Union nor the European Commission can be considered responsible for them. The funders had no role in study design, data collection and analysis, decision to publish, or preparation of the manuscript.
© The Author(s) 2024.
Copyright: © The Author(s) 2024. This is an Open Access article licensed under a Creative Commons Attribution 4.0 International License (https://creativecommons.org/licenses/by/4.0/), which permits unrestricted use, sharing, adaptation, distribution and reproduction in any medium or format, for any purpose, even commercially, as long as you give appropriate credit to the original author(s) and the source, provide a link to the Creative Commons license, and indicate if changes were made.

Stella A. Ordoudi, Maria Z. Tsimidou
Nikolaos Nenadis, Maria Z. Tsimidou
David Heath ... Nives Ogrinc
Alexandros Nakas ... Andreana N. Assimopoulou
Gabriel Mustatea, Elena L. Ungureanu
Sandra Gueifão ... Inês Coelho
Despoina Langari, Fani Th. Mantzouridou
Eleni Zymvrakaki ... Urania Menkissoglu-Spiroudi
Arianna Latini ... Patrizia Galeffi
Aggeliki Kalogeropoulou ... Triantafyllos Albanis
Pierpaolo Di Bitonto ... Sabina Tangaro
Maria Z. Tsimidou ... Claudia Zoani