
Abstract
Aim:
To investigate the effects of allitol on the cecal microbiota profile of high-fat diet-induced obese rats to obtain basic data and to predict the pathway of butyric acid production from allitol using bioinformatic techniques. Moreover, this study examined whether the anti-obesity effect of allitol was due to butyric acid produced by gut microbiota.
Methods:
Sixteen male Wistar rats were divided into two groups: control (C) and 5% allitol-supplemented (A). The rats were provided free access to the experimental diets for 11 weeks. Following the feeding period, the body weight, body fat, cecal short-chain fatty acids, and cecal microbiota profiles were determined.
Results:
Body fat percentage was significantly lower in Group A than in Group C. Group A had a significantly higher abundance of the phylum Bacteroidota than Group C, whereas there were no differences in the abundance of Bacillota, Actinomycetota, and Pseudomonadota. Changes in the microbiota indicated a significant increase in the abundance of 10 genera and a significant decrease in the abundance of 14 genera in Group A compared to Group C. The cecal butyric acid content was significantly higher in Group A than in Group C. Functional analysis of PICRUSt2 showed that many enzymes belonging to the metabolic pathway that produces butyric acid from allitol are induced. However, the cecal bacteria involved in the anti-obesity effect differed from those involved in butyric acid production.
Conclusions:
This study demonstrated several compositional changes in the cecal microbiota and an increase in butyric acid production following dietary allitol supplementation. The anti-obesity effect of allitol was confirmed; however, it was suggested that the butyric acid produced by the intestinal bacteria may not be responsible for this effect.
Keywords
Rare sugar, allitol, microbiota profile, butyric acid, short-chain fatty acids, ratIntroduction
Obesity is a long-lasting and complex condition characterized by excess fat accumulation that can affect health. Obese increases the risk of developing type 2 diabetes, heart disease, and specific types of cancer, including all that can affect the overall quality of life [1]. Recently, rare sugars have gained attention because of their potential as functional foods with anti-obesity properties. According to The International Society of Rare Sugars (2002), rare sugars are monosaccharides and their derivatives that are naturally less common than typical sugars, such as D-glucose and D-fructose, and can serve as supplements, functional food additives, and medications. Multiple studies have shown that rare sugars may have positive health effects when used as low-calorie carbohydrate sweeteners and bulking agents [2–6]. In the last two or three decades, rare sugars such as D-allulose (D-psicose), D-sorbose, D-tagatose, and L-sugars, have been developed as alternative sweeteners [5–8]. Allitol, a rare sugar, is a sugar alcohol formed by linking D- and L-hexoses in a process known as izumoring [9], and is created by converting D-allulose [10]. In nature, allitol, along with D-allulose, grows naturally in Itea plant, which are deciduous shrubs belonging to the saxifrage family [11]. We have previously shown that allitol may have anti-obesity effects in rats that are comparable to or stronger than those of D-allulose and that allitol has been determined to be somewhat safe for rats and humans to consume [12–14].
Our previous studies showed that dietary allitol resulted in a greater increase in cecal weight and surface area of rats than maltitol [15] or fructooligosaccharide [16], which are both highly fermentable carbohydrates. This suggested that allitol is a highly fermentable sugar alcohol. Moreover, we showed that the content of cecal short-chain fatty acids (SCFAs) was significantly increased by allitol, primarily butyric acid [17]. Recent studies have reported that the intestinal microbiota produces butyric acid, which has anti-obesity effects [18–21]. Therefore, we hypothesized that the anti-obesity effect of allitol was due to the production of butyric acid by the gut microbiota. However, the mechanisms underlying the microbial activity of allitol remains unclear. Thus, this study aimed to investigate the effect of allitol on the cecal microbiota profile of high-fat diet-induced obese rats to obtain basic data and predict the pathway of butyric acid production from allitol using bioinformatic techniques. Furthermore, this study examined whether the anti-obesity effect of allitol was due to butyric acid produced by gut microbiota.
Materials and methods
Materials
Allitol was sourced from the International Institute of Rare Sugar Research and Education (Kagawa, Japan). Soybean oil and beef tallow were purchased from Yamakei Industry Co. Ltd. (Osaka, Japan). Mineral and vitamin mixtures (AIN-76) were obtained from Oriental Yeast Co. Ltd. (Tokyo, Japan). The remaining components of the diet were food-grade and sourced from Fonterra (Auckland, New Zealand), Mitsui DM Sugar Holdings, Nippon Paper Industries, and Oji Cornstarch (Tokyo, Japan). All other reagents were provided by FUJIFILM Wako Pure Chemical Industries (Osaka, Japan) and Nacalai Tesque (Kyoto, Japan).
Animals, diets, and experimental design
Sixteen male Wistar rats (mean weight: 52 g, range: 42–58 g), aged 3 weeks, were bought from Japan SLC (Shizuoka, Japan) and were housed separately at a temperature of 22° ± 1°C, with lighting from 08:00 to 20:00. The rats were fed MF, a commercial rodent diet (Oriental Yeast Co., Ltd., Tokyo, Japan), and water for three days. Rats were randomly divided into two groups: control (C) and allitol (A). The rats in Group C were fed a control diet, whereas those in Group A were fed an allitol diet. The control diet was a synthetic diet containing the following ingredients in grams per kilogram: casein, 200.0; DL-methionine, 3.0; corn starch, 149.9; sucrose, 300.0; soybean oil, 20.0; beef tallow, 230.0; mineral mixture, 35.0; vitamin mixture, 10.0; cellulose, 50.0; choline chloride, 2.0; butylhydroxytoluene, 0.1. The allitol diet was prepared by replacing 50 g of sucrose in the control diet with 50 g of allitol. The rats were provided free access to the experimental diets and water for 11 weeks. High doses of allitol can induce diarrhea in rats (data not shown); hence, Group A rats were incrementally acclimated to 1−5% allitol for the initial 3 weeks. Daily measurements included body weight and food consumption. Following the feeding period, all rats were euthanized by decapitation at 09:00 without prior fasting. The intra-abdominal adipose tissues and cecum were removed and stored at −80°C. Carcass samples were provided by removing the head and remains from the intra-abdominal and intra-thoracic tissues and were stored at −20°C.
Analysis
Carcass fat (almost equivalent to subcutaneous fat) was quantified using the method described by Mickelsen and Anderson [22], and total body fat, including intra-abdominal fat, was determined using the method described by Paik and Yearick [23]. Analysis of SCFAs in the cecal contents was performed by Techno Suruga Laboratory Co., Ltd. (Shizuoka, Japan). DNA was extracted from the cecal contents using the ZymoBIOMICS DNA Mini Kit (Zymo Research, CA, USA). Microbial community profiling was performed on an Illumina MiSeq (San Diego, CA, USA) using 16S rRNA amplicon sequencing of DNA from cecal contents with primers that specifically targeted the 16S rRNA V3/V4 region. PCR amplification, purification, and quantification, according to the Illumina (CA, USA) 16S Metagenomic Sequencing Library Preparation Protocol, were outsourced to Genome-Lead, Co. Ltd. (Takamatsu, Kagawa). Raw data were visualized and analyzed using QIIME2 (https://qiime2.org). The predicted functional characteristics of the microbial community based on Enzyme Commission numbers (EC) were determined using PICRUSt2 [24] based on the proportion of marker gene sequences in the samples.
Data analysis
All phenotypic data are expressed as mean and SE. Statistical analyses were performed using Excel Statistics (Social Survey Research Information Co. Ltd., Tokyo, Japan). The statistical significance of α-diversity between Groups C and A was evaluated using Mann-Whitney U-test. The statistical significance of β-diversity between Groups C and A was evaluated using Pairwise PERMANOVA. All other data from Groups C and A were analyzed using the Welch’s t-test. For all analyses, statistical significance was set at P < 0.05.
Results
No differences were observed in weekly mean body weight (Figure 1), final body weight and food intake between Groups C and A, whereas the body fat percentage was significantly lower in Group A than in Group C (Figure 2). The cecal weight and surface area were significantly greater in Group A than in Group C (Figure 2).
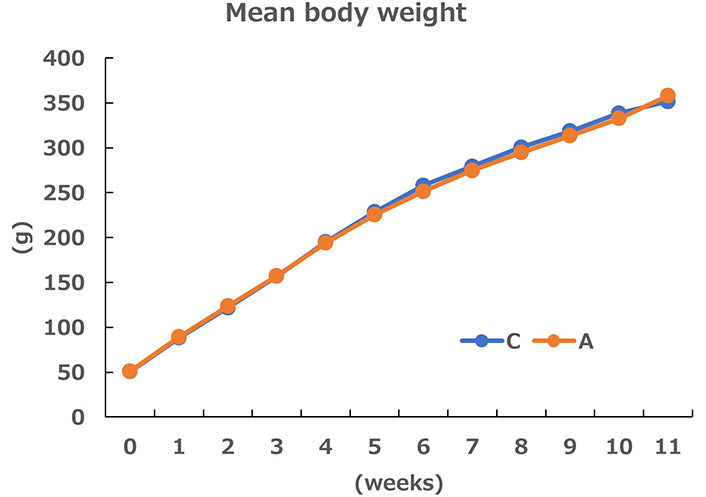
Weekly changes in the mean body weight (n = 8) of rats in the control (C) and allitol (A) groups
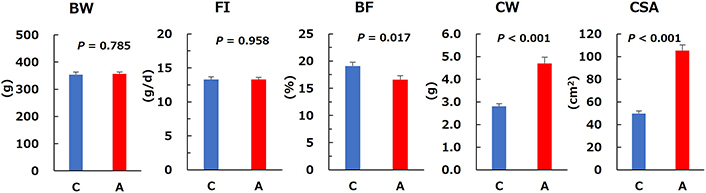
Basic characteristics of control (C) and allitol (A) groups. BW: body weight; FI: food intake; BF: body fat; CW: cecal weight; CSA: cecal surface area. Values are the mean and SE for eight rats. P-values were obtained using Welch’s t-test
α-Diversity between the two groups was compared using two different indices (the Chao 1 index [operational taxonomic unit (OTU) richness estimation]) (Figure 3A) and Pielou’s evenness index (OTU evenness index) (Figure 3B). These α-diversities revealed no statistically significant differences between Groups C and A. The overall structure of the cecal microbiota between Groups C and A was evaluated using the β-diversity indices calculated for weighted (Figure 3C) and unweighted (Figure 3D) UniFrac distances. Principal coordinate analysis (PCoA) revealed microbial structural differences between Groups C and A in weighted (P = 0.033) and unweighted (P = 0.182) UniFrac distances.
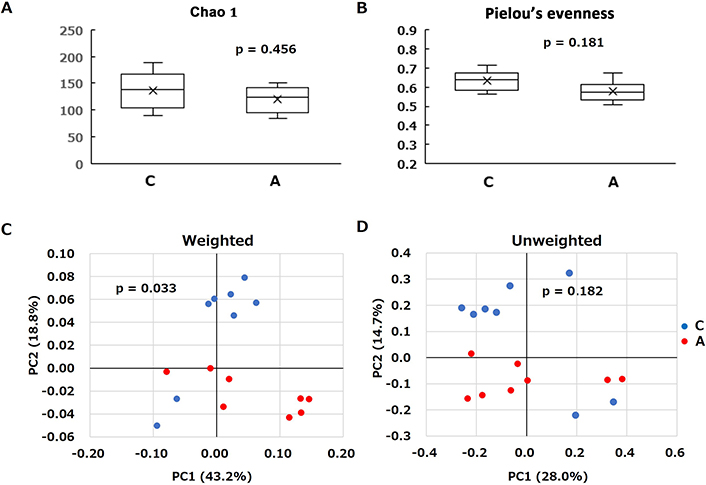
α-Diversity indices and principal coordinate analysis plots of the control (C) and allitol (A) groups. α-Diversity indices, the Chao 1 index (OTU richness estimation) A and the Pielou’s evenness index (OTU evenness estimation) B were compared using Mann-Whitney U-test. β-Diversity was calculated using weighted C and unweighted D UniFrac distances, and significance was analyzed using the Pairwise PERMANOVA test. OTU: operational taxonomic unit
Differences in the cecal microbial structure were initially assessed taxonomically at the phylum level (Figure 4A). Consistent with a previous study [25], the microbiota composition of both groups was dominated by four main phyla, Bacillota (Figure 4B), Bacteroidota (Figure 4C), Actinomycetota, and Pseudomonadota. Group A had a significantly higher abundance of the phylum Bacteroidota than Group C, whereas there were no differences in the abundance of Bacillota, Actinomycetota, and Pseudomonadota.
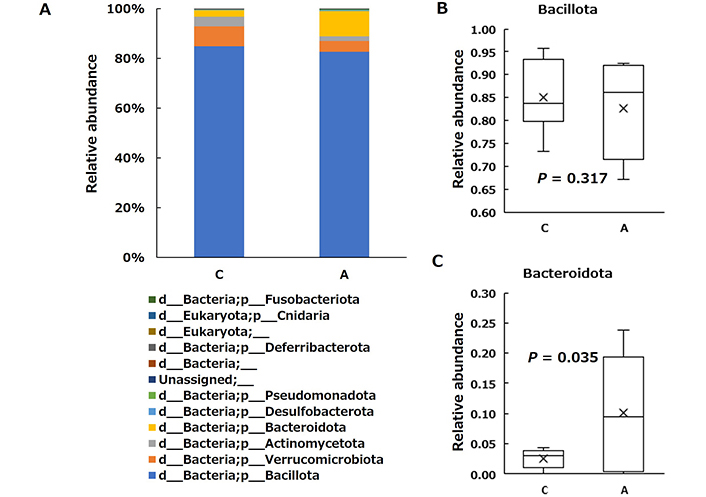
Relative abundance of the taxonomic composition of the cecal microbial community at the phylum level in the control (C) and allitol (A) groups. C and A represent the control and allitol groups, respectively. Each component of the cumulative bar graph on the left indicates a phylum A. On the right side of the image shows the representative phyla (Bacillota B; and Bacteroidota C) evaluated using Welch’s t-test
Pearson’s correlations between the relative abundance of representative microbiota and body fat percentage in rats was examined (Figure 5). Body fat percentage was significantly positively correlated with Bacillota (Figure 5A) and significantly negatively correlated with Bacteroidota (Figure 5B).
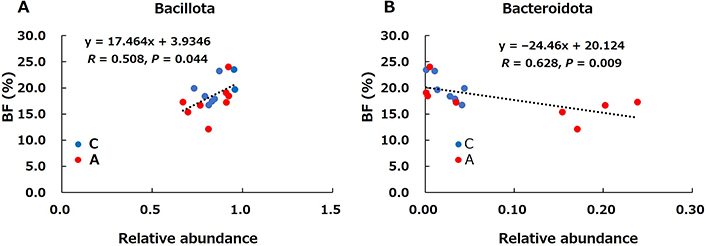
Correlation between body fat (%) and relative abundance of the representative phyla (Bacillota A; and Bacteroidota B) in the control (C) and allitol (A) groups. BF: body fat
Taxonomic changes in the microbial communities were assessed at the genus level. As shown in Figure 6 and Table 1, changes in the microbiota indicated a significant increase in the abundance of 10 genera and a significant decrease in the abundance of 14 genera in Group A compared with Group C. These were characterized by an increase in the abundance of the genera Tannerellaceae, uncultured Lachnospiraceae, Alistipes, RF39, Mitochondria, Anaerostipes, Bacteroides, Muribaculaceae, Lachnospiraceae_UCG-010, uncultured Unassigned, and by a decrease in the abundance of the genera Bifidobacterium, Parvibacter, Paludicola, Adlercreutzia, Romboutsia, uncultured Eggerthellaceae, Blautia, [Eubacterium]_xylanophilum_group, Streptococcus, uncultured Anaerovoracaceae, Candidatus_Stoquefichus, uncultured Atopobiaceae, uncultured Desulfovibrionaceae, Mucispirillum (Table 1).
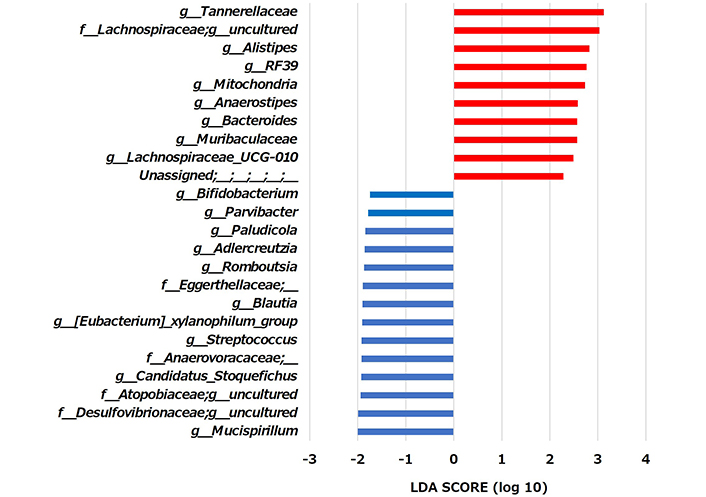
Comparative analyses of the taxonomic composition of the microbial community at the genus level. The significant differences (P < 0.05) in genera between the control and allitol groups were presented. Genera that increased with the allitol diet are indicated by red bars, and genera that decreased are indicated by blue bars. LDA: linear discriminant analysis
Relative abundance (%) of cecal microbiota at the genus level in the control (C) and allitol (A) groups
| Domein | Phylum | Class | Ordaer | Family | Genus | C | A | P |
|---|---|---|---|---|---|---|---|---|
| Bacteria | Bacteroidota | Bacteroidia | Bacteroidales | Tannerellaceae | Tannerellaceae | 0.01 ± 0.00 | 0.02 ± 0.01 | 0.027 |
| Bacteria | Bacillota | Clostridia | Lachnospirales | Lachnospiraceae | Uncultured | 0.00 ± 0.00 | 0.01 ± 0.00 | 0.047 |
| Bacteria | Bacteroidota | Bacteroidia | Bacteroidales | Rikenellaceae | Alistipes | 0.03 ± 0.00 | 0.19 ± 0.07 | 0.031 |
| Bacteria | Bacillota | Bacilli | RF39 | RF39 | RF39 | 0.02 ± 0.00 | 0.15 ± 0.05 | 0.018 |
| Bacteria | Pseudomonadota | Alphaproteobacteria | Rickettsiales | Mitochondria | Mitochondria | 0.01 ± 0.00 | 0.07 ± 0.02 | 0.012 |
| Bacteria | Bacillota | Clostridia | Lachnospirales | Lachnospiraceae | Anaerostipes | 3.89 ± 2.37 | 18.7 ± 2.05 | < 0.001 |
| Bacteria | Bacteroidota | Bacteroidia | Bacteroidales | Bacteroidaceae | Bacteroides | 0.76 ± 0.19 | 3.60 ± 0.01 | 0.023 |
| Bacteria | Bacteroidota | Bacteroidia | Bacteroidales | Muribaculaceae | Muribaculaceae | 1.23 ± 0.42 | 5.74 ± 1.95 | 0.035 |
| Bacteria | Bacillota | Clostridia | Lachnospirales | Lachnospiraceae | Lachnospiraceae_UCG-010 | 0.18 ± 0.04 | 0.73 ± 0.26 | 0.049 |
| Unassigned | Uncultured | Uncultured | Uncultured | Uncultured | Uncultured | 0.05 ± 0.01 | 0.14 ± 0.02 | 0.005 |
| Bacteria | Actinomycetota | Actinobacteria | Bifidobacteriales | Bifidobacteriaceae | Bifidobacterium | 2.74 ± 0.77 | 1.21 ± 0.51 | 0.045 |
| Bacteria | Actinomycetota | Coriobacteriia | Coriobacteriales | Eggerthellaceae | Parvibacter | 0.06 ± 0.02 | 0.02 ± 0.01 | 0.044 |
| Bacteria | Bacillota | Clostridia | Oscillospirales | Ruminococcaceae | Paludicola | 0.03 ± 0.00 | 0.00 ± 0.00 | 0.007 |
| Bacteria | Actinomycetota | Coriobacteriia | Coriobacteriales | Eggerthellacea | Adlercreutzia | 0.07 ± 0.01 | 0.02 ± 0.01 | 0.008 |
| Bacteria | Bacillota | Clostridia | Peptostreptococcales-Tissierellales | Peptostreptococcaceae | Romboutsia | 7.01 ± 1.35 | 1.85 ± 0.37 | 0.008 |
| Bacteria | Actinomycetota | Coriobacteriia | Coriobacteriales | Eggerthellaceae | Uncultured | 0.08 ± 0.02 | 0.02 ± 0.00 | 0.041 |
| Bacteria | Bacillota | Clostridia | Lachnospirales | Lachnospiraceae | Blautia | 1.76 ± 0.37 | 0.35 ± 0.08 | 0.002 |
| Bacteria | Bacillota | Clostridia | Lachnospirales | Lachnospiraceae | [Eubacterium]_xylanophilum_group | 1.07 ± 0.38 | 0.20 ± 0.07 | 0.041 |
| Bacteria | Bacillota | Bacilli | Lactobacillales | Streptococcaceae | Streptococcus | 0.20 ± 0.07 | 0.03 ± 0.01 | 0.005 |
| Bacteria | Bacillota | Clostridia | Peptostreptococcales-Tissierellales | Anaerovoracaceae | Uncultured | 0.04 ± 0.00 | 0.00 ± 0.00 | 0.008 |
| Bacteria | Bacillota | Bacilli | Erysipelotrichales | Erysipelatoclostridiaceae | Candidatus_Stoquefichus | 3.13 ± 0.88 | 0.49 ± 0.18 | 0.026 |
| Bacteria | Actinomycetota | Coriobacteriia | Coriobacteriales | Atopobiaceae | Uncultured | 0.12 ± 0.03 | 0.01 ± 0.00 | 0.006 |
| Bacteria | Desulfobacterota | Desulfovibrionia | Desulfovibrionales | Desulfovibrionaceae | Uncultured | 0.18 ± 0.06 | 0.00 ± 0.00 | 0.033 |
| Bacteria | Deferribacterota | Deferribacteres | Deferribacterales | Deferribacteraceae | Mucispirillum | 0.16 ± 0.07 | 0.00 ± 0.00 | 0.046 |
Values are the mean ± SE for eight rats. The P-values were obtained using Welch’s t-test
SCFAs production results are provided in Figure 7. Cecal acetic acid content was significantly lower in Group A than in Group C, whereas propionic acid content did not differ between the two groups. Cecal butyric acid and total SCFAs contents were significantly higher in Group A than in Group C. The predicted main microbial pathway for butyrate production from allitol in rat cecum is shown in Figure 8. After conversion to D-allulose, allitol pass through D-allulose-6-phosphate, D-fructose-6-phosphate, and the glycolytic system produces pyruvic acid. Butyryl-CoA is generated via pyruvic acid and acetyl-CoA or the citric cycle and succinate. Butyryl-CoA is converted to butyric acid by the key enzyme, butyryl-CoA:acetate-CoA transferase (BAT). Potential differences in the function of the microbial community were evaluated using the PICRUSt2 software. The relative abundances of the predicted enzymes in the cecal microbiota associated with butyric acid production from allitol in Groups C and A are shown in Figure 9. The relative abundances of D-allulose-6-phosphate 3-epimerase (APE), 6-phosphofructokinase (PFK), fructose-bisphosphate aldolase (FBA), phosphoglycerate mutase (PM), pyruvate carboxylase (PC), BAT, trans-2-enoyl-CoA reductase (NAD+) (TER), 4-hydroxybutyrate CoA-transferase (HBT), and 3-hydroxybutyryl-CoA dehydratase (3HBD) were significantly higher in Group A than in Group C.
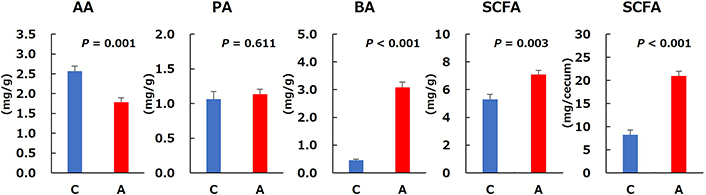
Short-chain fatty acids in rat cecal contents in the control (C) and allitol (A) groups. AA: acetic acid; PA: propionic acid; BA: butyric acid; SCFA: short-chain fatty acid. Values are the mean and SE for eight rats. The P-values were obtained using Welch’s t-test
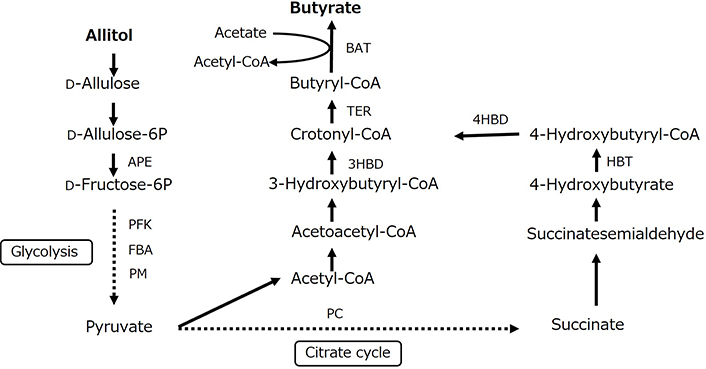
Prediction of the microbial pathway for butyrate production from allitol in rat cecum. APE: D-allulose-6-phosphate 3-epimerase; PFK: 6-phosphofructokinase; FBA: fructose-bisphosphate aldolase; PM: phosphoglycerate mutase; PC: pyruvate carboxylase; BAT: butyryl-CoA:acetate-CoA transferase; TER: trans-2-enoyl-CoA reductase (NAD+); HBT: 4-hydroxybutyrate CoA-transferase; 4HBD: 4-hydroxybutyryl-CoA dehydratase; 3HBD: 3-hydroxybutyryl-CoA dehydratase
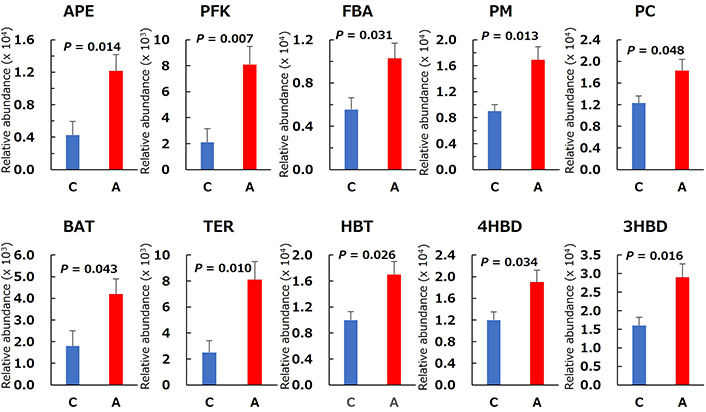
Relative abundance of predicted enzymes in the cecal microbial community related to butyrate production in the control (C) and allitol (A) groups. Values are the mean and SE for eight rats. The P-values were obtained using Welch’s t-test. APE: D-allulose-6-phosphate 3-epimerase; PFK: 6-phosphofructokinase; FBA: fructose-bisphosphate aldolase; PM: phosphoglycerate mutase; PC: pyruvate carboxylase; BAT: butyryl-CoA:acetate-CoA transferase; TER: trans-2-enoyl-CoA reductase (NAD+); HBT: 4-hydroxybutyrate CoA-transferase; 4HBD: 4-hydroxybutyryl-CoA dehydratase; 3HBD: 3-hydroxybutyryl-CoA dehydratase
Using multiple regression analysis, six genera of cecal bacteria were identified as predictor variables for cecal butyric acid levels, and eight genera were identified as predictor variables for body fat percentage. The correlations between these bacteria and cecal butyric acid or body fat are shown in Table 2. The abundances of Tannerellaceae, RF39, and Anaerostipes were significantly and positively correlated with cecal butyric acid. The abundances of Bacteroides, Lachnospiraceae_UCG-010, [Eubacterium]_xylanophilum_group, and Mucispirillum were significantly and negatively correlated with body fat, whereas Bifidobacterium, Adlercreutzia, and Streptococcus were significantly and positively correlated with body fat.
Correlation between cecal microbiota and butyric acid and between cecal microbiota and body fat
| Genus | Butyric acid | Body fat | ||
|---|---|---|---|---|
| R | P | R | P | |
| Tannerellaceae | 0.36 | 0.036 | ||
| RF39 | 0.44 | 0.012 | ||
| Anaerostipes | 0.74 | < 0.001 | –0.18 | 0.181 |
| Blaitia | –0.68 | 0.090 | ||
| Atopobiaceae uncultured | –0.68 | 0.076 | ||
| Bacteroides | 0.44 | 0.191 | –0.64 | 0.006 |
| Lachnospiraceae_UCG-010 | –0.47 | 0.046 | ||
| Bifidobacterium | 0.48 | < 0.001 | ||
| Adlercreutzia | 0.46 | 0.001 | ||
| [Eubacterium]_xylanophilum_group | –0.02 | 0.009 | ||
| Streptococcus | 0.42 | 0.007 | ||
| Mucispirillum | –0.02 | < 0.001 | ||
R: correlation coefficient
Discussion
In the current study, body fat accumulation in rats was suppressed by the long-term consumption of the allitol diet without altering their body weight or food intake (Figure 2). Furthermore, the allitol diet considerably increased cecum weight, surface area, and SCFAs, especially butyric acid, in rats. These results indicated that allitol has anti-obesity properties and is strongly fermentable in the gastrointestinal tracts. These results support our previous studies [12, 14–17]. SCFAs regulate almost every cellular and physiological function in the body by acting as ligands for G protein-coupled receptors (GPCRs) [26]. GPR41 and GPR43 are the most important SCFA receptors in the GPCR family [27] and are abundantly expressed in sympathetic ganglia and fatty tissues, respectively [27, 28]. SCFAs have been reported to increase energy expenditure and lipolysis via these receptors [27, 28]. Acetic, propionic, and butyric acids are the most common SCFAs found in the bodies of mammals, especially in their intestinal tracts [29]. Butyric acid is the SCFA with the most significant systemic effect. Numerous studies have indicated a strong association between butyric acid and obesity [18–21]. Research on microbiota composition has shown that individuals with obesity tend to have decreased levels of bacteria that produce butyric acid [30]. Therefore, we hypothesized that the anti-obesity effect of allitol was due to the production of butyric acid by the gut microbiota and investigated the mechanism underlying the microbial activity of allitol.
We described the changes in the relative abundance of the cecal microbiota due to dietary allitol. To the best of our knowledge, this is the first study to examine the effects of the rare sugar allitol on rat gut microbiota. First, the overall differences in microbial structure between Groups C and A were analyzed using both weighted and unweighted UniFrac distances. As shown in Figure 3C, the weighted PCoA indicated significant structural differences between these two groups. Thus, a shift from Group C to Group A was observed in the composition of cecal microbiota. No significant differences were observed in the α-diversity indices between the two groups, indicating that diversity was not enhanced by dietary allitol within the group.
The important finding in this study was that dietary allitol significantly increased the Bacteroidota phylum (Figure 4C), and the abundance of Tannerellaceae, Alistipes, Bacteroides, and Muribaculaceae, belonging to the Bacteroidota phylum (Table 1), at the genus levels in Group A. Moreover, body fat percentage was a significantly positively correlatied with Bacillota (Figure 5A) and a significantly negative correlation with Bacteroidota (Figure 5B). Obese mice have a lower percentage of Bacteroidota and a higher percentage of Bacillota than lean mice [31], and similar results have been established in humans [32]. Several studies have confirmed that obesity due to a high-fat diet increases the Bacillota-Bacteroidota ratio, which has been reported as a good marker for predicting obesity [33, 34]. In this study, the Bacillota-Bacteroidota ratio was lower in the Group A (8.2 ± 1.1) than in the Group C (33.2 ± 5.0). These results were consistent with those of previous studies. Another important finding of this study is that dietary allitol altered many cecal bacteria at the genus level (Figure 6, Table 1). The relative abundance of Bacteroides, which is known to improve obesity [34, 35], and Anaerostipes and Muribaculaceae, known butyric acid and SCFAs producers [36, 37], were higher in Group A than in Group C. Santacruz et al. [38] reported that Bacteroides numbers were lower in overweight women, and that increased Bacteroides numbers were associated with increased levels of high-density lipoprotein cholesterol and lower levels of triacylglycerol. The abundances of Adlercreutzia, Streptococcus, and Romboutsia which are known to increase in obesity [39–42], were lower in Group A than in Group C. These results suggest that dietary allitol promotes anti-obesity effects and butyrate production by altering the composition of the intestinal microbiota.
In this study, we demonstrated that dietary allitol promotes SCFAs production, especially butyric acid, by increasing the abundance of butyric acid-producing bacteria. Furthermore, functional analysis of PICRUSt2 showed that several enzymes belonging to the metabolic pathway that produces butyric acid from allitol were induced (Figures 8 and 9). However, as shown in Table 2, the cecal bacteria involved in the anti-obesity effect differed from those involved in butyric acid production. Furthermore, cecal butyric acid and total SCFAs did not correlate with body fat percentage in rats (R = –0.335, P = 0.820 and R = –0.333, P = 0.853, respectively). These facts refute the hypothesis that the anti-obesity effect of allitol is primarily due to butyric acid produced by the intestinal microflora. Of course, butyric acid and other SCFAs are involved in the suppression of obesity; therefore, the anti-obesity effects of butyric acid may not be entirely absent. The anti-obesity effects of dietary allitol may be attributed to unknown mechanisms that need to be elucidated in the future. Butyric acid has been reported to have many beneficial effects. Gao et al. [43] reported that dietary supplementation with butyric acid can prevent and treat diet-induced insulin resistance in mice and that the mechanism is related to the promotion of energy expenditure and induction of mitochondrial function. Canani et al. [44] showed that butyric acid regulates the transport of fluids across epithelial cells, improves mucosal inflammation and oxidative status, strengthens the protective barrier of epithelial cells, and affects the sensitivity of internal organs and intestinal movements. Moreover, an increasing number of studies have highlighted the importance of butyric acid in the prevention and inhibition of cancer [45]. Furthermore, butyric acid affects the brain function. Sodium butyrate pharmacologically affects gene expression in the brain and has various positive effects on neurodegenerative diseases and behavioral disorders by inhibiting histone deacetylases [46]. These findings suggest that dietary allitol exerts various beneficial effects via butyric acid production by the intestinal microbiota, which should be investigated in the future.
Finally, we report on the inconvenience of using dietary allitol. The abundance of Bifidobacterium, a beneficial bacterium [47], was reduced by an allitol diet and was significantly positively correlated with body fat percentage. This result was unexpected and contradicted the results of many previous studies; however, the details remain unknown. Further studies are needed to investigate changes in dietary conditions and concurrent ingestion of various non-digestible sugars. Functional analysis using PICRUSt2 revealed that more than 200 metabolic pathways were altered by the allitol diet (data not shown). Therefore, it is necessary to examine the various functions of allitol as a functional carbohydrate.
The limitations of this study should be mentioned. First, this study focused exclusively on allitol and did not compare it to other rare sugars such as D-allulose or non-digestible sugars. Perhaps, allitol produces butyric acid more effectively than other sugars; therefore, we would like to study this in more detail. Second, in this experiment, we specifically decided to examine the cecal microbiota in detail and did not analyze serum or liver biomarkers. Alterations in the cecal microbiota may affect serum and liver biomarkers. Third, there was a great deal of individual rat variation in the relative abundance of the taxonomic composition of the cecum. Whether the strain of rats (Wistar) and the number of animals (n = 8) used in this study were appropriate is slightly questionable. There is room to reconsider these limitations.
In conclusion, this study demonstrated several compositional changes in the cecal microbiota and an increase in butyric acid production following dietary allitol supplementation. The anti-obesity effect of allitol was confirmed; however, it was suggested that the butyric acid produced by the intestinal bacteria may not be responsible for this effect. However, since allitol intake increases the abundance of bacterial genera such as Bacteroides and Muribaculaceae, which are associated with anti-obesity effects, probably the cecal microbiota profile is involved in the anti-obesity effects of dietary allitol. Althogh many beneficial effects of butyric acid have been reported, the unknown effects of dietary allitol, a precursor of butyrate, need to be investigated in the future.
Abbreviations
| 3HBD: | 3-hydroxybutyryl-CoA dehydratase |
| 4HBD: | 4-hydroxybutyryl-CoA dehydratase |
| APE: | D-allulose-6-phosphate 3-epimerase |
| BAT: | butyryl-CoA:acetate-CoA transferase |
| FBA: | fructose-bisphosphate aldolase |
| GPCRs: | G protein-coupled receptors |
| HBT: | 4-hydroxybutyrate CoA-transferase |
| OTU: | operational taxonomic unit |
| PC: | pyruvate carboxylase |
| PCoA: | principal coordinate analysis |
| PFK: | 6-phosphofructokinase |
| PM: | phosphoglycerate mutase |
| SCFAs: | short-chain fatty acids |
| TER: | trans-2-enoyl-CoA reductase (NAD+) |
Declarations
Acknowledgments
The authors thank Mr. Koki Takahashi for providing the animal care and technical assistance.
Author contributions
SM, AY, and KA: Resources. GT: Data curation, Investigation. SH and RI: Formal analysis. TM: Conceptualization, Data curation, Writing—original draft, Writing—review & editing, Investigation.
Conflicts of interest
The authors declare that they have no conflicts of interest.
Ethical approval
All animal procedures were approved by the Animal Care and Use Committee for Kagawa University (approval number 23616).
Consent to participate
Not applicable.
Consent to publication
Not applicable.
Availability of data and materials
Data can be provided for any qualified researchers on reasonable request.
Funding
This study was partially supported by the JSPS KAKENHI [JP 22K05408]. The funders had no role in study design, data collection and analysis, decision to publish, or preparation of the manuscript.
Copyright
© The Author(s) 2025.
Publisher’s note
Open Exploration maintains a neutral stance on jurisdictional claims in published institutional affiliations and maps. All opinions expressed in this article are the personal views of the author(s) and do not represent the stance of the editorial team or the publisher.