
Abstract
Aim:
Hypertension (HTN) is a major cause of heart failure but the precise pathways by which HTN leads to heart failure are not resolved. Newer echocardiographic techniques permit assessment of myocardial contraction in different orientations defining left ventricular (LV) shortening as percentage longitudinal, circumferential and radial strain.
Methods:
A systematic search was conducted of Medline and Embase. The search was conducted from the inception of each database on June 30, 2022. Search terms “left ventricular strain” or speckle tracking AND heart failure with preserved ejection fraction or diastolic dysfunction AND HTN.
Results:
Six studies were identified and subject to detailed review. LV ejection fraction (LVEF) was not significantly different in patients with heart failure with preserved ejection fraction (HFpEF) and HTN compared to individuals with or without HTN. Global longitudinal strain (GLS) and global circumferential strain (GCS) were significantly (P < 0.0001) different (lower) in patients with HFpEF and HTN compared to patients with HTN without HFpEF and control individuals without HTN or other conditions. In contrast, global radial strain (GRS) was not significantly (P < 0.054) different in patients with HFpEF and HTN compared to individuals without HTN or other conditions. GRS was significantly (P < 0.01) different in individuals with HFpEF and HTN compared to individuals with HTN.
Conclusions:
Assessment of LV strain is an important advance in the assessment of LV function in patients with HTN and HFpEF as it identifies patients with reduced LV strain while there was no difference in LVEF. GLS and GCS provide the best separation between patients with HFpEF and HTN compared to individuals with HTN without HFpEF. This study advances the possibility of redefining the classification of heart function and heart failure for patients with HTN by either classifying patients mainly by LV strain or sub-classifying patients with HTN and HFpEF by LV strain.
Keywords
Hypertension, heart failure with preserved ejection fraction, left ventricular strainIntroduction
Hypertension (HTN) is a major cause of heart failure but the precise pathways by which HTN leads to heart failure are not resolved. Several pathways have been proposed that lead to heart failure with reduced ejection fraction (HFrEF) or heart failure with preserved ejection fraction (HFpEF) [1]. HFpEF comprises nearly half of all patients with heart failure and is growing in prevalence [2]. HTN is frequently associated with HFpEF [3] implicating HTN as an important potential cause of HFpEF.
One advancement in the field of assessment of cardiac function is the introduction of the concept of cardiac strain and the techniques to assess it. Myocardial strain is a dimensionless index of length change between two given points, which reflects the degree of myocardial deformation [4]. Cardiac contraction is due to the shortening of myocardial fibers that have different orientations at various levels of the heart [5–7]. Myocardial fibers have a longitudinal arrangement on the oblique parts of the heart and a circumferential arrangement on other parts of the heart [6]. Contraction of myocardial fibers that have different orientations produces deformation in different directions that translates into left ventricular (LV) shortening that can be measured as percentage longitudinal, circumferential and radial strain [8, 9]. Longitudinal strain evaluates the apex-base deformation, circumferential, strain evaluates circumferential deformation while radial strain represents radial thickening of the myocardium [8, 10]. The distribution and angulation of myofibers in all layers of the heart contribute to each of these three kinds of strain [8]. It has only been recently possible to readily assess changes in myocardial contractility in the different orientations in the heart. Speckle tracking echocardiography permits a quantitative assessment of myocardial motion that is reflective of different layers of the heart [11]. This technique provides accurate and angle-independent measurements of LV dimensions [12]. There is evidence that assessment of myocardial strain may be superior to the LV ejection fraction (LVEF) as a predictor of major adverse cardiac events [13, 14].
Assessment of myocardial strain has advanced the assessment of cardiac functional changes during chemotherapy for various malignancies which involves the use of potentially cardiac toxic drugs [15]. The question is the extent to which myocardial strain can identify abnormalities in cardiac contractile function in patients with HTN and HFpEF. The objective of this study is to determine whether LV strain is significantly different in patients with HTN and HFpEF compared to patients with HTN or individuals without HTN. In addition, myocardial strain will be compared to the standard assessment of cardiac contractility namely LVEF.
Materials and methods
Literature search
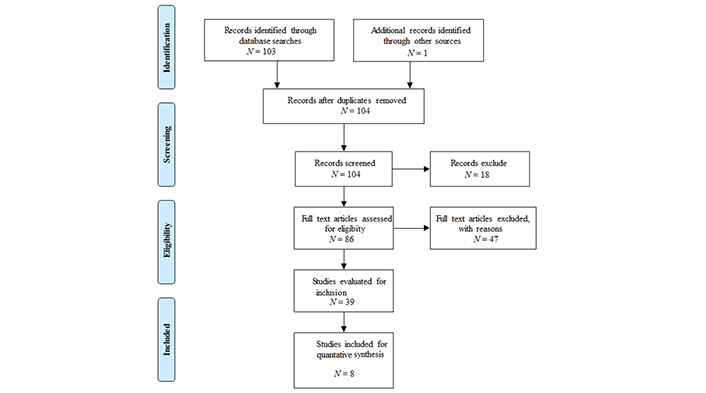
A systematic search was conducted of Medline and Embase. The search was conducted from the inception of each database on June 30, 2022. Search terms “left ventricular strain” or speckle tracking AND heart failure with preserved ejection fraction or diastolic dysfunction were used in conjunction with Boolean operators to identify articles reporting LV strain in patients with HFpEF and HTN. Because there was no primary patient or animal contact, there was no requirement for approval from our research ethics committee. The search was conducted according to the Preferred Reporting Items for Systematic reviews and Meta-Analyses (PRISMA) (Figure 1) [16].
Titles and abstracts were screened to identify articles for full-text review. The inclusion criteria included echocardiographic measurement of LV strain. The exclusion criteria were articles that were: (i) not published in English (ii) involved non-human subjects (iii) non-primary research articles (reviews, editorials, or letters commenting on an article) (iv) pediatric age population (v) unrelated to the investigated topic, e.g., only focused on electrocardiogram (ECG) and ECG pattern of LV hypertrophy and strain (vi) relevant data could not be extracted from the paper.
The following items were extracted from each paper, authors, year of publication, age, sex, LV global longitudinal strain (GLS), global circumferential strain (GCS), and global radial strain (GRS). Tanacli et al. [17] presented data for subendocardial, mid-myocardial, and subepicardial strains that were averaged together with the resultant considered as global LV strain. If a study presented the data as median and interquartile range or mean [confidence interval (CI)], and mean (standard error), the data were converted to mean and standard deviation by utilizing equations suggested in the Cochrane handbook for systematic reviews of interventions [18].
Statistical analysis
Results were quantified using forest plot depicting the standard difference of means, 95% confidence interval, and P-value. The meta-analysis was performed using Comprehensive Meta-Analysis (Biostat Inc., NJ, and USA). In-study heterogeneity in the meta-analysis was tested using Q, Cochran’s I2 statistic and Tau2 where variance is described by standard error of the mean (SEM). Otherwise, the data is presented as the mean and standard deviation (SD).
Results
The initial search produced 103 studies and with one identified through other sources, 104 studies were screened and then relevant studies were assessed and evaluated for inclusion (Figure 1). Eight studies were included for quantitative synthesis (Table 1) [17, 19–26]. Excluded were studies that focused on HFpEF in animal models [23].
Age, sex, and proportion of HTN in patients in the studies
| Authors | HTN | HTN and HFpEF | Control | ||||||
|---|---|---|---|---|---|---|---|---|---|
| Age | Sex (% M) | % HTN | Age | Sex (% M) | % HTN | Age | Sex (% M) | % HTN | |
| Stoichescu-Hogea et al. [26] | 61 | 52 | 100 | 63 | 67.7 | 85.5 | 60 | 55 | 0 |
| He et al. [19] | 51 | 56 | 100 | 56 | 62 | 100 | 49 | 50 | 0 |
| Tanacli et al. [17] | NA | NA | NA | 73 | 60 | 70 | 68 | 60 | 0 |
| Mordi et al. [24] | 70 | 77 | 100 | 71 | 32 | 76 | 68 | 50 | 0 |
| Liu et al. [20] | 62 | NA | 93 | 61 | NA | 82 | 58 | NA | 0 |
| Minatoguchi et al. [25] | 70 | 59 | 100 | 75 | 60 | 100 | 69 | 61 | 0 |
| Gregorova et al. [22] | 63.3 | 26.3 | 89.5 | 68.5 | 30.4 | 87 | 63 | 38.1 | NA |
| Kraigher-Krainer et al. [21] | 71 | 39 | 100 | 72 | 39 | 90 | 69 | 32 | 0 |
NA: not available; M: male
LVEF was not significantly different in patients with HFpEF compared to individuals without HTN or other conditions (Figure 2) as well as compared to those with HTN (Figure 3).
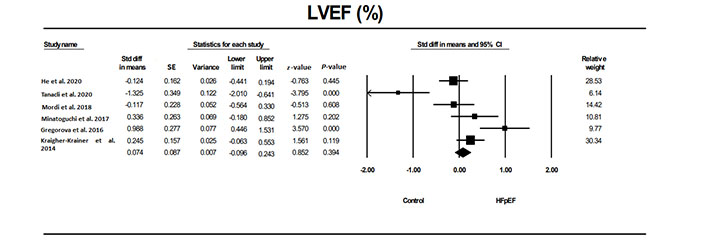
The forest plot for LVEF in studies that examined it in patients with HFpEF compared to a control group without HTN or other conditions. The relative weight that each study contributed to the overall standard difference in means is also shown. There was significant heterogeneity between studies with a Q = 31.3, I2 = 84, and Tau2 = 0.252 + 0.207. ←: the CI extends beyond the scale; std: standard; diff: difference
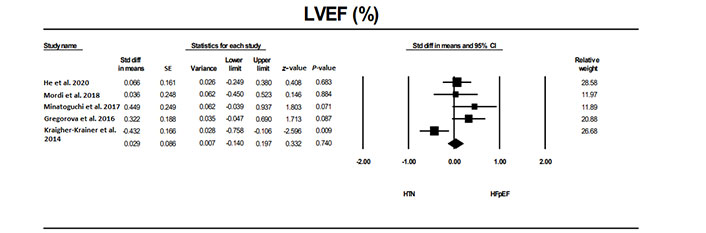
The forest plot for LVEF in studies that examined it in patients with HFpEF compared to a group with HTN. The relative weight that each study contributed to the overall standard difference in means is also shown. There was heterogeneity between studies with a Q = 53.7 (P = 0.001), I2 = 88.8, and Tau2 = 0.332 + 0.226
GLS was significantly (P < 0.0001) different in patients with HFpEF and HTN compared to control individuals without HTN or other conditions (Figure 4). The odds ratio (OR), the ratio of the odds in the HFpEF with HTN vs. the HTN group, was 8.9 (z = 16.0, P < 0.001). Although there was significant heterogeneity between studies, all but one study showed a significant difference and it was only the magnitude of the difference which varied between studies. Evaluation for publication bias using the classic fail-safe N showed a relative lack of publication balance as it would take 518 studies to reverse the significant findings. The values for trim and fill were for the fixed model 1.205 (1.046–1.365), for random model 1.588 (0.874–2.301) and the values were unchanged using trim and fill.
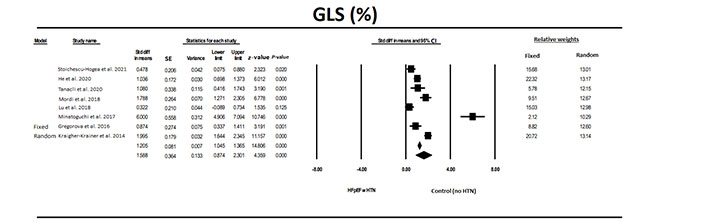
The forest plot for GLS in eight studies that examined patients with HFpEF compared to a control group without HTN or other conditions. The relative weight that each study contributed to the overall standard difference in means is also shown. There was significant heterogeneity between studies with a Q = 31.5 (P < 0.001), I2 = 77.8, and Tau2 = 1.24 + 1.13
GLS was also significantly (P < 0.0001) different in patients with HFpEF and HTN compared to patients HTN without HFpEF (Figure 5). Although there was significant heterogeneity between studies, most studies showed a significant difference. OR in the HFpEF with HTN vs. the HTN group, was 3.03 (z = 8.9, P < 0.001). Evaluation for publication bias the classic fail-safe N was 126 indicating that it would take 126 null studies to reverse the significant findings. The values for trim and fill were for the fixed model 0.60631 (0.457–0.756), for random model 0.715 (0.259–1.172) and the values were unchanged using trim and fill analysis.
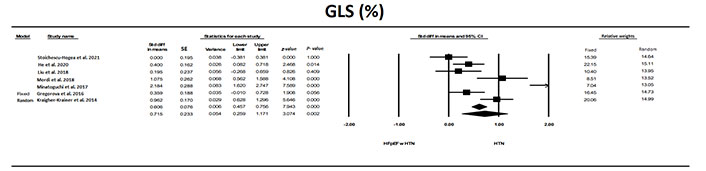
The forest plot for GLS in the seven studies that examined HFpEF in patients with HFpEF compared to patients with HTN. The relative weight that each study contributed to the overall standard difference in means is also shown. There was significant heterogeneity between studies with a Q = 36.7, I2 = 89.1, and Tau2 = 0.335 + 0.281 (SEM)
GCS was significantly (P < 0.0001) different in patients with HFpEF and HTN compared to individuals without HTN or other conditions (Figure 6). OR was 6.1, (P < 0.001). Evaluation for publication bias the classic fail-safe N was 221, indicating that it would take 221 null studies to reverse the significant findings. The values for trim and fill were for the fixed model 0.997 (0.815–1.178), for random model 1.449 (0.630–2.268) and the values were unchanged using trim and fill analysis.
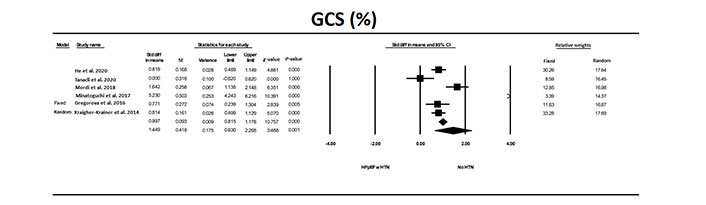
The forest plot for GCS in the six studies that examined HFpEF in patients with HTN compared to a control group without HTN or other conditions. The relative weight that each study contributed to the overall standard difference in means is also shown. There was significant heterogeneity between studies with a Q = 90.0, I2 = 94.4, and Tau2 = 0.96 + 0.75
GCS was also significantly (P < 0.0001) different in individuals with HFpEF and HTN compared to individuals with HTN (Figure 7). There was only one exception to the overall findings [17]. There was significant heterogeneity between studies. OR in the HFpEF with HTN vs. the HTN group, was 4.7 (P < 0.001). However, fail-safe N was 121 indicating that it would take 121 null studies to reverse the significant findings. The values for trim and fill were for the fixed model 0.850 (0.676–1.024), for random model 0.921 (0.429–1.41) and the values were unchanged using trim and fill analysis.
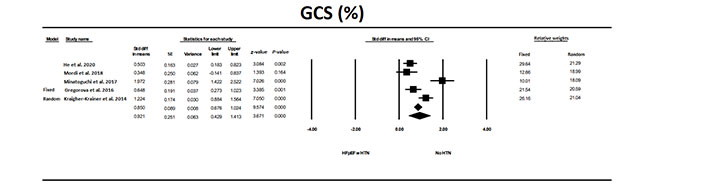
The forest plot for GCS in the five studies that examined HFpEF in patients with HTN compared to patients with HTN without HFpEF. There was significant heterogeneity between studies with a Q = 30.3, I2 = 86, and Tau2 = 0.269 + 0.229
There were few studies that evaluated GRS. GRS was not quite significantly (P < 0.054) different in patients with HFpEF and HTN compared to individuals without HTN or other conditions (Figure 8).
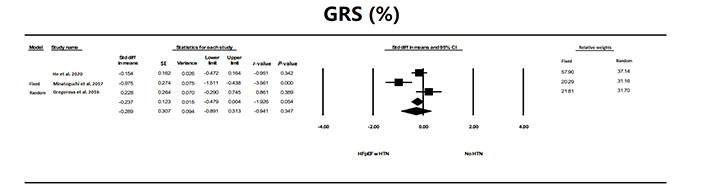
The forest plot for GRS in the three studies that examined HFpEF in patients with HFpEF compared to a control group without HTN or other conditions. The relative weight that each study contributed to the overall standard difference in means is also shown. There was significant heterogeneity between studies with a Q = 10.62 (P = 0.005), I2 = 81.2, and Tau2 = 0.228 + 0.287
GRS was significantly (P < 0.01) different in individuals with HFpEF and HTN compared to individuals with HTN (Figure 9).
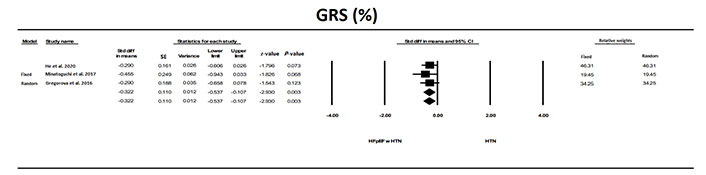
The forest plot for GRS in the three studies that examined HFpEF in patients with HTN to the overall standard difference in means is also shown. Individually the studies did not show a difference but when combined there was a significant (P = 0.004) difference with a lower GRS in patients with HFpEF and HTN. There was no significant heterogeneity between studies with a Q = 0.353 (P = 0.83), I2 = 0, and Tau2 = 0 + 0.038. The OR was 0.65, compared to individuals with HTN and no HFpEF. The relative weight that each study that contributed was shown. Evaluation for publication bias was not analyzed because of the small sample size
Discussion
The present study showed that individuals with HFpEF had reduced LV strain while there was no difference in LVEF. This finding was evident regardless of whether the comparator was individuals free of HTN or those with HTN. GLS and GCS provided the best separation between patients with HFpEF and HTN compared to individuals with HTN without HFpEF. GRS, however, did not differentiate patients with HFpEF and HTN from individuals without HTN.
This meta-analysis demonstrated a consistent and significant reduction in GLS in HFpEF in the absence of any change in LVEF. The complex LV architecture allows a fiber shortening of only 20% to be transformed into a 60% change in LV volume [9] so that small changes in LV strain are meaningful. GLS is the change in deformation from the apex to base so that a small percentage change is reflective of a reduced LV contractility. In animal studies, GLS correlates strongly with LV +dP/dtmax [27] so that reduced GLS is indicative of reduced ventricular +dP/dtmax. GLS has been demonstrated to identify early and subclinical LV dysfunction [28, 29]. Subendocardial and subepicardial layers are purported mainly responsible for longitudinal strain [8] and subendocardial layers are more likely to detect impaired cardiac function because they are more vulnerable to myocardial damage.
Longitudinal data support the value of GLS. In patients with cardiac disease, GLS is better than LVEF for predicting major adverse cardiac events [13]. In the general population, GLS provides independent and incremental prognostic information regarding long-term risk of cardiovascular morbidity and mortality [30]. GLS is better at predicting the composite cardiovascular outcome and heart failure incident beyond the Framingham risk score, the SCORE risk chart, and the modified American College of Cardiology/American Heart Association (ACC/AHA) pooled cohort equation [30]. Patients with preserved LVEF but impaired LV GLS have an increased risk of hospitalization for heart failure and all-cause mortality [31].
This meta-analysis demonstrates a consistent and significant lower GCS in HFpEF in the absence of any change in LVEF. GCS is the change in circumferential deformation or the change in length in systole along the circumferential axis of the LV. A smaller GCS is an indicator of a reduction in cardiac contractility. Mathematical modeling of LV contraction suggested that both longitudinal and mid-wall circumferential shortening contribute different extents to LV contractility depending on the degree of abnormality of myocardial shortening [32]. Circumferential shortening in systole compensates for impaired longitudinal shortening that occurs first when LV systolic dysfunction occurs [33]. GCS provides incremental independent prognostic value after considering LVEF, and late gadolinium enhancement [34].
This meta-analysis did not demonstrate a consistent and significant reduction in GRS in HFpEF. GRS is a result of fiber shortening in all layers, augmented by thickening and inward displacement of the myocardium [9]. Because GRS evaluates the change in radial deformation, GRS is an indicator of LV contractility in this dimension. In animal studies, the correlation between GRS and LV +dP/dtmax was weaker than the correlation with GLS [27], suggesting that GRS is not as good an indicator of cardiac contractility and explains why GLS and not GRS is highly significantly abnormal in HFpEF.
Szelényi et al. [35] studied patients with HTN with or without echocardiographic evidence of diastolic dysfunction—a component of HFpEF, but did not specifically study HFpEF. They found that GLS but not GCS or GRS was significantly lower in HTN compared to control and there was no significant difference in GCS or GRS between HTN with or without echo evidence of diastolic dysfunction [35].
Patients with HFpEF have limited exercise capacity which has been ascribed to increases in LV diastolic pressure with exercise. The demonstration of associated impairment in LV strain in HFpEF suggests another element that compromises cardiac output during exercise. A concept that is consistent with the idea that limited myocardial systolic function reserve may be underlying limited exercise capacity in HFpEF [36].
The superiority of LV strain over LVEF should not be unexpected. It is generally accepted that a major limitation of LVEF as an indicator of cardiac function is the dependence of LVEF on preload, afterload, chamber size, thickness, as well as its relative insensitivity to identify patients with early-stage heart failure [37, 38]. The question of whether LV systolic function is reduced in HFpEF has been controversial. Baicu et al. [39] compared 75 patients with HFpEF to 75 normal control subjects and concluded that HFpEF was associated with normal LV systolic performance. In contrast, other investigators have found that approximately one-quarter of patients with HFpEF have subtle systolic dysfunction. Other data suggest that the progression to HFpEF is mediated by processes that impair both myocardial contractility and increase myocardial stiffness [40].
This study raises the possibility of redefining the classification of heart failure. Currently, heart failure is divided into HFpEF, HFrEF, and heart failure with mid-range EF and heart failure with improved EF. We have previously proposed the classification of HFrEF with diastolic dysfunction (HrEFwDD) [41]. The present study highlights the presence of reduced systolic function in HFpEF. In a model of HFpEF, the Dahl salt-sensitive rat, reduction in GLS occurs early and continues to deteriorate until heart failure develops [42]. This study raises several novel perspectives. First, it suggests the possibility of a classification of heart failure based solely on the myocardial strain with heart failure severity being ranked according to the amount of reduction in LV strain. Another approach is that HFpEF could be sub-classified according to the degree of impairment in LV stain. A classification that includes HFpEF with small reductions in systolic function, identified by LV strain, may be beneficial as it may indicate the development of HFrEF. It would also stimulate clinical trials to test whether drugs that are effective in HFrEF will be beneficial in this subset of patients with HFpEF.
Study limitations
The limitations of the meta-analysis are well known. First, it includes dependent on the available published literature and reliance on mean results from each study rather than the use of individual data from each study participant. Second, while strain analysis is a relatively independent factor, it is not totally independent of other factors such as age, sex, and LV loading conditions [8]. Furthermore, the kind of echocardiography, necessary to define LV strain is not without its technical limitations [43]. The present meta-analysis did not examine strain in specific layers of the myocardium but rather focused on the three major global strain measurements because of their relative easy in measurement and potential extrapolation to clinical patient care. Other clinical variables that might influence HFpEF [44] could not be incorporated into the analysis. Another consideration is the small number of studies that examined myocardial strain in patients with HTN and HFpEF may have influenced the results, especially for GRS. Last, we were not able to evaluate HFpEF subtypes [45] to determine whether different subtypes showed different degrees of impairment in GLS, GCS, or GRS. Neither was it possible to do “phenomapping” of different indices of cardiac mechanics that have been proposed to represent the myocardial substrate for HFpEF [46].
In conclusion, the present study showed that individuals with HFpEF had reduced LV strain while there was no difference in LVEF. This finding was evident regardless of whether the comparator was individuals free from HTN or those with HTN. GLS or GCS were highly significantly different in patients with HFpEF and HTN compared to individuals with HTN without HFpEF. However, GRS did not differentiate patients with HFpEF and HTN from individuals without HTN. This study raises the possibility of redefining the classification of heart failure because it highlights the presence of reduced systolic function in HFpEF. A classification of HTN with (i) normal LV systolic and diastolic function (ii) HFpEF without LV systolic dysfunction (iii) HFpEF with LV systolic dysfunction (iv) HFrEF. Another approach would be to classify individuals only on the basis of LV strain. A classification that includes HFpEF with reductions in LV strain may be beneficial as it would determine whether this group progressed more rapidly to HFrEF and whether drugs that are effective in HFrEF will be beneficial in this subset of patients with HFpEF and reduced systolic function.
Abbreviations
| CI: |
confidence interval |
| GCS: |
global circumferential strain |
| GLS: |
global longitudinal strain |
| GRS: |
global radial strain |
| HFpEF: |
heart failure with preserved ejection fraction |
| HFrEF: |
heart failure with reduced ejection fraction |
| HTN: |
hypertension |
| LV: |
left ventricular |
| LVEF: |
left ventricular ejection fraction |
| OR: |
odds ratio |
Declarations
Author contributions
The author contributed solely to the work.
Conflicts of interest
The author declares that he has no conflicts of interest.
Ethical approval
Not applicable.
Consent to participate
Not applicable.
Consent to publication
Not applicable.
Availability of data and materials
Not applicable.
Funding
Not applicable.
Copyright
© The Author(s) 2023.