Abstract
Aim:
Head and neck squamous cell carcinoma (HNSC) is a major contributor to the global cancer burden. The serine protease inhibitor Kazal-type (SPINK) gene family has been linked to various cancers. This study explores the prognostic value of SPINK genes in predicting overall survival (OS) in HNSC patients.
Methods:
We analyzed RNA sequencing and clinical data from 504 cancer and 44 non-cancer samples from the TCGA database. Differential expression and functional enrichment analyses gene ontology and Kyoto encyclopedia of genes and genomes (GO and KEGG) were performed using clusterProfiler. Protein-protein interaction (PPI) networks were built with STRING and visualized. Immune infiltration was evaluated using single-sample Gene Set Enrichment Analysis (ssGSEA). Survival analysis utilized Kaplan-Meier curves and Cox regression models.
Results:
Our results showed that SPINK5, SPINK7, SPINK8, SPINK9, and SPINK14 were significantly overexpressed in normal tissues compared to carcinoma tissues, whereas SPINK1, SPINK4, and SPINK6 showed higher expression in carcinoma tissues. Correlation analysis revealed significant relationships among SPINK family members. GO and KEGG analyses highlighted their involvement in processes such as negative regulation of peptidase activity and serine-type endopeptidase inhibitor activity. PPI network analysis indicated close interactions between several SPINK proteins and other relevant proteins. Immune infiltration analysis showed that NK cells and Th2 cells were negatively correlated with SPINK genes, while mast cells and neutrophils were positively correlated. Survival analysis revealed that high mRNA expression levels of SPINK1, SPINK5, and SPINK6 were significantly associated with OS in HNSC patients. Receiver operating characteristic (ROC) curve analysis indicated that these genes have diagnostic value. We developed a nomogram model that combines tumor stage and SPINK gene expression providing a predictive tool for patient prognosis.
Conclusions:
This study elucidates the multifaceted roles of the SPINK gene family in HNSC. These findings offer valuable insights into their potential as diagnostic biomarkers and therapeutic targets.
Keywords
Biomarkers, diagnosis, genome-wide association study, head and neck squamous cell carcinomaIntroduction
Head and neck cancer is the sixth most common cancer and is a major source of the global cancer burden, accounting for about 6% of all cancer cases worldwide [1]. About 90% of head and neck cancers belong to the head and neck squamous cell carcinoma (HNSC) category [2]. There are more than 650,000 new HNSC cases annually worldwide, with 140,000 in Europe, and the incidence rate in men is higher than that in women [3, 4]. In 2018, there were reports in Europe that 3.1 percent of new HNSC patients were men, while the estimated mortality rate of HNSC in all cancer cases was 2.8 percent [5]. If HNSC is found at an early stage, there will be a higher cure rate in terms of 5-year survival rate. Over the past decade, knowledge about the molecular mechanisms driving tumor transformation and progression in HNSC has grown rapidly [6]. However, there are still some shortcomings, not only a limited number of biomarkers used in clinical practice, but also very few that have reached the stage of routine verification [7].
The serine protease inhibitor Kazal-type (SPINK) gene family consists of many family members. Presently, the members that have been discovered and identified include SPINK1 to SPINK12 [8]. The SPINK proteins are expressed in various tissues and help maintain the balance of protease activity by regulating serine proteases [9]. In addition, SPINK, a trypsin and trypsin-like inhibitor, contains at least 1 Kazal domain and 6 cysteines used to form 3 disulfide binding patterns [10, 11]. Studies have shown that the imbalance between SPINK protein and protease may lead to the occurrence of various cancers [12, 13]. However, in the context of HNSC, whether the SPINK family can be used as a prognostic biomarker has not been reported. Therefore, in this study, we will explore the prognostic value of mRNA expression in HNSC with a single SPINK family subunit.
Materials and methods
Data preparation
RNAseq data from the TCGA database (https://portal.gdc.cancer.gov) for the TCGA-HNSC project were downloaded and organized, including Trusted Platform Module (TPM) format data and clinical data (accessed by August 1, 2024). We conducted differential analysis on the original counts matrix using the DESeq2 package, following standard procedures [logFC (1) and P.adj (0.05)]. Additionally, we normalized the counts matrix using the variance stabilizing transformations method from the DESeq2 package. The HNSC expression data extracted from TCGA included 504 cancer mRNA sequences and 44 non-cancer mRNA sequences for subsequent analysis. The total number of samples with clinical information was 528. We visualize the results of the differential analysis using the ggplot2 package in R v4.2.1. The data for this study were obtained from the TCGA database and the use of this data did not require approval from the Ethics Committee. Data collection and application in accordance with TCGA release guidelines and data access policies.
SPINK family mRNA expression levels and correlation analyses
To clarify the expression differences of the SPINK gene family in HNSC, we performed a statistical analysis using the stats package in R v4.2.1. The results were visualized with the ggplot2 package. We assessed the co-expression relationship among SPINK genes using Pearson correlation coefficient analysis in R v4.2.1 and visualized the data with the ggplot2 package.
Functional analyses of SPINK genes
Gene ontology (GO) and Kyoto encyclopedia of genes and genomes (KEGG) analyses can yield gene expression data specifically for common SPINK genes. We utilized the clusterProfiler package in R v4.2.1 to conduct enrichment analysis, followed by data visualization with the ggplot2 package to clarify the functions of the gene family. The functional analysis based on GO includes three categories: biological process (BP), cellular component (CC), and molecular functionality (MF).
Construction of protein-protein interaction and genetic interaction network
Protein-protein interaction (PPI) networks offer insights into the relationships among drugs, target genes, and proteins, as well as visual representations of this information. This study utilized the STRING tool and Cytoscape v3.10.2 to evaluate PPI, focusing on the functions and physical relationships of SPINK proteins. Genetic interaction (GI) networks leverage gene function prediction sites to elucidate complex interactions among relevant genes, generated through the Gene Multiple Association Network Integration Algorithm (GeneMANIA: https://genemania.org/, accessed by August 1, 2024). Both SPINK genes and the predicted genes were displayed concurrently for comparative analysis.
Immune infiltration analysis
Using the single-sample Gene Set Enrichment Analysis (ssGSEA) algorithm from the R package Gene Set Variation Analysis (GSVA), we calculated the immune infiltration status of the cloud dataset based on markers from 24 immune cells described in the immunity article [14]. Specific markers for the 24 immune cells can be found in the relevant references, and the violin plot illustrates the differences in immune cell abundance across different groups.
Survival analysis and diagnostic analysis
Patients were categorized into high-expression and low-expression groups based on the median value of each SPINK mRNA. The prognosis of HNSC was evaluated based on overall survival (OS). The log-rank test and Kaplan-Meier estimator were used to calculate the log-rank P-value and assess OS for the SPINK gene family. Clinical information, including gender and race, was also considered. We generated receiver operating characteristic (ROC) curves to evaluate the diagnostic value of the SPINK genes. For survival analysis, we utilized the survival package to conduct proportional hazards hypothesis testing and to fit a survival regression model. The results were visualized using the survivminer and ggplot2 packages. For the column charts, the survival package was used to test hypotheses regarding proportional hazards, and Cox regression analysis was performed. The rms package was utilized to create and visualize models related to nomograms. The survival curves, ROC curves, and nomograms were all generated using R v4.2.1.
Expression of SPINK gene family in tumor stages I–IV
We investigated the expression of the SPINK gene family across different tumor stages. To do this, we utilized the stats package in R v4.2.1 and applied the Kruskal-Wallis test and Dunn’s test from the car package to analyze molecular expression differences among clinical variable groups.
Statistical analyses
R v4.2.1 was used to create correlation plots, survival curves, nomograms, ROC curves, and other data visualization. Furthermore, a P-value < 0.05 was deemed statistically significant.
Results
The mRNA expressions of SPINK in human normal tissues and carcinoma tissues
This study screened 10,666 differentially expressed genes (Figure 1). There are a total of 8 differentially expressed genes in the SPINK gene family, namely SPINK1, SPINK4, SPINK5, SPINK6, SPINK7, SPINK8, SPINK9, and SPINK14 (Figure 2). In normal tissues, the mRNA expression levels of SPINK5, SPINK7, SPINK8, SPINK9, and SPINK14 were significantly higher than in carcinoma tissues. Conversely, the mRNA expression levels of SPINK1, SPINK4, and SPINK6 were higher in carcinoma tissues than in normal tissues.
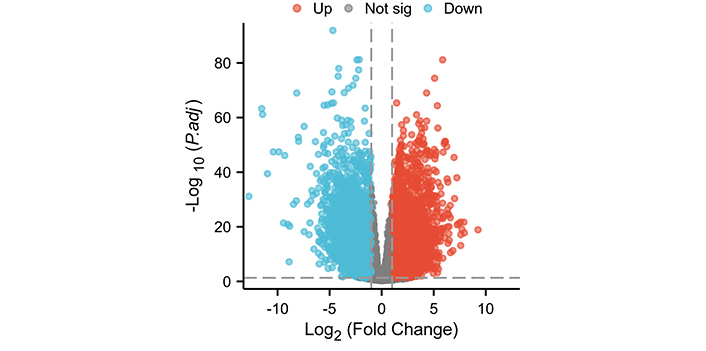
Differential expression analysis of the TCGA data set. Volcano plot of differential expression analysis of the HNSC data set. Not sig: genes that did not meet the significance criteria in the statistical analysis; HNSC: head and neck squamous cell carcinoma
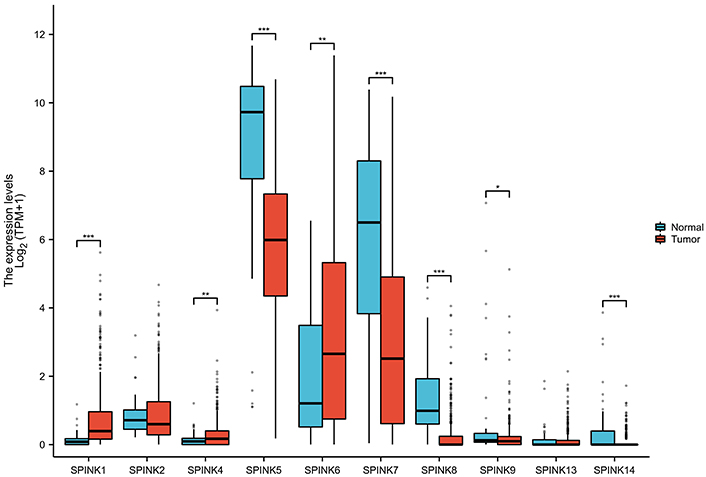
The boxplots about SPINK gene expressions in normal tissues and carcinoma tissues. Boxplot for SPINK1, SPINK4, SPINK5, SPINK6, SPINK7, SPINK8, SPINK9, and SPINK14 expressions. SPINK: serine protease inhibitor Kazal-type; *: P < 0.05; **: P < 0.01; ***: P < 0.001
Pearson correlation coefficient analysis was used to identify correlations in the mRNA expression levels of SPINK genes (Figure 3, Table S1). Asterisks denote correlated molecules, with red indicating positive correlations and blue indicating negative correlations. The strength of the correlations is categorized as follows: |r| > 0.95 indicates significant correlation; |r| ≥ 0.8 indicates high correlation; 0.5 ≤ |r| < 0.8 indicates moderate correlation; 0.3 ≤ |r| < 0.5 indicates low correlation; |r| < 0.3 indicates weak correlation. Genes in the SPINK gene family that show a correlation greater than 0.5 include SPINK5 with SPINK7 and SPINK6 with SPINK7.
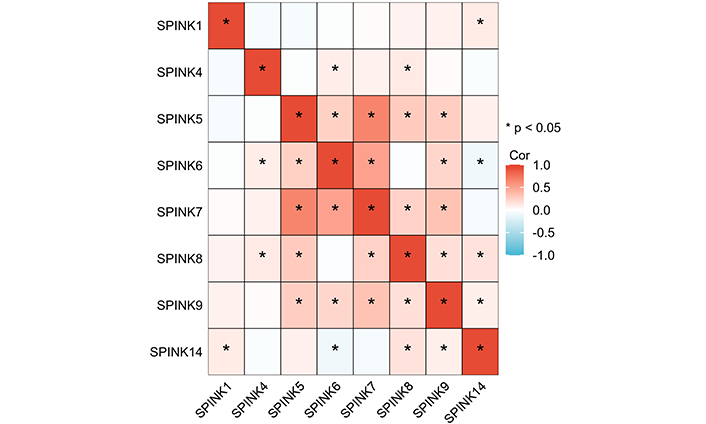
Pearson correlation coefficients for SPINK gene expression levels. The darker the color the greater the correlation. SPINK: serine protease inhibitor Kazal-type
SPINK genes’ function, pathway, and co-expression enrichment analyses
The biological functions of SPINK genes were identified using Database for Annotation, Visualization, and Integrated Discovery (DAVID) based on GO and KEGG analyses (Figure 4A, Table S2). The analysis revealed that SPINK genes were primarily enriched in several categories: They are involved in the negative regulation of peptidase activity, endopeptidase activity, proteolysis, and hydrolase activity of BP; lamellar body of CC; serine-type endopeptidase inhibitor activity, peptidase inhibitor activity, endopeptidase inhibitor activity, and endopeptidase regulator activity of MF. However, no relevant pathways were identified as enriched in the KEGG analysis.
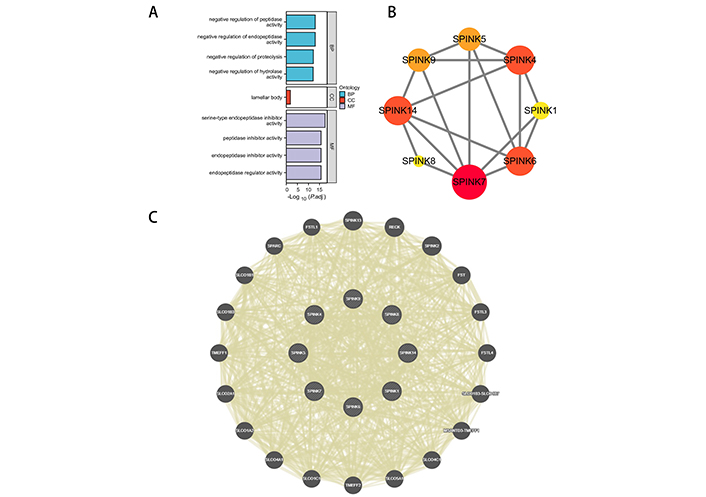
Functional analysis. (A) GO analysis for SPINK genes. (B) PPI network. The darker the color and the larger the graphic, the closer the connection with other proteins. (C) GGI network. GO: gene ontology; SPINK: serine protease inhibitor Kazal-type; PPI: protein-protein interaction; GGI: genetic-genetic interaction; BP: biological process; CC: cellular component; MF: molecular functionality
The protein level gene co-expression is illustrated using a PPI network via STRING (Figure 4B). SPINK7, 6, 4, and 14 exhibit stronger associations with other proteins. A GI network illustrating the interactions among the mRNA expressions of SPINKs is presented through GeneMANIA (Figure 4C). The top 10 most related genes include SPINK13, RECK, SPINK2, FST, FSTL3, FSTL4, SLCO1B3-SLCO1B7, MSANTD3-TMEFF1, SLCO4C1, and SLCO5A1.
Immune infiltration analysis
To further investigate the role of immune cells in HNSC, we conducted a separate analysis of the TCGA dataset. The analysis of immune cell correlations revealed that the HNSC and SPINK gene families had a significant negative correlation with NK cells and Th2 cells. In contrast, mast cells showed a positive correlation with neutrophils (see Figure 5 and 6).
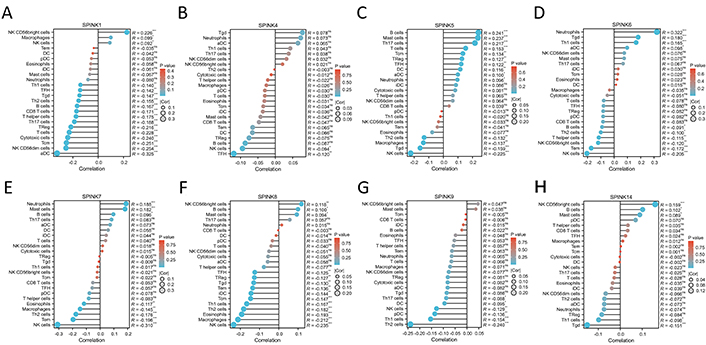
24 immune cells infiltrated. The X coordinate represents the correlation coefficient, and the Y coordinate represents the names of 24 immune cells. SPINK1 (A), SPINK4 (B), SPINK5 (C), SPINK6 (D), SPINK7 (E), SPINK8 (F), SPINK9 (G) and SPINK14 (H). The left side is negatively correlated, and the right side is positively correlated, the larger the spherical shape, the higher the correlation coefficient, and the darker the color, the greater the P-value. *: P < 0.05; **: P < 0.01; ***: P < 0.001; ns: not significant
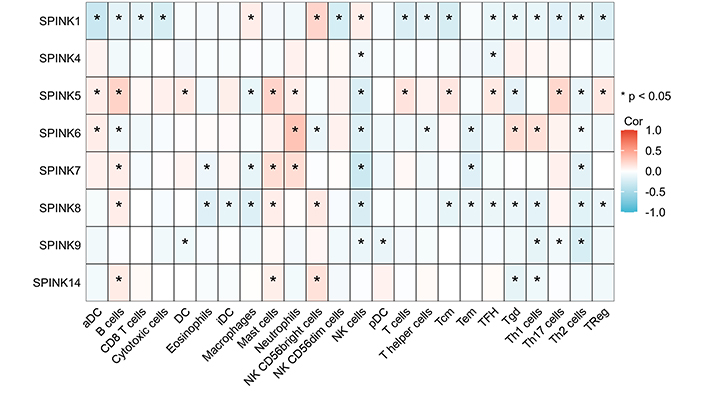
24 immune cells infiltrated. The relationship between the SPINK gene family is positively correlated in red and negatively correlated in blue. The darker the color, the stronger the correlation coefficient and the * represents statistical significance
Survival analysis, diagnostic analysis, and SPINK gene family in tumor stages I–IV
The prognostic significance of SPINK mRNA expressions was assessed using R v4.2.1. SPINK1, 5, and 6 mRNA expressions were significantly associated with OS in HNSC patients (P = 0.005, 0.006, and 0.003, respectively; Figure 7). In addition to these three genes, the mRNA expressions of the remaining SPINK genes did not show significant (P > 0.05) correlations with the OS in HNSC patients (Figure 7). The ROC curves showed SPINK1, 5, 7, and 8 mRNA expressions were closely related to the occurrence of HNSC (AUC = 0.793; AUC = 0.817; AUC = 0.728; AUC = 0.859; Figure 8). Notably, both SPINK1 and 5 served as simultaneous diagnostic and prognostic markers. A nomogram was created to predict the survival probability of patients with HNSC (Figure 9). The C-index for this model was 0.669. Although it did not meet the 0.7 threshold, we believe that the combined analysis of the SPINK gene family can contribute to the prognosis prediction for HMSC patients. The model incorporated the tumor stage, the SPINK gene family and the annual survival rate. In this study, stage I and II were classified as ‘early stage’, and stages III and IV were classified as ‘late stage’. The results showed that SPINK1, 4, 5, and 9 were associated with the tumor staging of HNSC (Figure 10).
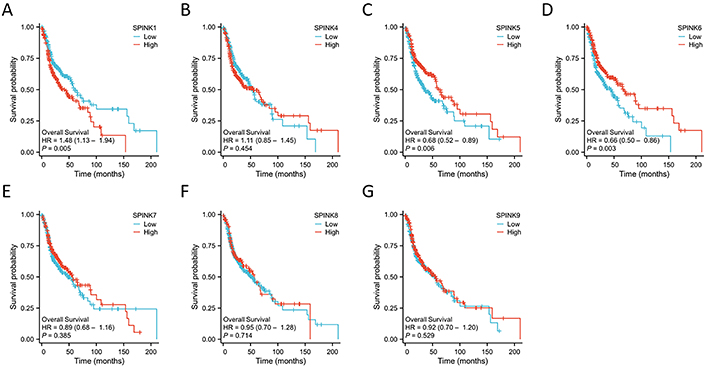
The Kaplan-Meier survival curves of SPINK genes for OS of HNSC patients. Survival curves for 528 HNSC patients according to SPINK1 (A), SPINK4 (B), SPINK5 (C), SPINK6 (D), SPINK7 (E), SPINK8 (F) and SPINK9 (G) expressions. SPINK: serine protease inhibitor Kazal-type; OS: overall survival; HNSC: head and neck squamous cell carcinoma
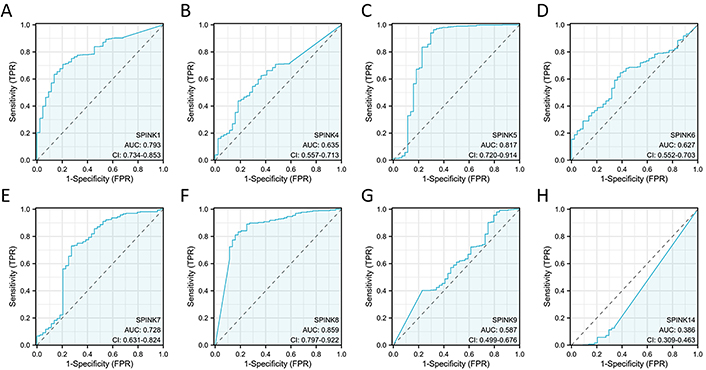
ROC curves for SPINK genes in HNSC. ROC curves for 528 HNSC patients according to SPINK1 (A), SPINK4 (B), SPINK5 (C), SPINK6 (D), SPINK7 (E), SPINK8 (F), SPINK9 (G) and SPINK14 (H) expressions. ROC: receiver operating characteristic; SPINK: serine protease inhibitor Kazal-type; HNSC: head and neck squamous cell carcinoma
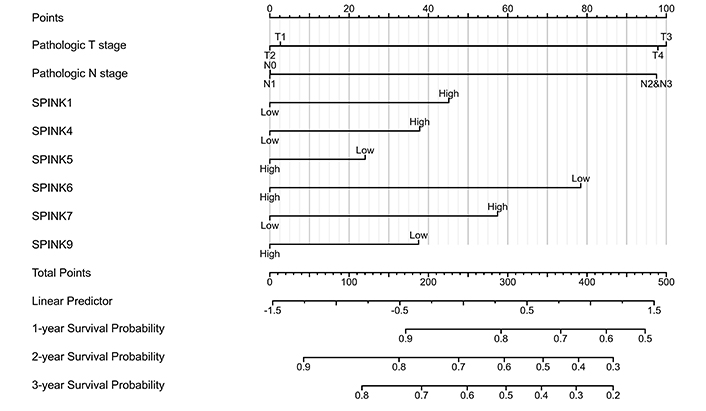
Nomogram for the relationship between medical data and risk score in HNSC patients. SPINK: serine protease inhibitor Kazal-type; HNSC: head and neck squamous cell carcinoma
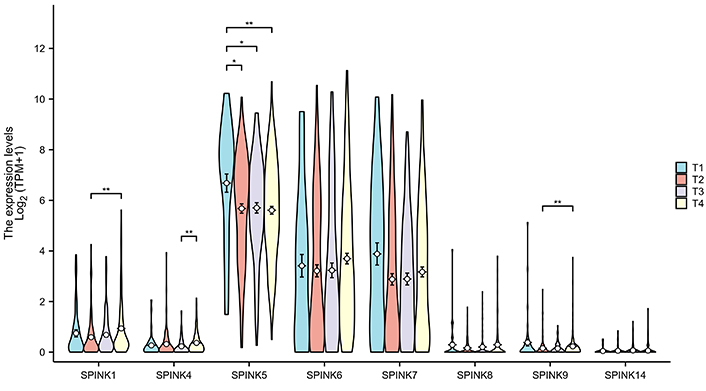
The expression of the SPINK gene family in different tumor stages. The four colors represent the T1–T4 stages of the tumor, and the groups with differences are marked with asterisks in the figure. SPINK: serine protease inhibitor Kazal-type; *: P < 0.05; **: P < 0.01
Discussion
This study evaluated the prognostic significance of the SPINK gene family using the TCGA database for HNSC. High expression levels of SPINK1, along with low levels of SPINK5, SPINK7, and SPINK8 were associated with improved OS in patients with HNSC. The mRNA expression levels of SPINK1, 4, 5, 6, 7, 8, 9, and 14 can help predict the development of HNSC. In addition, we performed GO functional analysis to explore the relationships between genes and proteins, aiming to predict the functions of the SPINK gene family.
SPINKs are a family of protein molecules. Protease inhibitors are crucial for regulating protein hydrolysis activity. Besides acting as antiproteases, they also possess significant anti-inflammatory, pro-inflammatory properties, and antibacterial properties [15]. The SPINK gene family is crucial in the development of various diseases, including certain types of cancer. Mature SPINK1 consists of 56 amino acids, also known as islet trypsin inhibitor (PSTI) or tumor-associated trypsin inhibitor (TATI). Recent studies indicate that SPINK1 promotes tumor cell growth in various cancers, including lung adenocarcinoma [16], colon [17, 18], pancreas [19], and ovarian cancer [20]. This indicates that SPINK1 may promote cancer through a mechanism different from its classical activity as a serine protease inhibitor. SPINK2 is mainly synthesized in testes and seminal vesicles. It plays a role in the reproductive process. The expression of SPINK2 was significantly increased in primary cutaneous large B-cell lymphoma, particularly in the germinal center of B-cell-like lymphoma and activated B-cell-like diffuse large B-cell lymphoma. This suggests a close association between SPINK2 and the pathogenesis of primary cutaneous large B-cell lymphoma [12]. There also is a study indicating the downregulation of SPINK2 in HNSC [21]. SPINK4 was originally isolated from pig intestines and was later found to be highly expressed in goblet cells in the recess of Lieberkühn in humans and pigs, as well as in monocytes and the central nervous system [22–24]. SPINK5 expression has been documented in the thymic and vaginal epithelium, Bartolin’s gland, oral mucosa, tonsil, and parathyroid gland [25]. The abnormal expression of SPINK5 is also related to the pathogenesis of certain tumors [26]. Studies indicate that in patients with oral squamous cell carcinoma and esophageal squamous cell carcinoma who have elevated SPINK5 expression have shorter survival times compared to those with low expression. SPINK5 may serve as an independent prognostic factor for tumor development [27, 28]. SPINK6 has a broad spectrum, not only in the skin to control kallikrein activity, but also in other tissues to control kallikrein activity [29]. Additionally, SPINK6 is a known prognostic factor for HNSC [30]. The SPINK7 gene, a tumor suppressor gene, regulates proteasome cascade during carcinogenesis and invasion of esophageal cancer through the urokinase-type plasmin activator/plasmin MAP kinase signaling pathway [31]. A recent study has shown that a large number of SPINK9 positive staining was observed in squamous cell carcinoma [32]. These results indicate that SPINK9 expression may be related to the progression of squamous cell carcinoma.
The analysis of the SPINK gene family in HNSC has provided significant insights into their roles in different BPs. Notably, the GO and KEGG enrichment analyses have shown that SPINK genes are predominantly involved in the negative regulation of peptidase activity, proteolysis, and hydrolase activity. These findings are consistent with existing literature that highlights the critical roles of peptidase inhibitors in cancer progression and immune regulation. For instance, the study by Huang et al. [33] demonstrates that the parathyroid hormone-like hormone (PTHLH)-activated network in hepatocellular carcinoma negatively regulates peptidase activity. The regulation is vital for inducing apoptosis and protein catabolism. This suggests that similar regulatory mechanisms might exist in HNSC, where SPINK genes may influence apoptosis and proteolysis by inhibiting peptidases activity.
Moreover, the regulation of peptidase activity in immune responses is well-established. For example, the study by Tanaka et al. [34] demonstrates that soluble CD26 enhances T-cell proliferation through its peptidase activity. This suggests that regulating peptidase activity significantly affects immune cell function. In the context of HNSC, our findings that SPINK genes are involved in immune cell infiltration further support the idea that these genes may influence tumor immunity by modulating peptidase activity.
The STRING analysis has identified key interactions between SPINK proteins and other regulatory molecules, such as BRCA1 and DKK1, both of which are involved in cancer-related pathways [35]. This complex network of interactions highlights the diverse roles of SPINK genes in cellular processes. These include cell cycle regulation, apoptosis, and immune responses. Furthermore, the role of SPINK genes in proteolytic processes is supported by research on α2-macroglobulins, which are broad-spectrum endopeptidase inhibitors involved in various biological functions, such as defending against external toxins and regulation of cytokines and growth factors [36]. This supports the idea that SPINK genes may act as critical modulators in the tumor microenvironment by regulating protease activity and influencing signaling pathways.
Our analysis of immune infiltration in HNSC revealed significant associations between SPINK gene family expression and different immune cell types, especially NK cells and Th2 cells. NK cells are essential components of the innate immune system and are known for targeting and destroying malignant cells without prior sensitization. Recent research has highlighted their role in tumor immunosurveillance and potential therapeutic applications in HNSC. For instance, a study created a prognostic model based on NK cell-related genes, demonstrating that NK cell infiltration is vital for positive patient outcomes and responsiveness to immunotherapy in HNSC [37]. Additionally, another study identified germline variants in NK cells that influence tumor immune microenvironment subtypes and patient prognosis, highlighting their significance in cancer immunity [38]. Our findings indicate that NK cells are significantly negatively correlated with SPINK gene family expression in HNSC. This inverse relationship suggests that increased SPINK gene expression could lead to an immunosuppressive tumor microenvironment. This may reduce NK cell activity and promote tumor progression. This finding is consistent with observations that the immune landscape of the tumor microenvironment, including NK cell recruitment, is critical for HNSC prognosis and therapeutic response [39]. Furthermore, the identified immune-related genes and pathways, such as NK cell-mediated cytotoxicity, are important factors in lipid metabolism-mediated tumor immunity in HNSC. This underscores the complex relationship between metabolic processes and immune regulation [40].
Th2 cells, a component of the adaptive immune system, promote humoral immunity and are often associated with anti-inflammatory responses. Our analysis showed a significant negative correlation between Th2 cells and SPINK gene expression, suggesting that higher SPINK levels may inhibit Th2 cell-mediated immune responses. This is consistent with findings from Tan et al. [41], who reported that specific transcription factors in HNSC are associated with immune cell infiltration, including NK and Th2 cells, and influence tumor progression and patient outcomes.
This study found that higher mRNA expression levels of SPINK1, SPINK5, and SPINK6 were related to favorable OS. We constructed a nomogram that indicated the SPINK gene family can participate in predicting scores. The contribution of tumor staging increased with the progress of the tumor, and the younger the patients tend to have higher scores. Compared with these risk-related factors, the importance of tumor staging significantly outweighs that of other effects. Using this model, we can predict the time-dependent survival rate. Patients with lower total scores had better 1-, 3-, and 5-year survival rates compared to those with higher total scores. Previous research has identified a few biomarkers for HNSC detection, including programmed cell death-ligand 1 and vascular endothelial growth factor [6]. In this study, the ROC curve analysis showed that the expression levels of SPINK1, 5, 7, and 8 can distinguish between adjacent normal tissues and HNSC tissues. Moreover, SPINK1, 4, 5, and 9 were linked to the tumor staging of HNSC. These findings may provide valuable insights for diagnosing tumor metastasis in clinical practice.
This study systematically explored the multifaceted roles of the SPINK gene family in head and HNSC. It examined expression levels, functional roles, PPI, immune infiltration, survival prognosis, and differential expression across tumor stages. The findings provide valuable insights into the potential mechanisms of the SPINK gene family in HNSC and highlight their significance in disease progression and prognosis. Future research, incorporating wet-lab validation and clinical studies, is essential to confirm these findings and clearly define the therapeutic and diagnostic potential of the SPINK gene family in HNSC.
Abbreviations
| BP: | biological process |
| CC: | cellular component |
| GI: | genetic interaction |
| GO: | gene ontology |
| HNSC: | head and neck squamous cell carcinoma |
| KEGG: | Kyoto encyclopedia of genes and genomes |
| MF: | molecular functionality |
| OS: | overall survival |
| PPI: | protein-protein interaction |
| ROC: | receiver operating characteristic |
| SPINK: | serine protease inhibitor Kazal-type |
Supplementary materials
The supplementary Table S1 for this article is available at: https://www.explorationpub.com/uploads/Article/file/1001265_sup_1.xlsx. The supplementary Table S2 for this article is available at: https://www.explorationpub.com/uploads/Article/file/1001265_sup_2.pdf.
Declarations
Author contributions
CM: Conceptualization, Writing—original draft, Writing—review & editing, Validation, Supervision. HL: Conceptualization, Investigation, Writing—original draft.
Conflicts of interest
The authors declare that they have no conflicts of interest.
Ethical approval
The data was obtained from the TCGA public database and has no privacy or ethical implications. Ethics approval is therefore not required.
Consent to participate
The data was obtained from the TCGA public database and has no privacy or ethical implications. Consent to participate is therefore not required.
Consent to publication
Not applicable.
Availability of data and materials
The raw data supporting the conclusions of this manuscript will be made available by the authors, without undue reservation, to any qualified researcher.
Funding
Not applicable.
Copyright
© The Author(s) 2024.