Abstract
Aim:
Isolated specific glycone–aglycone conjugated flavonoids which are investigated for their effect of bioavailability and molecular concentrations. The specific formula is then tested via in vitro and in vivo cytotoxicity tests.
Methods:
Considering the higher affinity for severe acute respiratory syndrome coronavirus 2 (SARS-CoV-2), quercetin, quercetin 3-sambubioside-3’-glucoside, luteolin, apigenin-7-4’alloside, kaempferol-7-O-glucoside, epicatechin-epigallocatechin-3-O-gallate, and hesperetin were selected to investigate the effects of a new combination of the formula. Specific chemical analyses, such as high-performance liquid chromatography (HPLC), liquid chromatography–mass spectrometry (LC–MS), quadrupole time of flight mass spectrometry (QTOF–MS) analysis and ultraviolet–visible (UV–VIS) spectrophotometry, were performed for molecular qualification and quantification.
Results:
In silico molecular docking analyses have shown that flavonoids can bind strongly to the spike protein and main protease of the SARS-CoV-2 virus. Flavonoids also have anti-inflammatory and immune-modulating activity by inhibiting cytokines. Although flavonoids may be a treatment alternative for coronavirus disease 2019 (COVID-19), an effective flavonoid compound has yet to be developed. The main problem here is that the absorption rate of flavonoids is very low (2–10%) in the intestines, and these compounds are metabolized rapidly. In contrast, according to recent literature, a conjugated flavonoid mixture is better absorbed in the small intestine, and its toxic effects are relatively fewer.
Conclusions:
It is found that the new formula has no cytotoxic or genotoxic effects. Furthermore, oral administrations of the new compound did not produce any toxicity symptoms or any mortality in male and female rats. The pre-clinical in vitro and in vivo toxicity test results indicated that the new flavonoid formula can be safely used for clinical trials.
Keywords
SARS-CoV-2, COVID-19, polyphenols, flavonoids, antiviral, immune-modulator, pre-clinical testsIntroduction
The World Health Organization (WHO) announced a pandemic caused by a new coronavirus in February 2020. The disease was named “COVID-19”, which is an acronym of “coronavirus disease 2019”, and this new virus type was termed severe acute respiratory syndrome coronavirus 2 (SARS-CoV-2).
According to the “June 2021 Status Report” published by WHO, there are nearly 180 million COVID-19 cases and almost 4 million confirmed deaths worldwide. In addition, the number of vaccinated people is more than 2.6 billion. On the other hand, billions of people who have not been vaccinated are still at risk as potential new cases.
To control the pandemic as early as possible, intensive scientific studies are being carried out all around the world for prevention, early diagnosis, treatment, and immunization (https://www.who.int/emergencies/diseases/novel-coronavirus-2019/global-research-on-novel-coronavirus-2019-ncov).
However, a specific antiviral agent directly effective against the SARS-CoV-2 virus has not been developed yet, and it is currently not possible to predict the long-term effectiveness and/or side effects of mRNA, synthetic recombinant, or attenuated vaccines [1].
In the current medical approach, supportive treatment protocols combined with antiviral agents are recommended in COVID-19 patients [2]. Preliminary studies reported that some antiviral agents, such as nucleoside analogues, neuraminidase inhibitors, remdesivir, umifenovir (arbidol), tenofovir disoproxil (TDF), and lamivudine (3TC) are potential treatments against SARS CoVs [3].
Liu et al. and Jin et al. [4, 5] have successfully crystallized the main protease chymotrypsin-like protease [3CLpro (also known as Mpro)-Protein Data Bank (PDB) ID: 6LU7] from CoV-2. Furthermore, Xu et al. [6] demonstrated the structure of the other Mpro named 3CLpro/Mpro (PDB ID: 2GTB) obtained from PDB (https://www.rcsb.org/) in pdb format. This research marked an important step in the development of specific treatment agents for SARS-CoV-2.
Polyphenols and bioflavonoids are an important molecular source in the development of antiviral drugs. There are many reports regarding the antiviral activity of different flavonoids against various viruses. Wu et al. [7] found that flavonoids inhibited influenza A virus (IAV) infection, including H1N1 and H3N2. According to their results, quercetin interacted with the influenza virus hemagglutinin (HA2) subunit, and this compound could be used in the early-stage treatment of influenza infection.
Zakaryan et al. [8] reviewed the evidence for the antiviral activity of different flavonoids and molecular mechanisms of action on viruses. The authors presented a perspective on therapeutic applications of flavonoids against viral infections. Jo et al. [9] showed that the antiviral activity of some flavonoids against CoVs is directly caused by inhibiting 3CLpro; they applied a flavonoid library to systematically probe inhibitory compounds and found that herbacetin, rhoifolin, and pectolinarin efficiently blocked the enzymatic activity of SARS-CoV 3CLpro.
Kaul et al. [10] found that natural flavonoids possess a variable spectrum of antiviral activity against specific RNA [respiratory syncytial virus (RSV), parainfluenza virus type 3 (Pf-3), polio] and DNA (herpes simplex virus-1) viruses acting to inhibit infectivity and/or replication. Flavonoids have also been shown in a number of studies to be a powerful antioxidant–anti-inflammatory–immune-modulatory agent that can remove hydroxyl radicals, superoxide anions, and lipid peroxyl radicals [11–13].
Despite these recent studies supporting the therapeutic effects of flavonoids for COVID-19, an effective formula that includes a flavonoid has not yet been developed, primarily because the bioavailability of pure aglycone flavonoids is very low when used orally; research shows that the oral bioavailability of flavonoids in humans is very poor after a single oral dose (~2–10%).
In addition to low bioavailability, flavonoids are metabolized in the liver extensively and excreted from the kidney rapidly. When the daily flavonoid dosage increased to compensate for low bioavailability, systemic toxic effects, particularly hepatotoxicity [14] and DNA damage were shown [15].
Considering these recent studies, we first selected specific flavonoid molecules based on in silico docking analysis. The main aim here was to find the optimum formulation to increase the bioavailability of flavonoids, reduce their toxicity, and develop a formulation to be used in the treatment of COVID-19.
Quercetin, quercetin 3-sambubioside-3’-glucoside, luteolin, apigenin-7-4’alloside, kaempferol-7-O-glucoside, epicatechin-epigallocatechin-3-O-gallate, and hesperetin were selected as target molecules. These purified glycone (attached glycosyl group) and aglycone (lacking an attached glycosyl) phenols were mixed in a standard protocol. Later, in vitro cytotoxicity and genotoxicity tests and in vivo acute/subacute toxicity experiments were carried out with this new formula.
Materials and methods
Molecular characterization and pharmaceutical formulation
Specific analytical methods were used for the qualification and quantification of target flavonoid molecules. High-performance liquid chromatography (HPLC) and mass spectrometry (MS) have become the most preferable methods in flavonoid identification and quantification.
Recent advances in quadrupole time of flight (QTOF) MS and liquid chromatography (LC)–MS methods have made the identification/qualification of flavonoids more common practice [16]. Single or multiple reference standards are used for quantification. After chromatographic separation, calibration with a reference was used to quantify the flavonoids.
The flavonoid phytochemicals (quercetin, quercetin 3-sambubioside-3’-glucoside, luteolin, apigenin-7-4’alloside, kaempferol-7-O-glucoside, epicatechin-epigallocatechin-3-O-gallate, and hesperetin) and analytical markers used in the study were obtained from local companies (Prolab Inc, Istanbul-Turkey and Metotlab Ankara-Turkey). Original chemical suppliers were Merck Co-Germany and Sigma Aldrich-Germany. The end product of the new compound was formulated and produced at Nanobiomed Health and Life Science Inc., Ankara-Turkey in accordance with Good Manufacturing Practices (GMP), Hazard Analysis Critical Control Point (HACCP), and ISO 9001–22000 standards.
In the present study, we used a reverse-phase chromatography technique in preparative process chromatography (equipment: Shimadzu C 190-E 184 series preparative HPLC) to determine the level of flavonoid molecule purification in the new formula. Other chromatographic techniques were also applied.
A C-18 separation column was used for reverse-phase chromatography. The mobile phases consisted of methanol and distilled water, with gradient elution applied. The flow rate was adjusted according to the column size, length, and dimensions. At the end of the reverse phase, a specific chromatogram was obtained, showing the ultraviolet (UV) peak intensities of the molecular structures.
The selected HPLC fraction was analyzed in detail to characterize and identify the quantized components. The confirmation and quantification of flavonoids were obtained by first mass scanning in LC–MS–MS [equipment: Agilent 6460 triple quadrupole system (ESI+Agilent Jet Stream)] and confirmation and identification of the selected masses with QTOF LC/MS with the use of reference flavonoid standards.
Other formula quantifications were measured using a UV–visible (UV–VIS) spectrophotometer based on the formation of flavonoid complexes with aluminium chloride (AlCl3). The flavonoid content in the formula was calculated as quercetin (mg/mL) using an equation based on a calibration curve.
In vitro test chemicals and reagents
L929 fibroblasts and Chinese hamster ovary cell (CHO cells) were obtained from the Şap Institute of the Ministry of Agriculture and Forestry-Turkey. Dulbecco’s Modified Eagle’s Medium (DMEM; Biological Industries-lot number: 2027500), fetal bovine serum (FBS; Biological Industries-lot number: 2004012), L-glutamine (Biological Industries), and penicillin/streptomycin (Biological Industries-lot number: 2008125) were used as the cell culture medium. The removal of cells from culture dishes was performed with trypsin-EDTA (trypsin-ethylenediamine tetra acetic acid) washed with phosphate-buffered saline (PBS). Counting of cells was carried out using trypan blue. Cell viability was determined by using the 3-(4,5-dimethylthiazol-2-yl)-2,5-diphenyltetrazolium bromide (MTT; Serva, Germany) chemical, a tetrazolium salt, in the cytotoxicity test. All cell culture studies were performed in culture dishes and multi-well plates (Corning, USA). Cell culture: frozen cells were thawed at 37°C. Cells dissolved in a sterile laminar flow cabinet were transferred to a 15 mL falcon tube, which was then centrifuged at 300 × g for 2 minutes. Three mL of DMEM medium (containing 10% FBS, 1% antibiotic) were placed in the falcon tube, and after being homogenized, it was plated in 75 cm2 flasks, which were left to incubate at 37°C in a 5% CO2 incubator.
Animals
The animal experiments were approved by the regional ethical committee for animal research (27.11.2020/514). The licensing ethical committee had approved the experiments, including any relevant details, before animal experiments. We confirm that all experiments were performed in accordance with relevant international guidelines and regulations, and we also complied with the Animal Research: Reporting of in vivo Experiments (ARRIVE) guidelines. All manipulations were made to minimize animal suffering and reduce the number of animals used.
Rats were obtained from the animal house of the Kobay Experimental Animals Inc, Turkey. Before beginning the experiments, male and non-pregnant female rats (240–300 g) were housed in a temperature and light-controlled room (24.0 ± 2°C; 12 h light/dark cycle) for 5 days to allow for acclimatization to the laboratory conditions.
In vitro toxicity tests
Cytotoxicity tests (MTT assay)
The MTT assay is used as a colorimetric test for assessing cell metabolic activity. In this study, 96-well plates were used for toxicity tests. After cell counting, the number of live cells was found to be 10 × 103 cells per well. In a 96-well plate, 100 μL of cells were placed in each well and left to incubate for 24 h. The cells were then checked regarding adherence to the well plate surface.
The medium in the wells was drained. Samples were diluted 7 times from the initial 100% concentration medium. Then, samples were placed in the plates, along with the positive (latex sheet) and negative (high-density polyethylene—HDPE) control group in 3 replicates. Cells were also treated with DMEM only and incubated for 24 h. At the end of the incubation, the medium in the well plates was drained. Fifty μL of MTT (1 mg/mL) solution was added to the wells.
After incubating at 37°C for 2–2.5 h, the MTT solution in the wells was emptied, and 100 μL of MTT solvent (isopropanol) was added. For the determination of cell viability, the absorbance density values of the 96-well plates were read at 570 nm in a microplate reader (Allshange).
Genotoxicity determination with micronucleus tests
A CHO cell line (as specified by ISO 10993-3, Organisation for Economic Co-operation and Development, OECD 487) and direct contact method were used as a test method. Samples were prepared by mixing in DMEM (serum and antibiotic-containing) medium at a ratio of 1:1. Mitomycin-C (Mit-C) was used as the positive control, and the medium itself was used as the negative control.
In the experimental protocol, 15 × 103 cells were seeded in 48-well plates. Cells were left to incubate (37°C, 5% CO2) for 24 h. After the incubation period, the extracted sample (100 µL) was applied in 4 repetitions by removing the media in the wells. The positive control (Mit-C) was also administered at 0.3 µg/mL. Then, 15 × 103 cells were seeded in 48-well plates. Only cells with medium were used as the negative control group and Mit-C as the positive control. Cytochalasin-B (Cyt-B), which stops cell division at the cytokinesis stage, was added to obtain binucleated cells at the 44th h of incubation by selecting appropriate doses from the extracted samples and applying them to the cells. The results were evaluated over 24 h of incubation.
In vivo oral toxicity tests
Orally taken polyphenols are absorbed from the small intestine and then metabolized in the liver and excreted from the kidneys. Polyphenols are also converted in the small intestine and liver to methylated, sulfate, and glucuronide metabolites by biotransformation enzymes.
Acute oral toxicity—lethal dose 50 studies
In vivo experiments were carried out in Kobay Experimental Animals Laboratory Inc., Ankara, Turkey, in accordance with Good Laboratory Practice (GLP) standards. Twenty adult Wistar rats (10 females and 10 males) aged 8–12 weeks and weighing 240–300 g were used in the acute oral toxicity tests. During the experiments, rats were housed under a controlled temperature (23–25°C), with a constant 12 h light–dark cycle and free access to food and water. The test procedure was applied to 2 female and 2 male rats in the first experimental group for 14 days in accordance with the OECD 423 guideline. The weights of the animals were noted before the first-day application. Then, 1 mL of the new formulation was administered orally to rats once a day for 3 days. At the end of the 3rd day, 4 animals (2 males and 2 females) were added to the same group, and the formula was given orally for 3 days at 1 mL twice a day.
At the end of the 6th day, 4 more animals (2 males and 2 females) were added to the same group, and the formulation was given orally for 3 days with 3 × 1 mL doses per day. At the end of the 9th day, 4 more animals (2 males and 2 females) were added to the same group and given orally 2 mL of the new formulation 3 times a day, for 5 days. A total of 20 rats (10 males and 10 females) were used, including 4 rats (2 males and 2 females) as the control group. The weights of the animals were measured on days 0, 7, and 14 from the first day. The effects of the new formulation on body-weight change and organ weight, food, and water consumption on rats were analyzed.
Subacute (repeated dose) oral toxicity (28 days)
A total of 32 Wistar rats (16 females and 16 males), aged 8–12 weeks, and weighing 250–300 g, were used for the study. They were housed under a controlled temperature (23–25°C), with a constant 12-h light–dark cycle and free access to food and water. The test protocol was applied in accordance with the OECD 408 standard (28-day oral toxicity study). The doses of the new formulation administered to rats were adjusted according to OECD-Guideline 408.
Experimental group 1: 10 animals (5 males, 5 females), oral administration 1 × 1 mL per day.
Experimental group 2: 10 animals (5 males, 5 females), 2 × 1 mL per day oral administration.
Experimental group 3: 10 animals (5 males, 5 females), 3 × 2 mL oral administration per day.
The weights of the animals were recorded at 7-day intervals from the beginning of the experiment. While the experiments were continuing, the body-weight change, food and water consumption, blood biochemistry values, and hemogram results were analyzed. After the experiments were completed, the 29th-day rats were decerebrated under suitable conditions, and organ weights were determined by performing organ dissections. In addition, histopathological evaluations with hematoxylin–eosin (HE) stain were made by taking sections from samples from different organs (liver, kidney, spleen, lung, testicle, ovary, colon, small intestine, brain, heart, muscle, uterus, stomach, bladder).
Statistical analysis
Collected data are shown as mean ± standard deviation (SD) and median (min–max). Micronuclei formed as a result of test substance incubation, applied to CHO cells, and micronuclei in the control group were compared using a Mann Whitney U test.
A Kruskal-Wallis analysis of the variance test was used in the Statistical to analyze the significance of statistical differences within research groups and between groups. P < 0.05 was considered statistically significant.
Results
Molecular characterization of new formula
Orally taken polyphenols are absorbed in different ways according to their basic chemical structure (aglycone–glycone). It is known that conjugated glycoside polyphenols are better absorbed in the gastrointestinal system. Hence, while designing the new formula, aglycone–glycone flavonoid structures were selected to improve bioavailability.
Phytochemical bioflavonoids used in the new compound are shown in Table 1. Five different glycone/aglycone flavonoids were used for preparing the new formula.
Name, structural formula, and IUPAC name of the main flavonoids in the new antiviral, anti-inflammatory compound
| Name | 2D structure | IUPAC name |
|---|---|---|
| Quercetin | 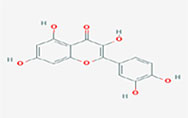 | 2-(3,4-dihydroxyphenyl)-3,5,7-trihydroxychromen-4-one |
| Quercetin 3-sambubioside-3’-glucoside | 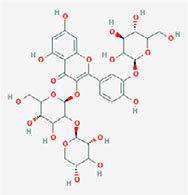 | 3-[(2S,5S)-4,5-dihydroxy-6-(hydroxymethyl)-3-[(2S,3R,5R)-3,4,5-trihydroxyoxan-2-yl]oxyoxan-2-yl]oxy-5,7-dihydroxy-2-[4-hydroxy-3-[(2S,4S,5S)-3,4,5-trihydroxy-6-(hydroxymethyl)oxan-2-yl]oxyphenyl]chromen-4-one |
| Luteolin | 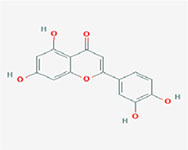 | 2-(3,4-dihydroxyphenyl)-5,7-dihydroxychromen-4-one |
| Apigenin-7-4’-dialloside | 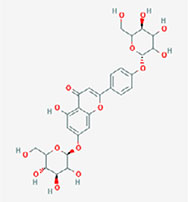 | 5-hydroxy-7-[(2S,4S,5S)-3,4,5-trihydroxy-6-(hydroxymethyl)oxan-2-yl]oxy-2-[4-[(2S,5S)-3,4,5-trihydroxy-6-(hydroxymethyl)oxan-2-yl]oxyphenyl]chromen-4-one |
| Kaempferol-7-O-glucoside | 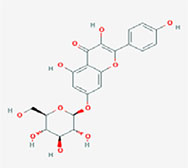 | 3,5-dihydroxy-2-(4-hydroxyphenyl)-7-[(2S,3R,4S,5S,6R)-3,4,5-trihydroxy-6-(hydroxymethyl)oxan-2-yl]oxychromen-4-one |
| Epicatechin-epigallocatechin-3-O-gallate | 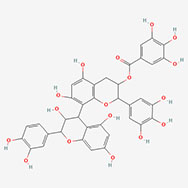 | [8-[2-(3,4-dihydroxyphenyl)-3,5,7-trihydroxy-3,4-dihydro-2H-chromen-4-yl]-5,7-dihydroxy-2-(3,4,5-trihydroxyphenyl)-3,4-dihydro-2H-chromen-3-yl] 3,4,5-trihydroxybenzoate |
| Hesperetin | 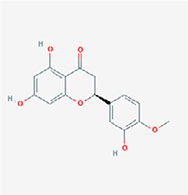 | (2S)-5,7-dihydroxy-2-(3-hydroxy-4-methoxyphenyl)-2,3-dihydrochromen-4-one |
Note. 2D structure image of Quercetin is reprinted from https://pubchem.ncbi.nlm.nih.gov/compound/5280343#section=2D-Structure; 2D structure image of Quercetin 3-sambubioside-3’-glucoside is reprinted from https://pubchem.ncbi.nlm.nih.gov/compound/44259178#section=2D-Structure; 2D structure image of Luteolin is reprinted from https://pubchem.ncbi.nlm.nih.gov/compound/5280445#section=2D-Structure; 2D structure image of Apigenin-7-4’-dialloside is reprinted from https://pubchem.ncbi.nlm.nih.gov/compound/44257816#section=2D-Structure; 2D structure image of Kaempferol-7-O-glucoside is reprinted from https://pubchem.ncbi.nlm.nih.gov/compound/5480982#section=2D-Structure; 2D structure image of Epicatechin-epigallocatechin-3-O-gallate is reprinted from https://pubchem.ncbi.nlm.nih.gov/compound/169144#section=2D-Structure; 2D structure image of Hesperetin is reprinted from https://pubchem.ncbi.nlm.nih.gov/compound/72281#section=2D-Structure
The chemical characterization of the isolated and purified bioflavonoids are shown via QTOF analyses in Table 2.
QTOF–MS retention time, mass, and empirical formula of the flavonoids in the new compound
| Name | Retention time (RT) | Mass | Empirical molecular formula |
|---|---|---|---|
| Quercetin 3-sambubioside-3’-glucoside | 0.943 | 757.1827 | C32H38O21 |
| Apigenin-7-4’alloside | 1.555 | 636.1671 | C29H32O16 |
| Epicatechin-epigallocatechin-3-O-gallate | 1.882 | 746.1441 | C37H30O17 |
| Kaempferol 7-O-glucoside | 4.574 | 448.1008 | C21H20O11 |
| Hesperetin | 12.212 | 302.0799 | C16H14O6 |
| Luteolin | 14.375 | 286.0476 | C15H10O6 |
| Quercetin | 15.264 | 302.0426 | C15H10O7 |
Qualitative identification reports and QTOF–MS spectrum for quercetin, quercetin 3-sambubioside-3’-glucoside, luteolin, apigenin-7-4’alloside, kaempferol 7-O-glucoside, epicatechin-epigallocatechin-3-O-gallate, hesperetin is measured (Figure 1).
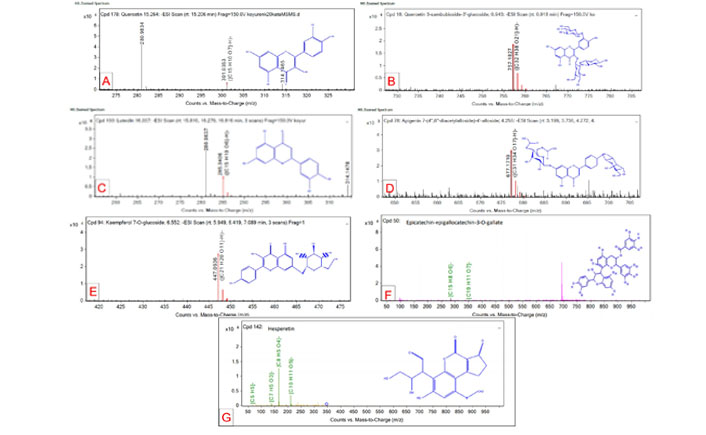
Qualitative identification reports and QTOF–MS spectrum for targeted flavonoids. (A) Quercetin; (B) quercetin 3-sambubioside-3’-glucoside; (C) luteolin; (D) apigenin-7-4’alloside; (E) kaempferol 7-O-glucoside; (F) epicatechin-epigallocatechin-3-O-gallate; (G) hesperetin
Total phenolic and flavonoid content determination
Total phenolic content in the formula was measured by the modified Folin-Ciocalteu method [17]. For the calibration curve, 100 mg of gallic acid was dissolved in 100 mL of distilled water using an ultrasonic bath (stock solution). One hundred µL (1/10 diluted) of the new formula was mixed with 0.5 mL of Folin-Ciocalteu reagent, and then 1.5 mL of sodium carbonate (7.5%) was added. Tubes stayed at room temperature for 2 h to develop their specific color. Absorbances were then measured at 765 nm using a PG instruments (T80+ model) UV–VIS spectrophotometer, and the analysis was repeated 3 times for the sample (Figure 1). The total phenolic content of the new formula was found to be 2.5 ± 0.1 mg/5 mL as gallic acid equivalent (GAE), and the correlation coefficient was R2 = 0.9999 (Figure 2).
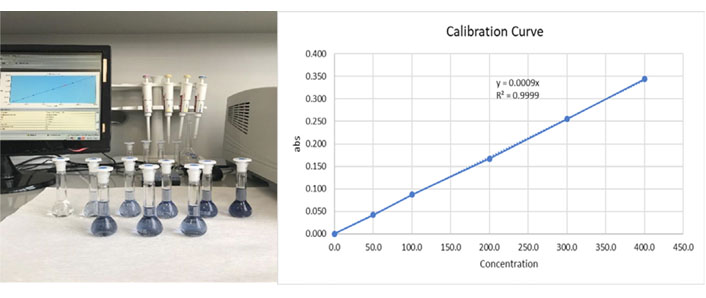
Total phenolic determination of the three blue volumetric flasks on the front line are the replicate samples, and the six volumetric flasks on the back line are the GAGE calibration standards (0, 100, 200, 300, 400, 500 mg/L). Estimated correlation coefficient R2 = 0.9999 is a statistical measure of how close the data are to the fitted regression line
The total flavonoid content was measured using a spectrophotometric method [18]. A volume of 0.5 mL of 2% AlCl3 ethanol solution was added to 0.5 mL of the new formula. After one h at room temperature, the absorbance was measured at 420 nm. The yellow color intensity of the quercetin calibration standards indicated an increased amount of quercetin. Because of molecular co-pigmentation and glycosylation, the original color of the new formula is dark purple. The total flavonoid content of the compound was found to be 0.45 ± 0.04 mg/5 mL as quercetin equivalent (QE) and the correlation coefficient was R2 = 0.9997 (Figure 3).
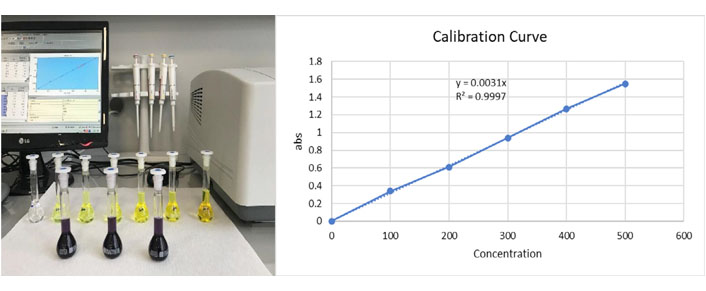
Total flavonoid determination three dark purple volumetric flasks on the front line are the replicate samples, and the six yellow volumetric flasks on the back line are the quercetin calibration standards (0, 100, 200, 300, 400, 500, 1000 mg/L). Estimated correlation coefficient R2 = 09997
In vitro cytotoxicity tests
The decrease in the number of viable cells results reflects the lower metabolic activity of the sample. This reduction is directly related to the height of the peak formed in a blue-purple color, read as the optical density at 570 nm. The quantitative evaluations below were made in accordance with TS EN ISO 10993-5/MTT cytotoxicity test standards.
The L929 fibroblast cell viability on the highest concentration was calculated as 74% according to the MTT test results; hence, the new formulation had no toxic effect. The % vitality is shown in Table 3a. In the qualitative evaluation made in the same way, as shown in Table 3b, it was found that the new formula had no toxic effects. The t test was used to determine the significant difference between the test sample and control groups. Differences were considered significant for P < 0.05. The IC50 value was also determined to be 247.6 µL.
Quantitative MTT test results of new formulation (L929 fibroblast cells)
| Test material | Average optical density (OD) | Viability (%) | |
|---|---|---|---|
| Negative control | 0.609 | 100 | |
| Positive control | 0.160 ± 2.1 | 26.291 | |
| Sample (1: 1) | 0.456 ± 2.5 | 74.774 | |
| Sample (1: 2) | 0.506 ± 10.9 | 82.973 | |
| Sample (1: 4) | 0.494 ± 8.1 | 81.071 | |
| Sample (1: 8) | 0.516 ± 16.2 | 84.722 | |
| Sample (1: 16) | 0.538 ± 6.2 | 88.286 | |
| Sample (1: 32) | 0.558 ± 17.9 | 91.582 | |
| Sample (1: 64) | 0.574 ± 16.8 | 94.178 | |
Quantitative MTT test results of new formulation (L929 fibroblast cells)
| Test material | Degree | Reaction | Situations of cultures |
|---|---|---|---|
| Negative control | 0 | Ø | Discrete intra-cytoplasmic granules, no cell destruction, no reduction in cell proliferation |
| Positive control | 4 | Strong | All or almost all of the cell layers were destroyed |
| Sample (1: 1) | 0 | Ø | Discrete intra-cytoplasmic granules, no cell destruction, no reduction in cell proliferation |
| Sample (1: 2) | 0 | Ø | Discrete intra-cytoplasmic granules, no cell destruction, no reduction in cell proliferation |
| Sample (1: 4) | 0 | Ø | Discrete intra-cytoplasmic granules, no cell destruction, no reduction in cell proliferation |
| Sample (1: 8) | 0 | Ø | Discrete intra-cytoplasmic granules, no cell destruction, no reduction in cell proliferation |
| Sample (1: 16) | 0 | Ø | Discrete intra-cytoplasmic granules, no cell destruction, no reduction in cell proliferation |
| Sample (1: 32) | 0 | Ø | Discrete intra-cytoplasmic granules, no cell destruction, no reduction in cell proliferation |
| Sample (1: 64) | 0 | Ø | Discrete intra-cytoplasmic granules, no cell destruction, no reduction in cell proliferation |
Ø stands for no reaction seen, 0 stands for the reaction is not detectable and degradable
In vitro genotoxicity determination with micronucleus tests
After 24 h of application, the media in the 48-well plate was discarded, and 75 mmol/L potassium chloride (KCI) was dropped into the wells. Then, the cells were fixed by adding methanol: glacial acetic acid (3:1). Finally, the cells were stained with Giemsa [in the presence of Cytochrome b (Cyto B)], and cells with binucleated and micronuclei were counted. Depending on the cell number, cytokinesis-block proliferation index (CBPI) and % cytostasis rate were calculated as specified in the standard.
An exposure-related increase in micronuclei or binucleated cells is a biomarker of the genotoxic effects of the test agent. Test group levels similar to the negative control group suggest aneugenic mechanisms appearing in cell division rather than DNA damage. These test results did not indicate the presence of dose-dependent apoptosis because a large number of micronucleus-like nuclear bodies must arise as a result of the fragmentation that is characteristic of apoptosis (Table 4).
Micronucleus, CBPI value, cytostasis rates in cells, after 24 h
| Concentration | Micronucleus range (%) | CBPI value | Cytostasis (%) |
|---|---|---|---|
| 100 µg/mL | 2.4 | 1.504 | 21.40 |
| Negative control | 1.1 | 1.901 | - |
| Positive control | 1.7 | 1.312 | 51.33 |
Statistically, comparing the test substance vs. negative control groups, there was no difference in terms of micronuclei cells at the 95% confidence interval (P > 0.05).
Groups of CHO cells exposed to the test substance exhibited CBPI and replication index (RI) values similar to their negative controls and within acceptable ranges. The RI is the exposure time in a treated culture versus the untreated control and the rate of a complete cell division cycle at recovery; there was no evidence that the test substance was toxic to CHO cells (Figure 4).
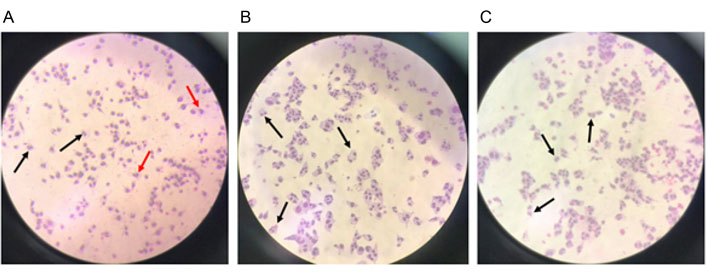
(A) Binucleated (black arrow) and micronuclei (red arrow) cells with a concentration of 0.3 µg/mL Mit-C in the positive control group in CHO cells; (B) binucleated cells in the negative control; (C) binucleated cells with a concentration of test substance of 100 µg/mL (200× magnification)
In vivo acute oral toxicity—LD50 studies
Acute and repeated dose acute oral toxicity experiments were performed according to OECD 423 (Annex 2c) and 408 guidelines.
The maximum oral volume that can be given to rats is 6 mL/100 g (for an average of 300 g rats, max: 2 × 300/100 = 6 mL) according to the OECD 423 guideline. Furthermore, the maximum active ingredient dose that can be administered orally to rats is 2000 mg/kg (max: 0.3 × 2000 = 600 mg for an average of 300 g rats) as per the OECD 423 guideline.
We determined that approximately 0.8–1 mg of flavonoids was present in 1 mL of the new formulation, and the total daily amount of polyphenols given to rats in the maximum volume was 6 mg. According to these calculations, even if providing the formulation in the maximum volume, it would not be possible to reach toxic doses.
The results of the in vivo experiments support this statement. The data showed that after oral administration of the new compound as 1 × 1 mL, 2 × 1 mL, 3 × 1 mL, and 3 × 2 mL to rats of both sexes, no death was recorded during the entire experimental period.
There were also no abnormal observations in body weight. Under the experimental conditions, the results indicated that the median lethal dose (LD50) of the new formula is much higher than 6 mg/day of body weight. Under these conditions, it was not possible to measure the LD50 level in the limits of the OECD 423 guideline.
The mean body weights of the female and male rats are shown in Figures 5 and 6. There were no significant differences in body weights between the treatment and control groups throughout the experimental period (Day 0: first dosing day).
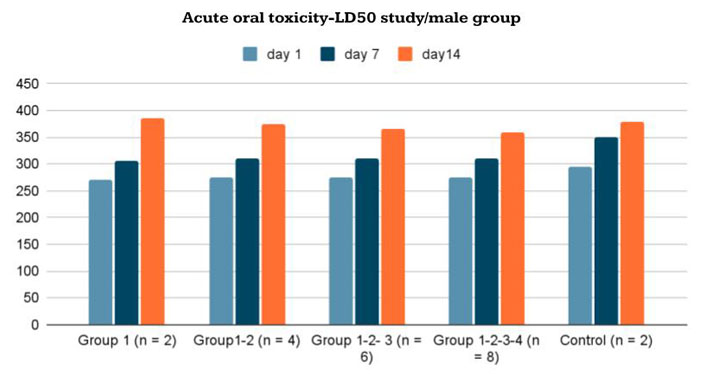
Body-weight changes in male Wistar rats given the new formulation compared to control group in acute oral toxicity—LD50 study/male group
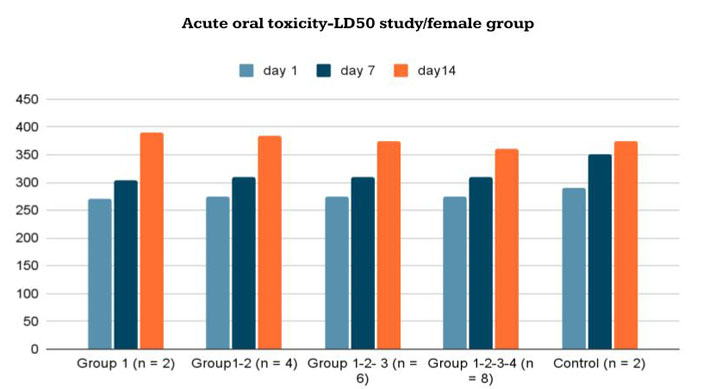
Body-weight changes in female Wistar rats given the new formulation compared to control group in acute oral toxicity—LD50 study/female group
In vivo subacute (repeated dose) oral toxicity (28 days)
The subacute (repeated dose) oral toxicity study in 15 female and 15 male rats was performed for 28 days. None of the new formula-treated animals died or exhibited abnormal weight changes at any of the tested doses. The body-weight variations of the female and male rats are shown in Tables 5 and 6.
Changes in body weight and liver weight for control and treated Wistar female rats in the repeated dose subacute oral toxicity study (28 days)
| Experimental groups | Body weight (g) | Liver (g) | ||||
|---|---|---|---|---|---|---|
| Day 0 | Day 7 | Day 14 | Day 21 | Day 28 | ||
| Group 1 (1 × 1 mL), n = 5 | 243.2 | 265.1 | 276.5 | 292.6 | 315.2 | 12.76 |
| 257 | 272.3 | 294 | 313.7 | 335.3 | 13.77 | |
| 263.8 | 287.6 | 318.6 | 324.3 | 338 | 12.58 | |
| 268.5 | 279.4 | 299.2 | 314.9 | 336.9 | 14.62 | |
| 262.6 | 261 | 274.4 | 289.2 | 308.6 | 10.32 | |
| Group 2 (2 × 1 mL), n = 5 | 253.8 | 265.7 | 289 | 312.5 | 352 | 11.36 |
| 267.9 | 282.3 | 296.4 | 313.8 | 354 | 13.89 | |
| 258 | 280 | 301.6 | 331.7 | 366.8 | 10.88 | |
| 269 | 280.4 | 302.2 | 324.9 | 353.1 | 15.32 | |
| 255.6 | 273.1 | 294.4 | 329.24 | 340.2 | 13.5 | |
| Group 3 (3 × 2 mL), n = 5 | 235.9 | 255.8 | 277.3 | 298.5 | 325.4 | 9.89 |
| 239.7 | 257.6 | 272.3 | 294 | 330.1 | 12.36 | |
| 263.8 | 289.6 | 311.6 | 331.5 | 357 | 11.68 | |
| 265.9 | 279.8 | 294.2 | 314.9 | 351 | 13.65 | |
| 250.6 | 261.1 | 277.4 | 299.4 | 332.5 | 10.81 | |
| Control | 253.1 | 283.6 | 308.6 | 326.9 | 348.9 | 12.54 |
Changes in body weight and liver weight for control and treated Wistar male rats in the repeated dose subacute oral toxicity study (28 days)
| Experimental groups | Body weight (g) | Liver (g) | ||||
|---|---|---|---|---|---|---|
| Day 0 | Day 7 | Day 14 | Day 21 | Day 28 | ||
| Group 1 (1 × 1 mL), n = 5 | 256.9 | 316 | 335.8 | 357 | 385.6 | 16.79 |
| 268.2 | 297.6 | 320.1 | 352.9 | 380.4 | 20.02 | |
| 281.3 | 316.4 | 349.3 | 364 | 377.5 | 16.43 | |
| 265.6 | 298.1 | 324.1 | 338 | 365.9 | 17.05 | |
| 293.1 | 320.5 | 355.6 | 382.1 | 399.8 | 15.27 | |
| Group 2 (2 × 1 mL), n = 5 | 278.5 | 296.4 | 316 | 345.6 | 380.6 | 16.2 |
| 265.3 | 297.6 | 320.1 | 350.3 | 376.2 | 13.65 | |
| 281 | 290.4 | 306.9 | 320.4 | 337.1 | 9.96 | |
| 267.6 | 278.1 | 289 | 298 | 334.6 | 9.87 | |
| 293.1 | 320.5 | 356 | 375.2 | 389.5 | 14.8 | |
| Group 3 (3 × 2 mL), n = 5 | 255 | 271.3 | 289.5 | 301.5 | 299.6 | 7.57 |
| 257.2 | 281.3 | 298.6 | 330 | 365.7 | 14.35 | |
| 288.3 | 320.4 | 362.9 | 386.4 | 402.3 | 18.36 | |
| 265.2 | 298.5 | 332.5 | 360 | 386.4 | 17.35 | |
| 290.1 | 317.5 | 351.6 | 375.1 | 402 | 17.33 | |
| Control | 277.5 | 301.6 | 355.6 | 396.9 | 425 | 19.87 |
The body weights of male and female rats increased during the test period. However, there was no statistically significant difference between the experimental and control groups in female rats on the 0th (P = 0.452), 7th (P = 0.434), 14th (P = 0.434), 21st (P = 0.251), and 28th (P = 0.162) days in terms of body weight. In addition, there was no statistically significant difference between the experimental and control groups in terms of liver weight in female subjects (P = 0.389).
Furthermore, there were no statistically significant differences between the experimental and control groups in male rats [days 0 (P = 0.841), 7 (P = 0.587), 14 (P = 0.466), 21 (P = 0.257), and 28 (P = 0.319) in terms of body weight], and no statistically significant difference in liver weight change was noted between the experimental and control groups in male rats (P = 0.100).
Histopathological assessment of tissue samples
Fourteen different organs taken from 30 rats (from the subacute oral toxicity test groups) were assessed for histopathological evaluations. Slides were prepared by cutting paraffin-embedded tissues with a microtome using the appropriate technique.
After deparaffinization, tissue samples were stained with HE using a progressive staining method. The tissue samples shown in Figure 7 were taken from experimental group 3 administered with an oral formulation of a 3 × 2 mL dosage. In the general macroscopic and microscopic evaluation, no significant histopathological changes were detected in the tissues (Figure 8).
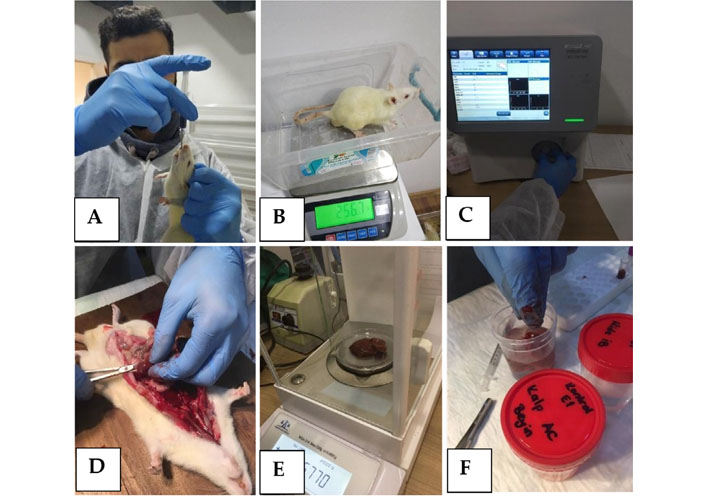
(A) Oral administration of the new compound; (B) daily body-weight control; (C) hemogram control; (D) organ dissection; (E) organ weight control; (F) tissue sample preparation for histopathological assessment
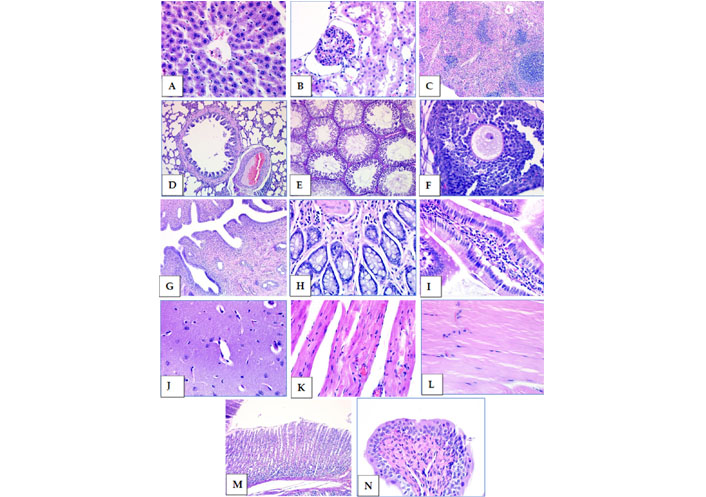
Subacute oral toxicity test group 3 tissue samples stained with HE. (A) Liver; (B) kidney; (C) spleen; (D) lung; (E) testicle; (F) ovary; (G) uterus; (H) colon; (I) small intestine; (J) brain; (K) heart; (L) muscle; (M) stomach; (N) bladder (40× magnification)
Discussion
Flavonoids are a large group of polyphenolic substances. The structural components of these molecules are two benzene rings on both sides of the 3-carbon ring. The combination of more than one hydroxyl group, sugar, oxygen, and methyl group attached to these structures creates several flavonoids, such as anthocyanins, flavanols, flavanones, flavones, flavan-3-ols, and isoflavones (Figure 9).
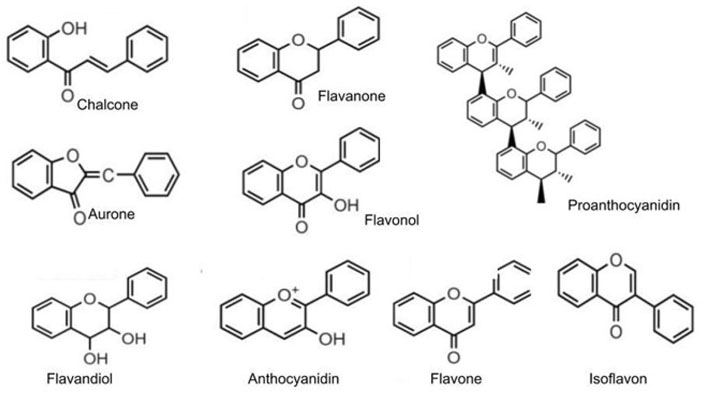
Structure of the main classes of polyphenol and flavonoids
Note. Reprinted from “Flavonoids: biosynthesis, biological functions, and biotechnological applications,” by Falcone Ferreyra ML, Rius SP, Casati P. Front Plant Sci. 2012;3:222 (http://dx.doi.org/10.3389/fpls.2012.00222). CC.
Flavonoids are associated with a broad spectrum of nutraceutical, pharmaceutical, medicinal, and cosmetic applications. They have therapeutic effects associated with various diseases, such as cancer, Alzheimer’s disease (AD), atherosclerosis, acute viral respiratory illness, and acute-chronic inflammation because of their anti-oxidative, anti-inflammatory, anti-mutagenic, and anti-carcinogenic properties coupled with their capacity to modulate key cellular enzyme functions. They are also known to be potent inhibitors of several enzymes, such as xanthine oxidase (XO), cyclo-oxygenase (COX), lipoxygenase, and phosphoinositide 3-kinase [19].
Flavonoids comprise more than 50% of all polyphenols and are divided into simple and complex flavonoids, as summarized in Table 7 [20].
Flavonoid subclasses and sources [20]
| Flavonoids | Sample polyphenols | Sources | |
|---|---|---|---|
| Simple flavonoids | Flavan-3-ols | (+)-catechins, (−)-epicatechin, (−)-epigallocatechin-3-gallate | Green tea, chocolate, tree fruits, grapes, red wine |
| Flavanones | Hesperetinnaringenin, eriodictyol | Citrus fruits and juices | |
| Flavones | Luteolin, apigenin | Parsley, celery seed, oregano | |
| Isoflavones | Daidzein, genistein, glycitein | Soybeans, soy-based foods | |
| Flavonols | Quercetin, kaempferol, myricetin, isorhamnetin | Onions, apples, tea, berries | |
| Anthocyanidins | Cyanidin, delphinidin, malvidin, pelargonidin, peonidin, petunidin | Most berries, stone fruits | |
| Complex flavonoids | Condensed tannins (proanthocyanidins) | Procyanidins, prodelphinidins, propelargonidin | Chocolate, stone fruit (apples, pears), grapes, strawberries, cranberries, nut skins, cinnamon, beer, wine |
Many studies have found a strong association between high dietary polyphenol intake and a reduced risk of chronic health conditions.
Polyphenols have also antiviral activity against a diverse group of viruses such as corona virus, influenza A virus (H1N1), herpes simplex virus 1 (HSV-1), human immunodeficiency virus (HIV), hepatitis B and C viruses (HBV/HCV), and Epstein-Barr virus (EBV) [21].
Polyphenol-flavonoid molecules can be used as a particularly important treatment alternative for COVID-19 patients because of their antiviral, anti-inflammatory, and anticoagulant properties. Therapeutic chemicals against coronavirus can be divided into two groups: compounds targeting the virus and acting on the immune system. The key SARS-CoV-2 targets of these drugs comprise three non-structural proteins [3CLpro, papain-like proteases (PLpro) and RNA-dependent RNA polymerase (RdRp)] and a structural protein (S protein), which are responsible for replication, transcription and host cell recognition [22]. However, vaccines and monoclonal antibodies may lose their efficiency if the virus mutates (as delta and delta plus variants) and changes its antigenicity.
According to Paraiso et al. [23], polyphenols might reduce COVID-19 infection by binding to the angiotensin-converting enzyme 2 (ACE2) receptor, preventing the viral entry, and modulating the severity of lung injury associated with COVID-19 by regulating ACE2 expression (Figure 10).
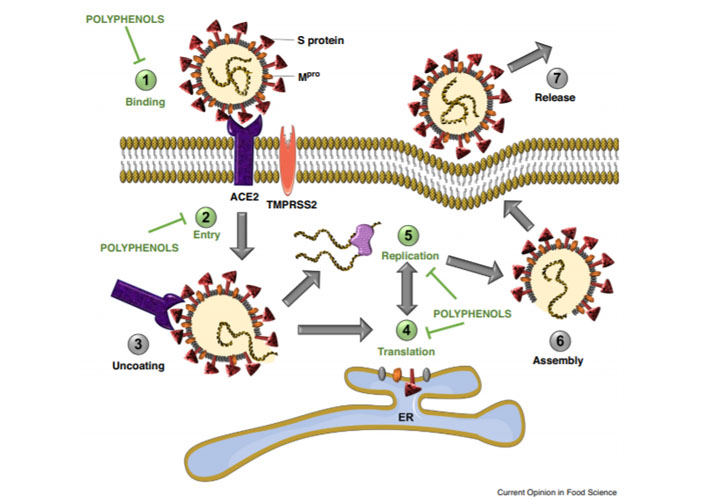
Polyphenols have the potential to inhibit binding of SARS-CoV-2 spike protein to host cell receptor ACE2, (1) prevent viral entry into the host cell, (2) and inhibit viral RNA replication and protein processing (4–5)
Note. Reprinted from “Potential use of polyphenols in the battle against COVID-19,” by Paraiso IL, Revel JS, Stevens JF. Curr Opin Food Sci. 2020;32:149–55 (https://doi.org/10.1016/j.cofs.2020.08.004). CC BY NC ND.
Replication of coronaviruses requires correct proteolytic processing of the replicase polyproteins by viral proteases leading to the release of non-structural and structural proteins. SARS-CoV-2 polyproteins are processed by 3CLpro and by PLpro [24]. These proteases are involved in the replication and transcription of the SARS-CoV-2. Especially, 3CLpro plays a vital role in polyprotein processing and virus maturation [25].
Several polyphenols were also found to have a synergistic effect on 3CLpro and PLpro. Hence, 3CLpro is one of the best characterized drug targets, and natural polyphenolic mixture targeting 3CLpro could provide an effective defense against coronavirus infections [26].
Khaerunnisa et al. [27] investigated some polyphenols as potential inhibitor candidates for CoV-2 M protease. According to molecular docking analysis results for several compounds against CoV-2 6LU7 and 2GTB protease (including binding energy/Gibbs energy, ligand efficiency, inhibition constant, intermolecular energy, and van der Waals (VDW)-H Bond desolvation energy), kaempferol, quercetin, luteolin-7-glucoside, apigenin-7-glucoside, and epicatechin-gallate were the most recommended flavonoid compounds that may act as potential inhibitors of CoV-2 Mpro (Figure 11).
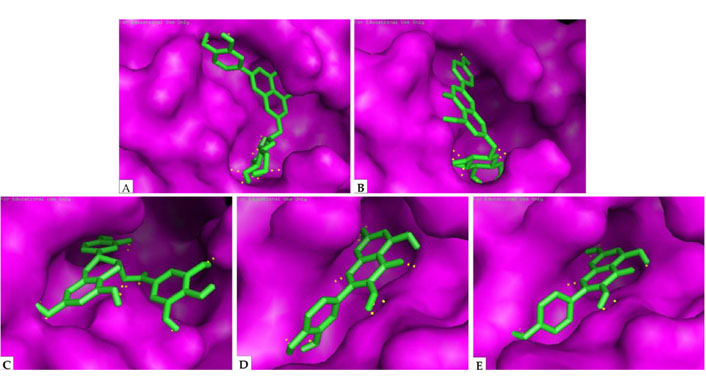
Docking analysis visualization of 6LU7 binding with (A) luteolin-7-glucoside; (B) apigenin-7-glucoside; (C) epicatechin-gallate; (D) quercetin; (E) kaempferol. The yellow dots show H-bonds
Note. Reprinted from “Potential inhibitor of COVID-19 main protease (Mpro) from several medicinal plant compounds by molecular docking study,” by Khaerunnisa S, Kurniawan H, Awaluddin R, Suhartati S, Soetjipto S. Preprints. 2020:2020030226 (http://dx.doi.org/10.20944/preprints202003.0226.v1). CC BY.
Secondary metabolites and synergetic molecules of flavonoids with hydroxy (-OH), ketone (=O), and ether (-O-) groups are predicted to play important roles in amino acid residue interactions at the active site of CoV-2 Mpro [28].
Another important investigation was performed by an IBM supercomputer (SUMMIT) that used artificial intelligence and mathematical modeling. Thousands of molecules and chemical structures were examined by artificial intelligence software, and 77 molecules were detected as potentially affecting CoV-2 virus spike proteins. These computer modeling results also support docking analysis experiments. Luteolin and quercetin are listed among the top 5 most effective chemicals for CoV-2 virus (Table 8) [29].
Top scoring ligands for SARS-CoV-2 S-glycoprotein ACE2 receptor interface
| Name | Vina score | Zinc ID |
|---|---|---|
| pemirolast | −7.4 | ZINC5783214 |
| benserazide | −7.4 | ZINC3830273 |
| natural product: luteolin-mono arabinoside | −7.4 | ZINC18185774 |
| pyruvic acid calcium isoniazid | −7.3 | ZINC4974291 |
| natural product: quercetin | −7.3 | ZINC3869685 |
| protirelin | −7.3 | ZINC4096261 |
| carbazochrome | −7.2 | ZINC100029428 |
| nitrofurantoin | −7.2 | ZINC3875368 |
| benserazide | −7.2 | ZINC3830273 |
| carbazochrome | −7.1 | ZINC100045148 |
Note. Reprinted from “Repurposing therapeutics for COVID-19: supercomputer-based docking to the SARS-CoV-2 viral spike protein and viral spike protein-human ACE2 interface,” by Smith M, Smith JC. ChemRxiv. 2020 (http://dx.doi.org/10.26434/chemrxiv.11871402.v4). CC BY NC ND.
Paraiso et al. [23] state that polyphenols inhibit viral proteases involved in viral replication due to their general affinity to proteins via hydrogen bonding, and they have a low risk of toxic effects. This statement may also be true for the binding of polyphenols to S protein, and pre-clinical and clinical studies are required to strengthen the existing evidence.
Chojnacka et al. [30] described the current knowledge about plant extracts containing polyphenols that inhibit COVID-19. According to the authors, natural polyphenol compounds might provide an alternative for coronavirus treatment and prevention. Antiviral polyphenolic compounds can inhibit coronavirus enzymes, which are essential for viral replication and infection. The authors also state that betulinic acid, indigo, aloe emodin, luteolin, quinomethyl triterpenoids, quercetin, and gallates are potential keys to designing antiviral therapies for inhibiting viral proteases. The known pharmacophore structures and safety effects of bioactive phytochemical substances can be useful in the elaboration of new anti-COVID-19 formulations.
Mhatre et al. [31] reviewed the antiviral activities of two polyphenols, epigallocatechin-3-gallate (EGCG) from green tea and theaflavins from black tea. They reported that both green and black tea polyphenols exhibit antiviral activities against various viruses, particularly positive-sense single-stranded RNA viruses. The authors summarized the available reports and evidence that support the use of polyphenols as potential candidates in the prophylaxis and treatment of COVID-19.
Levy et al. [32] emphasized the potential ability of polyphenols to combat SARS-CoV-2 infection via the regulation of its molecular targets of cellular binding and replication, as well as through the resulting host inflammation, oxidative stress, and signaling pathways.
Adem et al. [33] investigated 80 flavonoid compounds for SARS-CoV-2 Mpro and calculated the binding energies obtained from the docking of (PDB ID: 6LU7: Resolution 2.16 Å) with the native ligand. According to their results, hesperidin, rutin, diosmin, apiin, diacetylcurcumin, (E)-1-(2-hydroxy-4-methoxyphenyl)-3-[3-[(E)-3-(2-hydroxy-4-methoxyphenyl)-3-oxoprop-1-enyl]phenyl]prop-2-en-1-one, and beta,beta’-(4-methoxy-1,3-phenylene)bis(2’-hydroxy-4’,6’-dimethoxyacetophenone) were more effective against SARS-CoV-2 than nelfinavir. The authors suggest that this result will pave the way for advanced experimental research to evaluate the potential of flavonoid compounds to treat COVID-19.
In addition to the local effects of the virus itself, flavonoids were reported as a long-lasting and strong anti-inflammatory substance [34, 35]. The anti-inflammatory potential was demonstrated on different cell types, both in animal and human models. Flavonoids possess both mast-cell-stabilizing and gastrointestinal cytoprotective activity. In vivo studies also showed that flavonoids have immune-modulating activity in murine models [11, 12].
Another recent review study demonstrated the potential role of flavonoids in the modulation of signaling pathways that are crucial for COVID-19 disease, particularly those related to inflammation and immunity [13]. According to this paper, the immune-modulatory capacity of flavonoids involves multi-dimensional effects that include regulation of inflammatory mediators, inhibition of endothelial activation, NLRP3 inflammasome, toll-like receptors (TLRs) or bromodomain-containing protein 4 (BRD4), and the activation of the nuclear factor erythroid-derived 2-related factor 2 (Nrf2). These effects would be beneficial in regulating cytokine storms during SARS-CoV-2 infection.
Although these recent studies support the therapeutic effects of polyphenols, an effective compound consisting of a flavonoid has not yet been developed, primarily because the bioavailability of pure aglycone flavonoids is very low when used orally. Research shows that the oral bioavailability of flavonoids in humans is poor after a single oral dose (~2-10%). The estimated absorption ranges from 3% to 17% in healthy individuals receiving 100 mg of aglycone flavonoids.
In addition to low bioavailability, the extensive metabolism and/or rapid elimination of polyphenols may affect their pharmacokinetics [36]. Flavonoids are differently absorbed based on their chemical structure. Studies suggest that the conjugated glycoside (glycone) forms of flavonoids are better absorbed in the small intestine [37]. The absorption is also affected by dietary components such as fiber and fat [38].
Polyphenols must be hydrolyzed by intestinal enzymes or by the colonic microflora before they are absorbed. When the flora is involved, the efficiency of absorption is often reduced because the flora also degrades the aglycones that it releases and produces various simple aromatic acids in the process. During intestinal absorption, polyphenols are conjugated in the small intestine and later in the liver and kidney. This process includes methylation, sulfation, and glucuronidation. The conjugation mechanism is highly efficient, and aglycones are generally present in low concentrations after consumption of daily nutritional doses [39].
There are three ways to increase the pharmaceutical efficacy of polyphenols: raising the daily intake dose, increasing bioavailability, or reducing conjugation in the gut and liver. The first approach is most typically used, involving a rate of 1 g/day. However, when the daily flavonoid dose is increased to achieve therapeutic blood levels, toxic effects are encountered in organs (liver, thyroid, etc.) and DNA [40]. In this case, increasing the bioavailability would be a much safer and more effective solution.
The most accurate method to reduce the toxic effects of high-dose flavonoids and maintain the therapeutic dosage within safe limits is to use a conjugated glycone–aglycone flavonoid mixture. Therefore, to achieve the optimum therapeutic effects, we designed a new pharmaceutical formulation consisting of glycone/aglycone flavonoids, including quercetin, quercetin 3-sambubioside-3’-glucoside, luteolin, apigenin-7-4’alloside, kaempferol-7-O-glucoside, epicatechin-epigallocatechin-3-O-gallate, and hesperetin. These molecules and their synergetic methylated, sulfated, and glucuronide metabolites strengthen the antiviral, anti-inflammatory, and anti-coagulation effects of the compound.
Specific advanced qualification and quantification methods including HPLC, LC, MS, QTOF LC/MS, and UV–VIS spectrophotometry were used to achieve the optimum chemical standardization of the new formula.
In conclusion, according to the in vitro cytotoxicity–MTT test results, the L929 fibroblast cell viability at the highest concentration was 74%. The CHO cells exposed to the test formulation also exhibited CBPI and RI values similar to their negative controls and within acceptable ranges. These results suggest that the new formulation has no cytotoxic or genotoxic effects.
There are many types of in vivo toxicity methods for evaluating the toxic effects of therapeutic agents for humans and animals. In this study, acute (14 days) and subacute (28 days at repeated dose) toxicity experiments were used to determine the in vivo toxic effects of orally administering the new formulation to rats. The results revealed no mortalities or observed clinical signs of toxicity in any of the rats during the test periods. Under the experimental conditions, the acute toxicity test results indicated that the median LD50 of the new formula is much higher than 6 mg/day of body weight. These results demonstrated that the LD50 of the new formula is within the accepted limits and is a non-toxic substance according to the GHS.
Furthermore, there were no statistically significant differences regarding body and organ weights compared to treated rats and control groups in the subacute (repeated dosage) toxicity study. In fact, it was determined that the weights of the rats in the experimental group were more stable during the oral application compared to the control group. The present data set revealed no strong statistical correlation between body weight and administration of the new formula.
These pre-clinical in vitro and in vivo toxicity test results demonstrated that the new formula does not produce any toxic effects, and it can be safely used for subsequent clinical trials.
Abbreviations
| 3CLpro: | chymotrypsin-like protease |
| ACE2: | angiotensin-converting enzyme 2 |
| CBPI: | cytokinesis-block proliferation index |
| DMEM: | Dulbecco’s Modified Eagle’s Medium |
| HPLC: | high-performance liquid chromatography |
| LC–MS: | liquid chromatography–mass spectrometry |
| LD50: | median lethal dose |
| Mit-C: | mitomycin-C |
| MS: | mass spectrometry |
| MTT: | 3-(4,5-dimethylthiazol-2-yl)-2,5-diphenyltetrazolium bromide |
| OECD: | Organisation for Economic Co-operation and Development |
| SARS-CoV-2: | severe acute respiratory syndrome coronavirus 2 |
Declarations
Acknowledgments
The authors thank Mrs. Belgin Berker Budak for her support for this research. We also thank Mrs. Begüm Buğdaycı Açıkkol, Director of Kobay Exper. Animals Inc., Turkey.
Author contributions
GGB conducted this study and wrote this paper with SÖ. MB edited this manuscript. GGB did the compound formulation and HPLC analysis. TŞ performed LC–MS–MS analysis. BM applied QTOF analysis. ŞSM did total phenolic and flavonoid content determination. CÇÇ proceeded In vitro cytotoxicity and genotoxicity tests: In vivo acute/sub-acute oral toxicity and LD50 studies. OT performed In vivo acute/sub-acute oral toxicity and LD50 studies. MB assessed the tissue samples microscopically. SÖ made Statistical analysis. All authors have read and agreed to the published version of the manuscript.
Conflicts of interest
The authors declare no conflicts of interest.
Ethical approval
Institutional Review Board statement: the animal experiments were approved by the regional Ethical Committee for animal research. The licensing ethical committee approved the experiments, including any relevant details before the animal experiments (27.11.2020/514). The authors confirm that all experiments were performed in accordance with relevant international guidelines and regulations. The authors also complied with the ARRIVE guidelines. All manipulations were made to minimize animal suffering and reduce the number of animals used.
Consent to participate
Not applicable.
Consent to publication
Not applicable.
Availability of data and materials
Not applicable.
Funding
Not applicable.
Copyright
© The Author(s) 2022.