 Original Article

Affiliation:
1Rheumatology Department, Ramón y Cajal University Hospital, 28034 Madrid, Spain
2Medicine Department, Faculty of Biomedical Sciences and Health, European University, 28670 Villaviciosa de Odón, Spain
3Rheumatology Unit, HLA Moncloa University Hospital, 28008 Madrid, Spain
Email: carlosantonio.guillen@salud.madrid.org
ORCID: https://orcid.org/0000-0002-6480-2294
Affiliation:
2Medicine Department, Faculty of Biomedical Sciences and Health, European University, 28670 Villaviciosa de Odón, Spain
3Rheumatology Unit, HLA Moncloa University Hospital, 28008 Madrid, Spain
4Rheumatology Department, Rio Hortega University Hospital, 47012 Valladolid, Spain
ORCID: https://orcid.org/0009-0004-6658-5731
Affiliation:
1Rheumatology Department, Ramón y Cajal University Hospital, 28034 Madrid, Spain
5Rheumatology Department, Morales Meseguer University General Hospital, 30008 Murcia, Spain
Affiliation:
1Rheumatology Department, Ramón y Cajal University Hospital, 28034 Madrid, Spain
Affiliation:
1Rheumatology Department, Ramón y Cajal University Hospital, 28034 Madrid, Spain
ORCID: https://orcid.org/0009-0001-5098-8227
Affiliation:
6Emergency Unit, Ramón y Cajal University Hospital, 28034 Madrid, Spain
ORCID: https://orcid.org/0009-0001-1115-9602
Affiliation:
1Rheumatology Department, Ramón y Cajal University Hospital, 28034 Madrid, Spain
Explor Musculoskeletal Dis. 2024;2:148–155 DOI: https://doi.org/10.37349/emd.2024.00044
Received: December 20, 2023 Accepted: February 24, 2024 Published: May 15, 2024
Academic Editor: Rubén Queiro, Hospital Universitario Central de Asturias, Spain
The article belongs to the special issue Digital health technologies in rheumatology: emerging evidence and innovation
Aim: The aim of the present study is to conduct interobserver and intra-observer validation of computer analysis of static ultrasound images of entheseal territories of the Achilles and distal patellar tendons.
Methods: Three rheumatologists with varying levels of experience underwent training in the use of ImageJ software for the analysis of 384 pairs of ultrasound images (long and short axis) from recorded studies of the Achilles and patellar tendons of both spondyloarthritis (SpA) patients and controls. Intra-observer and interobserver tests were conducted by calculating the differences in measurements of the same image at two different times by the same observer and by two different observers assessing the same image. The measurements included the area of analysis, the mean grayscale intensity, and the dispersion of grayscale intensity.
Results: In the intra-observer test, no measurement showed a difference greater than 15%, ranging from 4.10% to 14.14%. In the interobserver test, no measurement exhibited a difference greater than 16%, ranging from 7.96% to 15.87%. The differences detected were evenly distributed among observers in both the intra-observer and inter-observer tests. Higher differences were detected in the analysis of images obtained from patient studies compared to control studies in almost all measurements.
Conclusions: Whether analyzing control or patient ultrasound images of Achilles and patellar tendons, the intra-observer and interobserver agreement of computer-based analysis of static ultrasound images is more than acceptable and predominantly excellent.
Ultrasound examination of tendons is integral to the supplementary assessment of patients with diverse musculoskeletal pathologies. Evaluating the ultrasonographic (US) structural condition of tendons, particularly the entheses, holds significant importance in the realm of spondyloarthritis (SpA) [1, 2], a heterogenous group of diseases characterised by the enthesic organ as their pathophysiological core [3].
Various scales have been developed and validated for diagnostic and follow-up purposes to standardise ultrasound examination protocols [1, 4]. Despite these endeavours, the US evaluation of entheses encompasses a subjective component concerning the appearance of the fibrillar structure, wherein the observer’s interpretation can wield substantial influence and potentially alter the scores’ outcomes [4, 5].
US studies are inherently operator-dependent, where the scanning technique and the observer’s interpretation influence the test outcome. While scanning load-bearing tendons (such as Achilles, patellar, and quadriceps) poses no technical challenge due to their anatomical configuration, subjective interpretation of images can sway the results of standardized measurement scales [6]. Additionally, using ordinal attributes to characterise the structural appearance of tendons in US studies, like mild, severe, or descriptive adjectives related to echo structure (e.g., homogeneous or heterogeneous), complicates short-term comparisons [1, 7–9] and may show a lack of interobserver agreement, a potential issue in US assessments [10].
By using specially designed software, it is possible to numerically analyze grey-scale images and quantify the patterns of pixel distribution in a given area. The quantification of the patterns generates numerical values that are easily comparable between different subjects or in the same subject over time [11].
Currently, although such kind of software tools have proliferated in certain medical domains, studies validating their utility in tendon examination, particularly in entheseal territories crucial to SpA study and monitoring, are lacking.
Validating quantitative assessment systems of entheseal territories would provide clinicians with an outcome variable possessing robust comparative capability, potentially reducing the time required to detect structural changes in patients undergoing specific treatments.
This study aims to validate the interobserver and intra-observer reliability of computer analysis of static ultrasound images of entheseal territories of the Achilles and distal patellar tendons. We justify the present study based on the importance of having a quantitative method that is useful for evaluating tendon and entheseal fibrillar patterns, both for its potential use in research and for eventual clinical utility.
A cross-sectional observational study of interobserver and intra-observer validation was developed from the review of static ultrasound images.
The study comprised images from 44 asymptomatic non-professional or semi-professional sports participants with no history of inflammatory disease or symptoms related to tendon territories, along with images from 52 patients diagnosed with axial SpA or psoriatic arthritis. These patients had been diagnosed for more than two years and had undergone either a Glasgow Ultrasound Enthesitis Scoring System (GUESS) [1] or Madrid Sonographic Enthesitis Index (MASEI) [4] scan protocol for diagnostic or follow-up purposes. No direct contact with asymptomatic subjects or patients was required for the study. Inclusion criteria dictated that the images encompassed both longitudinal and transverse aspects of the relevant structures.
All ultrasound images were captured using a Logiq S8 ultrasound machine (General Electric Healthcare™, USA) equipped with a linear probe up to 14 MHz. Since the validation was based on image analysis rather than acquisition, variations in preset settings such as gain, frequency, dynamic range, and depth were permitted. All studies comprised complete images of the distal patellar and Achilles tendon enthesis. Patient identities and imaging dates were anonymised, with each image replaced by a code. The acquisition recommendations for the original images adhered to the protocols established for the two aforementioned enthesis scanning protocols.
Longitudinal ultrasound assessment involved examining the entire enthesis, extending from the distal point of bony insertion to the proximal point of separation from the cortex. Transverse ultrasound assessment images of the tendons were obtained at precisely the same proximal point. While the images were captured by an expert US, only records devoid of suspected anisotropic phenomena were included.
ImageJ v1.53e software (Wayne Rasband and contributors National Institute of Health, USA) was used. The analysis was performed on territories distal to the point of tendon separation from the corresponding bony cortex. Three different observers performed a 45 min training prior to the start of the studies. Each study included: demarcation of the area of interest, mean of grayscale intensities, and dispersion of grayscale intensities (standard deviation). Longitudinal and transverse analysis of the images was performed. The number of total images was: 176 images of healthy subjects (88 patellar tendons + 88 Achilles tendons) and 208 images of patients (104 patellar tendons + 104 Achilles tendons). Each observer evaluated all images using the same computer and software version in different periods without a time limit. The process of analysis is shown in Figure 1.
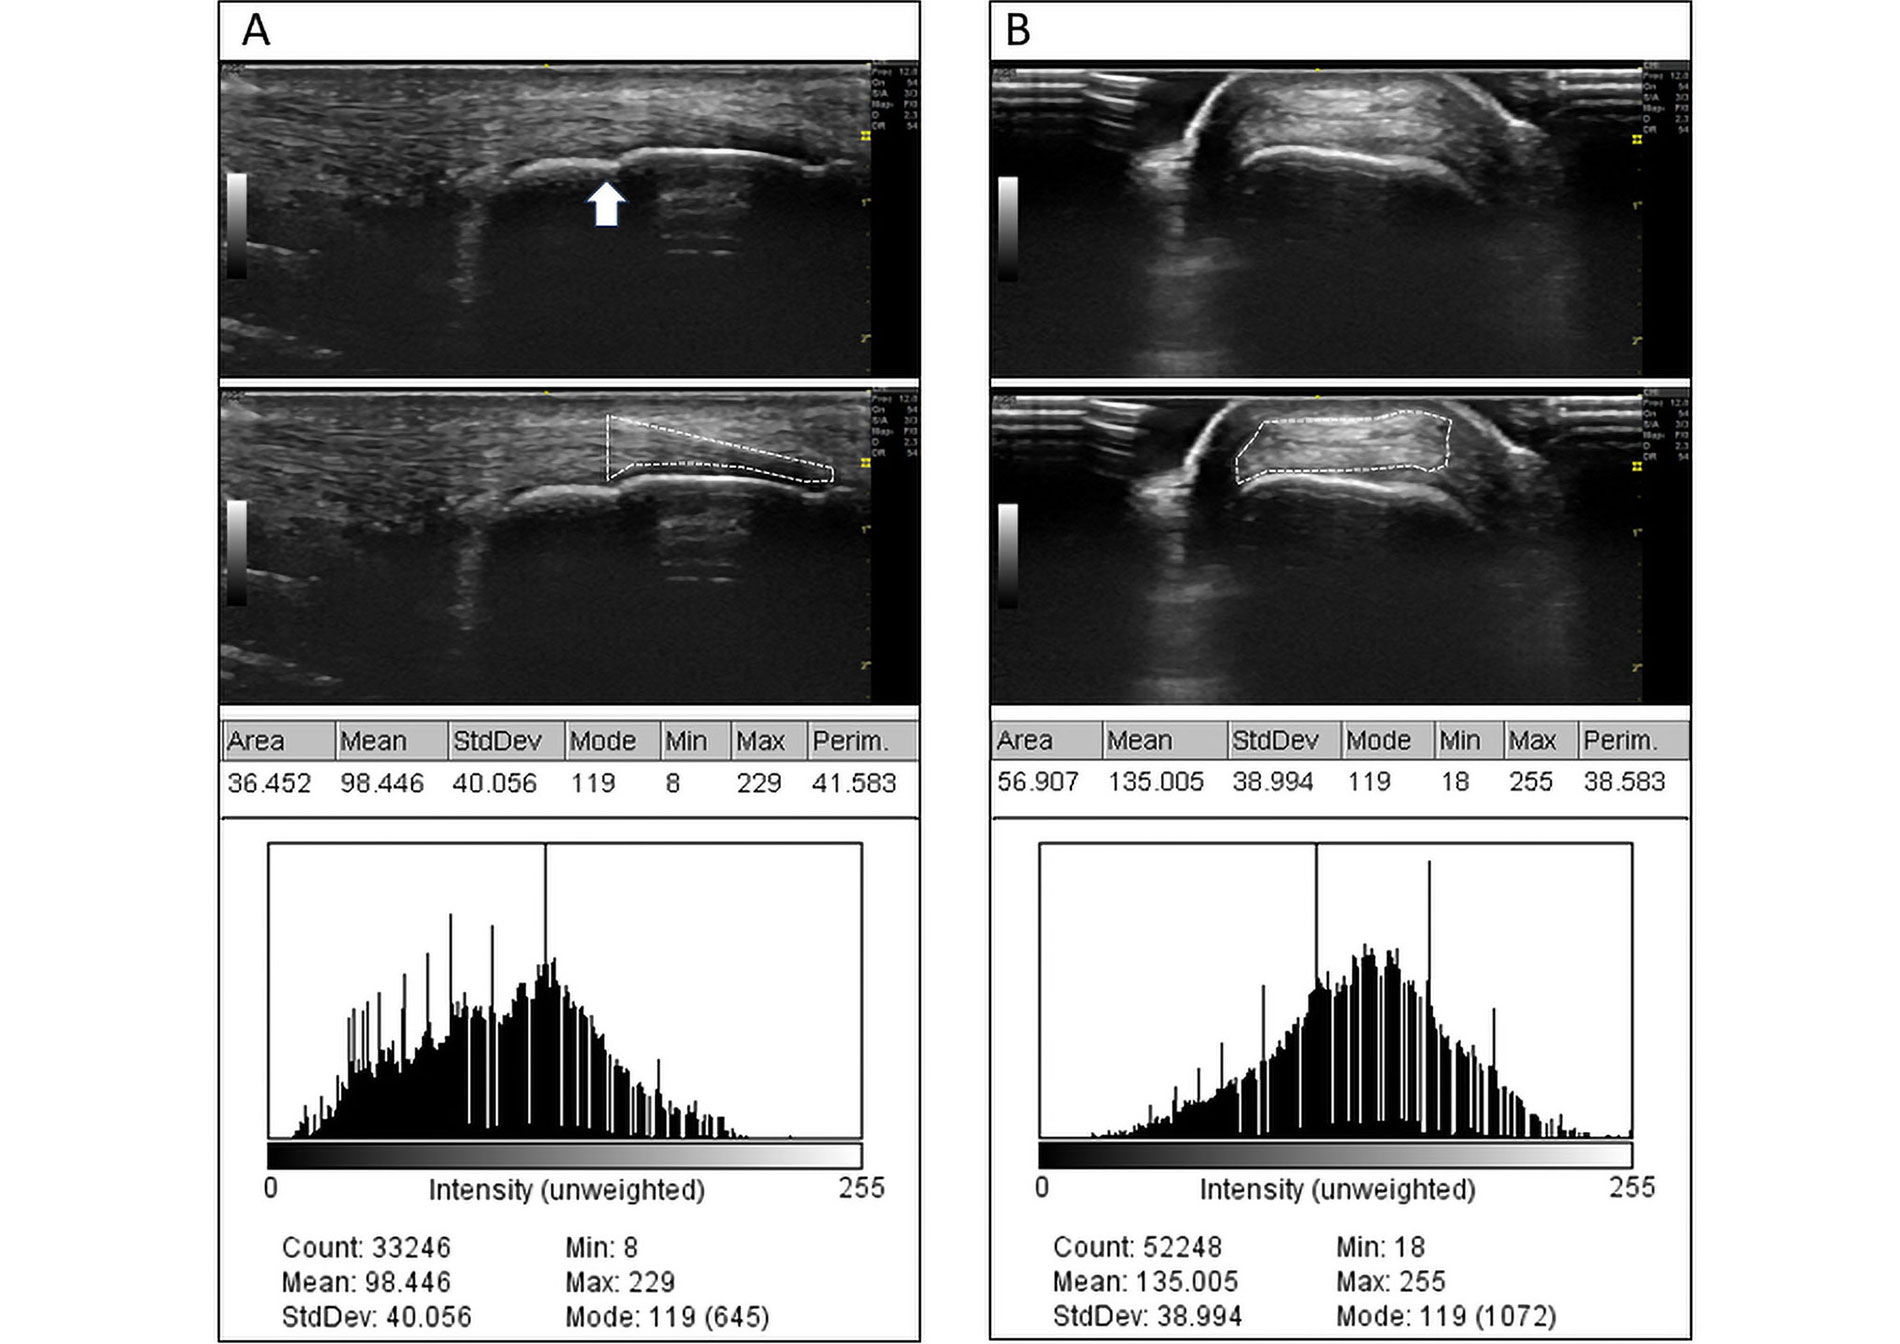
Analysis process using ImageJ software. A. Analysis of the longitudinal aspect of the tendon; B. analysis of the tendon cross-section. The white arrow in A indicates the point of separation of the tendon from its enthesis, corresponding to the transverse section in B. The first row shows the original images. The second row shows the selection of the area made by an observer. The third row shows the results of the point analysis, which is also represented by a histogram of point distribution in the grayscale (0–255) in the fourth row. The areas are expressed in mm2
Area of interest: it is a polygon delineated by the software user encompassing the entheseal territory. For the purposes of our study, its quantification is carried out based on the numerical scale predetermined by the image itself (in square millimetres). The enthesis cannot include structures outside the tendon; however, it may include calcifications or enthesophytes.
Mean of grayscale intensities: this is the arithmetic mean of all intensities on the grayscale identified within the analysis area. Intensities can take on 256 values, ranging from 0 (black) to 255 (white). In the individual analysis of the same tendon or enthesis, a shift of the mean towards 0 or 255 implies a greater overall tendency towards hypoechoicity or hyperechoicity, respectively, but does not imply homogeneity.
Dispersion of grayscale intensities: corresponds to the standard deviation of the mean grayscale intensities. This refers to the distribution of different intensities around the mean. Small dispersions indicate a more homogeneous pattern, while large dispersions imply the presence of heterogeneous regions within the area of interest. Very large dispersions can occur when enthesophytes are included within the area of interest, or due to errors in delineating the boundaries of the area of interest when it includes the bony cortex, bursal territories, or ultrasound gel.
For the intra-observer analysis, each observer performed two studies of all pairs of images (longitudinal and transverse) on two different occasions. The images were provided coded and in random order. The mean percentage difference between the major and minor measurement of each of the 384 image pairs (176 from healthy subjects and 208 from patients) was calculated.
For the interobserver analysis, the mean of the percent difference between the measurements obtained by each pair of observers from the evaluation of the first of the 384 images evaluated was calculated. For analysis purposes, the difference was calculated in all cases using the major and the minor measurement in order to avoid the use of quadratic conversions. In both cases, in order to calculate the corresponding percentages, the smaller magnitude was chosen as the denominator. For the purpose of evaluating both types of agreement, concordance was recognized as excellent if it exhibited less than 20% variability.
Observer A was a senior rheumatologist with full musculoskeletal ultrasonography training and more than ten years of experience, and observers B and C were two junior rheumatologists with six months of training in ultrasonography.
The 176 control images and 208 patient images were analyzed for an average of 7 min, 9 min, and 6 min per image by observers A, B, and C, respectively. The observers required technical assistance on three occasions each during the first 10 evaluations, 15 evaluations, and 40 evaluations, respectively.
In the analysis of control images, the mean area gradient (range) was 8.63% (6.38–12.09%). In the analysis of patient images, the mean area gradient was 9.23% (5.44–13.15%). In both cases, the lowest gradient was obtained by observer A and the highest by observer C.
The mean gradients of the average gray intensities in the analysis of control images were 7.53% (4.10–10.04%) and 8.32% (5.62–11.90%) in the analysis of patient images. In both cases, the lowest gradient was obtained by observer A and the highest by observer C.
The mean gradients of dispersions (standard deviations from the mean gray intensities) in the control image analysis were 11.17% (9.00–13.20%) and 11.79% (9.10–14.14%) in the patient image group. Observer C obtained the lowest and highest gradient in the control group, and observers A and B obtained the lowest and highest gradient in the patient group, respectively. A summary of the complete results of all intra-observer experiments is shown in Table 1.
Results of the intra-observer test
| Region assessed | Observer A | Observer B | Observer C | ||||||
|---|---|---|---|---|---|---|---|---|---|
| Area of analysis | Gray-scale intensity mean | Gray-scale dispersion | Area of analysis | Gray-scale intensity mean | Gray-scale dispersion | Area of analysis | Gray-scale intensity mean | Gray-scale dispersion | |
| Control | |||||||||
| Patellar long-axis | 6.40% | 5.33% | 11.40% | 7.41% | 6.90% | 12.12% | 8.97% | 8.45% | 13.20% |
| Patellar short-axis | 9.49% | 7.91% | 10.24% | 8.11% | 7.72% | 10.53% | 7.16% | 8.91% | 12.93% |
| Achilles long-axis | 6.38% | 7.41% | 10.75% | 8.68% | 8.87% | 11.17% | 8.04% | 9.17% | 12.72% |
| Achilles short-axis | 11.57% | 4.10% | 9.98% | 9.23% | 5.57% | 10.00% | 12.09% | 10.04% | 9.00% |
| SpA patients | |||||||||
| Patellar long-axis | 8.40% | 7.14% | 13.18% | 6.98% | 8.25% | 14.14% | 8.54% | 8.95% | 12.94% |
| Patellar short-axis | 10.03% | 5.62% | 11.73% | 11.15% | 8.84% | 12.17% | 12.21% | 7.99% | 10.20% |
| Achilles long-axis | 5.44% | 6.82% | 12.38% | 6.84% | 9.54% | 11.26% | 7.99% | 10.59% | 14.08% |
| Achilles short-axis | 9.83% | 6.14% | 9.10% | 10.18% | 8.04% | 10.05% | 13.15% | 11.90% | 10.28% |
Percentages represent the mean of the proportion of the difference between the highest and lowest determination obtained by each observer of the same image in two different moments
The average gradient between the two-observer analysis area measurements was 11.14% (9.01–13.26%) in the control imaging group and 11.19% (9.15–12.53%) in the patient imaging group. The highest and lowest average gradients occurred between observers A-B and A-C, respectively, both in the control imaging group.
The average gray intensity gradients of two observers were 10.30% (9.18–11.64%) in the control imaging group and 10.07% (7.96–11.90%) in the patient imaging group. The highest and lowest average gradients occurred between observers A-B and B-C, respectively, both in the patient imaging group.
The average gradients of dispersions with respect to the mean gray intensity of two observers were 13.87% (11.95–15.87%) in the control imaging group and 13.38% (11.88–15.58%) in the patient imaging group. The highest and lowest average gradients occurred between the A-B observers in the control imaging group and between the A-B observers in the patient imaging group, respectively. The complete results of all interobserver experiments are summarized in Table 2.
Results of the interobserver test
| Region assessed | Observer A-B | Observer B-C | Observer A-C | ||||||
|---|---|---|---|---|---|---|---|---|---|
| Area of analysis | Gray-scale intensity mean | Gray-scale dispersion | Area of analysis | Gray-scale intensity mean | Gray-scale dispersion | Area of analysis | Gray-scale intensity mean | Gray-scale dispersion | |
| Control | |||||||||
| Patellar long-axis | 10.69% | 9.18% | 12.14% | 12.28% | 11.64% | 13.39% | 10.11% | 9.36% | 15.18% |
| Patellar short-axis | 9.01% | 10.56% | 11.95% | 11.03% | 11.27% | 13.64% | 10.73% | 10.69% | 14.24% |
| Achilles long-axis | 11.21% | 10.06% | 15.87% | 12.31% | 9.6% | 14.2% | 13.26% | 10.44% | 13.01% |
| Achilles short-axis | 10.66% | 10.44% | 14.4% | 12.22% | 10.33% | 13.34% | 10.12% | 10.07% | 15.07% |
| SpA patients | |||||||||
| Patellar long-axis | 10.98% | 8.11% | 11.88% | 11.89% | 7.96% | 12.14% | 12.1% | 10.64% | 12.8% |
| Patellar short-axis | 9.99% | 11.53% | 12.66% | 12.01% | 11.64% | 15.58% | 9.15% | 8.55% | 13.69% |
| Achilles long-axis | 11.02% | 10.19% | 12.57% | 11.88% | 10.2% | 12.9% | 11.17% | 11.37% | 14.67% |
| Achilles short-axis | 12.02% | 11.9% | 13.83% | 9.59% | 8.64% | 15.53% | 12.53% | 10.11% | 12.25% |
Percentages represent the mean of the proportion of the difference between the highest and lowest determination obtained by each observer of the same image the first time it was assessed
The use of computer analysis of static images lacks precedent in the examination of load-bearing tendons, let alone in the investigation of entheseal territories. Existing experience in muscle tissue [12] and rotator cuff tendons [13] is scarce, albeit positively indicative of validity.
While the principal advantage of this analysis lies in enabling the numerical assessment of a structure via its image, a significant concern is ensuring the accurate translation of this evaluation to the studied structure. However, classical musculoskeletal ultrasound typically assumes this certainty, relying on the interpretation of ultrasound studies using ordinal scales.
A legitimate concern is assuming the validity of computer analysis of tendon structures across different planes of approach. Previous studies by our team, recently reported [14], have confirmed this validity. However, to mitigate potential biases, the equipment and presets employed to obtain comparable images had to be precisely identical.
Overall, our study has demonstrated high levels of intra-observer and interobserver agreement. Gradients between higher measurements did not necessarily occur among less experienced observers, nor when comparing them with more seasoned counterparts. Nonetheless, in classical interobserver exercises in ultrasound, observer experience is deemed relevant [10]. This suggests that the use of such software does not necessitate extensive learning curves. Furthermore, considering that the exercise was based on analyzing pre-obtained images, it could be argued that the software operator need not even be a rheumatologist.
Our study does not seek to validate the capability of computer analysis of static images to differentiate between patients and controls, but rather its interobserver and intra-observer validity concerning the three most critical measurements conducted in this analysis. The area of analysis constitutes the two-dimensional space bounded by a polygon considered by the observer to be of interest for study purposes. This area should exclude bone edges or cartilage tissue, focusing solely on what is defined as the enthesis territory: the section of the tendon in contact with the bony cortex. The mean grayscale intensity is a measure summarising the character of intensity points within the analysis area. Magnitudes near zero tend to be hypoechoic, while those near 255 tend to be hyperechoic. Lower averages indicate more edematous or inflamed tendons, whereas higher averages suggest less edematous or even calcified tendons. Grayscale dispersion is another noteworthy measure, with smaller magnitudes indicating homogeneous echo structures relative to the mean, and larger magnitudes suggesting significant variabilities, such as the presence of an enthesophyte in the midst of a predominantly hypoechoic territory. Understandably, no measurement can provide a topographical distribution of lesion locations, with visual assessment remaining the optimal method for this purpose.
Computer analysis presents three notable limitations: firstly, the time required for completion and the need to process images outside the equipment generating them may limit its utility to research purposes or occasional auxiliary monitoring [12, 13]. Secondly, acoustic shadows caused by hyperechoic bodies, such as calcifications or enthesophytes [15, 16], may be interpreted as anechoic zones, affecting the average grayscale intensity parameters and their dispersion. The same applies to the artifact known as posterior acoustic enhancement, caused, for example, by superficial bursal distention [15, 17]. Lastly, another significant limitation is the requirement for the parameters used in the study and the ultrasound equipment to be precisely identical to avoid influencing the results of the aforementioned measurements.
Taking into account the aforementioned, the role that computer analysis of static images can play is that of becoming a numerical outcome variable susceptible to being primarily utilised in patient follow-up studies over time to assess, for instance, modifications in the fibrillar pattern as responses to treatment. Its use could also be extended to other territories where analysis of the fibrillar pattern holds significant interest, such as muscle tissue, albeit following a validation exercise.
SpA: spondyloarthritis
US: ultrasonographic
CGA, MVD: Conceptualization, Investigation, Writing—original draft, Writing—review & editing, Supervision. AAS, MTC, RM, NGM, and XCO: Investigation, Validation, Writing—review & editing. All authors read and approved the submitted version.
The authors declare that they have no conflicts of interest.
The study was approved by our local ethics committee for scientific studies (EXP 170522-ACT433). This study complies with the Declaration of Helsinki.
Although no explicit patient participation was required for the conduct of the present study, previously stored images of patients and healthy subjects were used. Thus, con informed consent was extended nor used for purposes of present study.
Not applicable.
The results of the measurements performed were stored electronically in a database whose availability is open to any researcher, on demand.
Not applicable.
© The Author(s) 2024.
Copyright: © The Author(s) 2024. This is an Open Access article licensed under a Creative Commons Attribution 4.0 International License (https://creativecommons.org/licenses/by/4.0/), which permits unrestricted use, sharing, adaptation, distribution and reproduction in any medium or format, for any purpose, even commercially, as long as you give appropriate credit to the original author(s) and the source, provide a link to the Creative Commons license, and indicate if changes were made.

Hannah Labinsky ... Johannes Knitza
Prakashini Mruthyunjaya ... Debashish Danda
Michael Schirmer ... Johannes D. Pallua
Diego Benavent ... Antonio Gómez-Centeno
Sumaira Farman ... Saira Elaine Anwer Khan
Judy L. Seraphine, Alvin F. Wells
