Review

Affiliation:
1Center for New Drug Safety Evaluation and Research, China Pharmaceutical University, Nanjing, Jiangsu 211198, China
ORCID: https://orcid.org/0009-0009-9572-3810
Affiliation:
2Department of Nuclear Medicine, Nanjing First Hospital, Nanjing Medical University, Nanjing, Jiangsu 210006, China
Affiliation:
1Center for New Drug Safety Evaluation and Research, China Pharmaceutical University, Nanjing, Jiangsu 211198, China
Affiliation:
3Department of Neurosurgery, Nanjing Medical University, Nanjing, Jiangsu 210006, China
Affiliation:
1Center for New Drug Safety Evaluation and Research, China Pharmaceutical University, Nanjing, Jiangsu 211198, China
ORCID: https://orcid.org/0000-0001-7998-5129
Affiliation:
2Department of Nuclear Medicine, Nanjing First Hospital, Nanjing Medical University, Nanjing, Jiangsu 210006, China
Email: fengwangcn@hotmail.com
Affiliation:
1Center for New Drug Safety Evaluation and Research, China Pharmaceutical University, Nanjing, Jiangsu 211198, China
Email: yy@cpu.edu.cn
Explor Neurosci. 2025;4:100675 DOI: https://doi.org/10.37349/en.2025.100675
Received: January 05, 2025 Accepted: February 14, 2025 Published: February 25, 2025
Academic Editor: Ryszard Pluta, Medical University of Lublin, Poland
The article belongs to the special issue Alzheimer's Disease
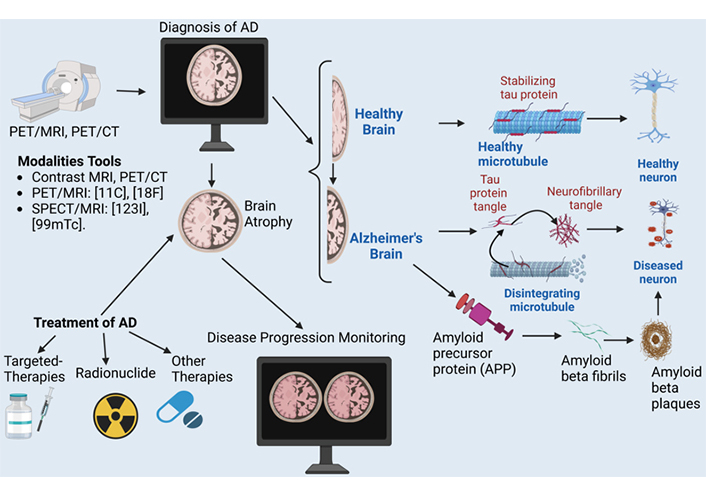
Alzheimer’s disease (AD) is a neurodegenerative disorder that affects millions of people worldwide. It presents a significant challenge in terms of accurate diagnosis, disease progression monitoring, and the development of effective treatments. This article addresses the role of neuroimaging as an advancing tool for diagnosis, monitoring progression, and treatment of AD. A comprehensive review of existing literature on the use of neuroimaging in AD was conducted using various databases. The different imaging techniques, such as magnetic resonance imaging (MRI), single photon emission computed tomography (SPECT), and positron emission tomography (PET), were examined in terms of their ability to detect amyloid beta (Aβ) plaques and neurofibrillary tangles (NFTs), the hallmark pathological features of AD. Neuroimaging enables the visualization of Alzheimer-related biomarkers, such as Aβ plaques, tau protein tangles
Alzheimer’s disease (AD) is a progressive neurodegenerative disorder characterized by the building up of aberrant proteins, inflammation, and progressive loss of neurons and synapses in the brain. This progressive neurodegenerative disorder is marked by the slow degeneration of brain neuron cells, causing memory loss, cognitive decline, and changes in behavior [1–11].
The pathology of AD is characterized by the deposition of two main proteins: amyloid beta (Aβ) peptides and tau protein. Aβ peptides are produced when a larger protein known as amyloid precursor protein (APP) is cleaved by β-secretase and γ-secretase enzymes, giving rise to the formation of insoluble fibrils that aggregate into senile plaques, a hallmark of the pathology of AD [12–14]. Tau protein, on the other hand, is microtubule-associated protein that get hyperphosphorylated and forms neurofibrillary tangles (NFTs), which are another characteristic feature of AD [15]. The progression of AD pathology also begins with the deposition of Aβ peptides in the brain, followed by the formation of NFTs and synapse loss [16]. As the disease advances, the building up of these abnormal proteins leads to the activation of immune cells, such as microglia and astrocytes, which release pro-inflammatory cytokines and reactive oxygen species (ROS), causing further tissue damage and neuronal death [17, 18]. The loss of neurons and synapses leads to cognitive decline, memory impairment, and eventually dementia [19–21]. Furthermore, AD pathology also involves disrupting various cellular processes, including synaptic plasticity, mitochondrial function, and energy metabolism [20]. Mitochondrial dysfunction has been linked to AD by building up Aβ peptides, which can impair adenosine triphosphate (ATP) production and increase ROS production [22–24]. Additionally, alterations in gene expression and epigenetic modifications have been observed in AD brains, giving rise to changes in the regulation of gene transcription and protein synthesis [25, 26].
Aβ is a protein fragment that plays an essential role in AD development. It consists of 39–43 amino acid-long peptide that is generated through the proteolytic processing or sequential pathological cleavage of the APP by enzymes known as β-secretase and γ-secretase [27–29]. In healthy individuals, APP is also cleaved into a soluble form of Aβ40, which is less neurotoxic and aggregates more slowly. However, in AD, Aβ peptides, particularly Aβ42, aggregate into oligomers, fibrils, and plaques in the brain, disrupting neuronal function. These aggregates induce neurotoxicity by triggering oxidative stress, inflammation, and synaptic dysfunction, ultimately contributing to neurodegeneration and cognitive decline [30]. While Aβ40 is less prone to aggregation, it still contributes to the overall amyloid burden and may modulate the aggregation of Aβ42 [30]. The ratio of Aβ42 to Aβ40 in cerebrospinal fluid (CSF) has emerged as a potential biomarker for AD diagnosis and progression, with a lower ratio indicating a higher likelihood of AD pathology [31]. The amyloid cascade hypothesis suggests that Aβ accumulation is an early and central event in AD pathology, leading to tau protein hyperphosphorylation, NFTs, and neuronal death [32]. Aβ can bind to various receptors, including the receptor for advanced glycation end-products (RAGE), which can activate downstream signaling pathways that promote neuroinflammation and oxidative stress [33]. The aggregation of Aβ into insoluble fibrils is thought to be a significant step in the pathogenesis of AD [34]. The amyloid fibrils can deposit in the brain, forming characteristic amyloid plaques that are associated with neuronal degeneration and death [34–37]. The exact mechanisms by which Aβ aggregation leads to neurodegeneration are still not fully understood. Still, it is thought to involve the activation of various cellular stress pathways, including the unfolded protein response and the autophagy-lysosome pathway [14, 38].
In AD, Aβ has been identified as one of the primary pathological hallmarks of the disease. Mutations in genes encoding APP or the enzymes involved in its processing, such as β-secretase and γ-secretase, have been linked to early-onset familial AD (EOFAD), highlighting the critical role of Aβ in disease pathogenesis [39, 40]. Furthermore, Aβ has been shown to be elevated in the CSF of individuals with AD compared to healthy controls, providing a potential biomarker for diagnosing and monitoring disease progression [31, 41].
The tau protein is one of the key players in the development of AD [42]. Tau is a microtubule-associated protein that is primarily found in the brain and plays an important role in maintaining the stability and organization of microtubules, which are essential for neuronal function and survival [43]. In healthy individuals, tau is normally phosphorylated at specific serine and threonine residues, which allows it to bind to microtubules and regulate their dynamics [44]. However, in AD, tau protein becomes abnormally hyperphosphorylated at multiple sites, leading to its aggregation into insoluble fibrils that can build up in the brain [45]. The abnormal tau protein aggregates, known as NFTs, are a hallmark pathological feature of AD and are thought to contribute to the disruption of normal brain function and neuronal degeneration [46]. Over and above that, NFTs are highly correlated with cognitive decline and dementia severity in AD patients [47, 48]. The aggregation of tau protein is thought to occur through a process called seeding, where misfolded tau protein interact with each other and recruit more native tau protein to form insoluble fibers [49]. Research has shown that mutations in the MAPT gene, which encodes the tau protein, can increase the risk of developing frontotemporal dementia (FTD), including frontotemporal lobar degeneration (FTLD) and progressive supranuclear palsy (PSP) [50]. Moreover, studies have identified specific genetic variants of the MAPT gene that are associated with an increased risk of AD and FTD [51].
Neuroinflammation plays a vital role in the progression of AD, a chronic and neurodegenerative disorder characterized by the accumulation of Aβ plaques, NFTs, and synaptic loss. As proposed by Heneka et al. [52], “neuroinflammation is an integral component of AD pathophysiology, and its resolution is critical for effective therapy”. In AD, neuroinflammation is triggered by the deposition of Aβ peptides, which are generated from the proteolytic cleavage of APP. Aβ building up in the brain gives rise to the activation of microglia, the resident immune cells of the central nervous system (CNS), which then release pro-inflammatory cytokines such as tumor necrosis factor-alpha (TNF-alpha), interleukin-1 beta (IL-1β), and IL-6 [53–55]. These pro-inflammatory mediators activate astrocytes, another type of glial cell, leading to the production of ROS, nitric oxide (NO), and excitotoxic neurotransmitters, which further exacerbate neuroinflammation [56]. Moreover, activated microglia also produce reactive astrocytes, which can lead to an imbalance in glutamate homeostasis, resulting in excitotoxicity and neuronal death. Over and above that, neuroinflammation can lead to blood-brain barrier disruption, allowing toxic substances to enter the CNS and exacerbating neurodegeneration [57, 58]. Furthermore, neuroinflammation can also contribute to the formation of NFTs by promoting tau protein hyperphosphorylation and aggregation. Tau protein is a microtubule-associated protein that becomes abnormally phosphorylated and forms insoluble aggregates in the brains of individuals with AD. Activated microglia can release factors that promote tau protein phosphorylation and aggregation, leading to the building up of NFTs [13]. The aggregation of Aβ fibrils in (Figure 1) triggers a devastating chain reaction of neurodegeneration and, ultimately, cell death.
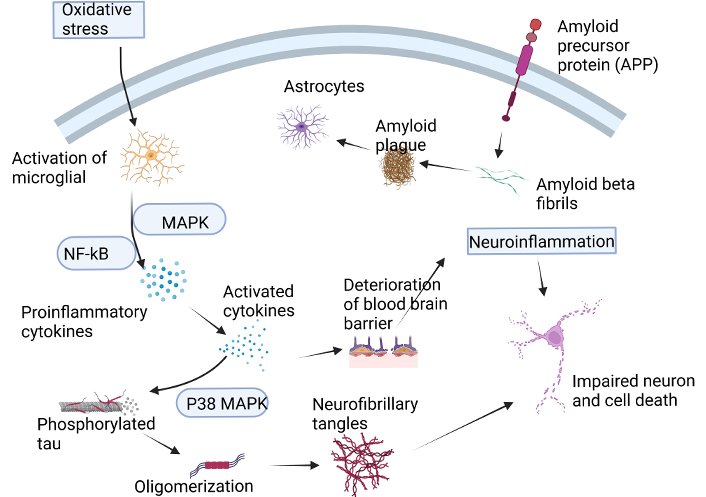
The formation of Aβ fibrils leads to a cascade of events that ultimately result in neuronal death. This process is initiated by the generation of ROS, neurotoxicity, and the release of pro-inflammatory cytokines. The accumulation of Aβ oligomers also triggers the activation of microglia, which release pro-inflammatory mediators, neurotoxins, and free radicals. However, microglia also play a crucial role in clearing Aβ peptides from the brain. The accumulation of Aβ peptides in neurons leads to oxidative stress, which promotes inflammatory processes and enhances the production of Aβ peptides through increased APP expression. This, in turn, MAPK and the NF-кB, leading to the production of pro-inflammatory cytokines. The increased expression of these cytokines promotes APP processing and disrupts the BBB, leading to an exacerbation of tau protein phosphorylation and the formation of NFTs. Ultimately, this cascade of events contributes to neuronal degeneration and death. Aβ: amyloid beta; APP: amyloid precursor protein; BBB: blood brain barrier; ROS: reactive oxygen species; MAPK: mitogen-activated protein kinase; p38 MAPK: p38 mitogen-activated protein kinase; NFTs: neurofibrillary tangles; NF-κB: nuclear factor kappa-light-chain-enhancer of activated B cells. Created with BioRender.com
Diagnostic methods for AD typically involve a combination of several approaches, including 1) clinical evaluation, including medical history and physical examination [59]; 2) cognitive and neuropsychological assessments [59–61]; 3) neuroimaging studies using computed tomography (CT) or magnetic resonance imaging (MRI): used to obtain images of the brain to rule out other causes of dementia, such as tumors, strokes, or significant brain atrophy indicative of AD [59, 60, 62]; 4) biomarker analysis, such as Aβ and tau protein [63, 64]; 5) genetic testing [65]; 6) laboratory tests: blood tests to rule out other potential causes of memory loss, such as vitamin deficiencies, thyroid dysfunction, or infections [66].
A definitive diagnosis of AD during life remains challenging due to the need for specific biomarkers and clinical evaluations. Current methods combine neuroimaging techniques, CSF analysis, and neuropsychological assessments. Positron emission tomography (PET) scans using radiotracers can identify Aβ plaques in the brain, a hallmark of AD. CSF analysis for Aβ, tau protein, and phosphorylated tau protein also helps distinguish AD from other neurodegenerative disorders. Structural MRI can detect brain atrophy patterns typical of AD, particularly in the hippocampus and entorhinal cortex. Advanced neuropsychological testing assesses cognitive function and can identify the presence and progression of dementia. These methods significantly improve diagnostic accuracy [67–69].
Structural MRI plays a very important role in the diagnosis and monitoring of AD. Structural MRI enables the visualization of brain structure and morphology, allowing for the detection of brain atrophy and volume changes, which are hallmarks of AD [70]. Some studies have consistently shown that AD patients exhibit significant atrophy in various brain regions, including the hippocampus, entorhinal cortex, and temporal lobe [71, 72]. As proposed by Nobis et al. [73], a meta-analysis of 16 studies found that the hippocampal volume was significantly reduced in AD patients compared to healthy controls. In addition to identifying atrophy, structural MRI can also help to differentiate between AD and other dementias. For instance, a study using voxel-based morphometry found that AD patients showed greater atrophy in the entorhinal cortex and posterior cingulate cortex compared to patients with FTD [74]. Furthermore, structural MRI can be used to monitor disease progression and track treatment response. A longitudinal study using MRI found that patients with AD exhibited significant cortical thinning over a 2-year period, which was correlated with cognitive decline [75]. Moreover, structural MRI can also aid in identifying biomarkers for AD. For example, a study using MRI-based cortical thickness measurements identified a set of biomarkers that could distinguish between AD patients and healthy controls with high accuracy [76]. On top of that, structural MRI can be used to identify individuals at risk of developing AD. A study using MRI-based hippocampal volume measurement found that individuals with mild cognitive impairment (MCI) had smaller hippocampal volumes than healthy controls, and these individuals were more likely to convert to AD over time [77].
Functional MRI (fMRI) helps researchers understand brain connectivity and functional networks in AD patients [78, 79]. fMRI technology, which originated in the early 1990s, brought about a revolutionary change in the research of brain function by providing substantial improvements compared to alternative methods. One of its key advantages is its ability to visualize activity in all areas of the brain, including those that are not easily accessible near the surface. Unlike PET, fMRI does not require radiation or the use of a radioactive tracer. Instead, it uses a non-invasive process that measures changes in oxygen levels in the brain, known as blood-oxygen-level-dependent (BOLD) signals, which occur within a timeframe of just 1–5 s. These signals are recorded over time by fMRI scanners, allowing researchers to use high-powered computing and statistical analyses to infer changes in neuronal activity with high spatial resolution in specific brain regions [80–84].
fMRI has emerged as a promising diagnostic tool for AD in recent years. fMRI measures changes in brain activity and structure, allowing researchers to identify patterns of alteration that may be specific to AD. One of the primary methods used in fMRI diagnosis of AD is functional connectivity analysis, which examines the synchronization of activity between different brain regions. As stated by Randy and Buckner et al. [85, 86], AD patients exhibit reduced functional connectivity between the default mode network (DMN), which is responsible for introspection and self-referential thinking, and other brain regions. This reduction in functional connectivity has been associated with the characteristic memory impairments and cognitive decline seen in AD patients. Another approach used in fMRI diagnosis is the analysis of task-based activation patterns. In this method, patients are asked to perform a specific cognitive task, such as memory recall or language processing, while their brain activity is measured using fMRI. As proposed by Palmer et al. [87], AD patients exhibit reduced activation in regions involved in these tasks, such as the prefrontal cortex and parietal lobe. In addition, AD patients often exhibit increased activation in regions involved in attentional control, such as the anterior cingulate cortex, which may reflect compensatory mechanisms to overcome cognitive deficits.
Proton magnetic resonance spectroscopy (MRS) has emerged as a promising diagnostic tool for AD, offering insights into the biochemical changes that occur in the brains of affected individuals. One of the most significant advantages of MRS is its ability to non-invasively measure the levels of various metabolites, such as choline-containing compounds, creatine, and neurotransmitters, in specific brain regions [88, 89]. In AD, MRS has shown increased levels of choline-containing compounds, particularly phosphocholine, and glycerophosphocholine, in the temporal and frontal lobes [90]. This increase is thought to be due to the breakdown of cell membranes and the activation of cholinergic pathways in response to Aβ accumulation [91, 92]. Conversely, MRS has also demonstrated decreased levels of N-acetyl aspartate (NAA), a marker of neuronal integrity, in AD patients [93]. This reduction is consistent with the well-documented neuronal loss and degeneration characteristic of the disease.
Another area where MRS has shown promise is in the detection of cerebral glucose hypometabolism, a hallmark feature of AD. Studies have used MRS to measure cerebral lactate and glucose levels, finding that both are decreased in AD patients compared to healthy controls [94–96]. This reduction is thought to reflect impaired glucose metabolism and energy deficiency in affected brain regions. Furthermore, MRS has also been used to assess the brain’s response to therapeutic interventions. For example, Panza et al. [97], demonstrated that increased glutamate and glutamine levels in the hippocampus following treatment with an γ-secretase inhibitor, suggesting improved neurotransmission and synaptic plasticity.
In addition to its diagnostic potential, MRS can monitor disease progression and track treatment efficacy. Longitudinal studies have shown that MRS can detect changes in metabolite levels over time, allowing for early detection of disease progression and monitoring of treatment responses [88]. Overall, proton MRS offers a non-invasive and highly specific method for diagnosing and monitoring AD, providing valuable insights into the underlying biochemical mechanisms driving this complex disorder.
Molecular diagnostic methods have revolutionized the field of AD diagnosis, enabling the detection of specific biomarkers in body fluids or tissues to accurately diagnose and monitor the progression of the disease. One such method is CSF analysis, which has been shown to be a reliable and non-invasive approach for detecting AD biomarkers [98]. The Aβ42 peptide, a hallmark of AD, is a common biomarker measured in CSF using enzyme-linked immunosorbent assay (ELISA) or mass spectrometry-based methods [99]. Elevated levels of Aβ42 in CSF have been consistently associated with AD pathology and cognitive decline, making it a valuable diagnostic tool in AD [100]. Another molecular diagnostic method is the measurement of tau protein, another key component of NFTs, a hallmark of AD pathology. Tau protein can be measured in CSF using ELISA or western blotting, and elevated levels have been linked to AD severity and progression [101]. Furthermore, the phosphorylated form of tau protein at specific residues (e.g., tau-181P) has been shown to be a more specific biomarker for AD than total tau protein levels [102]. This specificity is vital for an accurate diagnosis, as other neurodegenerative disorders, such as FTD, can also exhibit elevated tau protein levels.
Imaging-based molecular diagnostic methods have also gained popularity in recent years. Neuroimaging modalities shown in Table 1 are useful in diagnosis and disease progression monitoring. PET imaging with amyloid-binding tracers, such as [18F]florbetapir or [18F]flutemetamol, can visualize amyloid plaques in the brain with high accuracy, providing a non-invasive means of diagnosing AD [103–105]. These tracers target specific epitopes on the Aβ peptide, allowing for the detection of early-stage amyloid deposition before symptoms emerge. In addition to these established methods, novel approaches are being explored to improve the accuracy and sensitivity of molecular diagnostics for AD. For example, liquid biopsy analysis has been proposed as a promising technique for detecting circulating biomarkers in blood samples [106]. This approach involves analyzing circulating cell-free DNA or RNA fragments for AD-related biomarkers, which could potentially replace traditional tissue-based diagnostics.
Molecular diagnostic methods have become essential tools for diagnosing and monitoring AD. The combination of CSF analysis for Aβ42 and tau protein, PET imaging with amyloid-binding tracers, and emerging technologies like liquid biopsy analysis offers a multifaceted approach to diagnosing AD with high accuracy and specificity. As our understanding of disease pathophysiology continues to evolve, these methods will likely play a very important role in early diagnosis and treatment strategies [107–110].
PET allows visualization of AD from diverse perspectives by using radiolabeled agents involved in various pathophysiological processes [78, 111–113]. It helps to explore the patho-mechanisms of AD comprehensively and identify appropriate biomarkers for each phase of the disease [111]. PET scans can reveal information about brain metabolism, blood flow, and receptor-binding sites associated with AD. PET is a technique that can be used to identify the presence of Aβ in the brain. Specifically, it can detect the increasing buildup of fibrillar Aβ during the early stages of AD. However, once AD has progressed to the clinical stage, the levels of fibrillar Aβ tend to remain constant at high levels. There is a requirement for PET ligands to visually perceive smaller forms of Aβ, specifically oligomeric forms, within the brain. This is necessary to comprehend their interaction with synaptic activity and neurodegeneration [107, 114–118]. The PET imaging scan uses specific radioactive tracers that bind to these proteins: [18F]-labeled radiopharmaceuticals (i.e., [18F]florbetapir, [18F]florbetaben, and [18F]flutemetamol), 11-carborn-pittsburgh compound B ([11C]PiB) for Aβ, [18F]flortaucipir for tau protein, and many others [115, 116, 119–121]. PET is considered the benchmark in clinical neuroimaging due to its exceptional sensitivity, which is necessary for effectively penetrating deep tissues and visualizing the majority of interactions between physiological targets and ligands [122]. It has become the fastest-growing clinical neuroimaging tool and is currently one of the tools used in the diagnosis of AD.
In AD, PET radiopharmaceuticals have revolutionized the diagnosis and monitoring of the condition. One such example is [18F]florbetapir (Amyvid), which is an Aβ-targeting radiotracer used to visualize beta-amyloid plaques in the brain. This allows for the detection of early signs of AD, even before symptoms appear, and can aid in diagnosing MCI and distinguishing it from other dementias. Another example is [18F]florbetaben (Neuraceq), which is used to measure brain amyloid burden and help diagnose AD, as well as track its progression over time. Some studies have shown that PET imaging with these radiopharmaceuticals can predict conversion from MCI to AD with high accuracy, making them valuable tools for researchers and clinicians developing new treatments for AD [123]. The information in (Table 1) helps clinicians to select the best tracer depending on their characteristics.
PET radiopharmaceuticals and their clinical uses
| Tracer | Half-life | Target | MOA | Clinical uses | References |
|---|---|---|---|---|---|
| [18F]FDG | 109.8 min | Glucose metabolism | Measures of brain glucose metabolism and hypometabolism in AD | Assessment of brain glucose metabolism, monitoring disease progression, and evaluating response to treatment | [124] |
| [11C]PiB | 20.4 min | Aβ plaques | It binds to Aβ plaques and measures the amyloid burden in the brain | Assessment of amyloid burden, diagnosis of AD, and monitoring of disease progression | [125, 126] |
| [18F]AV-1451 (T807) | 109.8 min | Tau protein | Targets tau protein aggregation and phosphorylation in AD | Assessment of tau pathology, diagnosis of AD, and monitoring of disease progression | [127–129] |
| [18F]THK-5351 (T807) | 109.8 min | Aβ plaques and NFTs | It binds to both Aβ plaques and NFTs in the brain | Assessment of tau pathology, diagnosis of AD, and monitoring of disease progression | [130] |
| [18F]BF-227 (florbetaben) | 109.8 min | Aβ plaques | It binds to Aβ plaques and measures the amyloid burden in the brain | Assessment of amyloid burden, diagnosis of AD, and monitoring disease progression | [131] |
| [18F]Flutemetamol | 109.8 min | Aβ plaques | It binds to Aβ plaques and measures the amyloid burden in the brain | Assessment of amyloid burden, diagnosis of AD, and monitoring disease progression | [132, 133] |
| [11C]PBB3 | 20.4 min | Aβ plaques and NFTs | It binds to both Aβ plaques and NFTs in the brain | Assessment of amyloid burden, diagnosis of AD, and monitoring disease progression | [134] |
Aβ: amyloid beta; AD: Alzheimer’s disease; [18F]BF-227: 2-(4-(4-(2-[18F]fluoroethyl)thiazol-2-yl)phenoxy)-N-(4-(trifluoromethyl)phenyl)acetamide; [18F]FDG: 18F-fluorodeoxyglucose; [18F]AV-1451: fluorine-18 T807 (flortaucipir); MOA: mechanism of action; NFTs: neurofibrillary tangles; [11C]PBB3: pyridinyl-butadienyl-benzothiazole-3; [11C]PiB: 11-carborn-pittsburgh compound B; THK-5351: N-(1-(2-(dimethylamino)ethyl)-2-(4-(methylthio)phenyl)-2-oxoethyl)-3-fluorobenzeneacetamide; PET: positron emission tomography
Single photon emission computed tomography (SPECT) is another functional imaging technique that provides insight into regional changes in the brain blood flow, metabolism, and receptor binding sites related to AD. SPECT imaging has been widely used in the diagnosis of AD due to its ability to visualize changes in brain function and perfusion. Studies have shown that SPECT imaging can help differentiate AD from other dementias, such as FTD, by identifying characteristic patterns of regional cerebral blood flow (rCBF) and metabolism [96]. Specifically, SPECT imaging using agents such as technetium-99m-hexamethylpropyleneamine oxime (99mTc-HMPAO) or iodine-123 labeled 2-iodo-3-(N,N-dimethylamino) propylamine (123I-IMP) can detect reduced rCBF in the posterior regions of the brain, particularly the posterior cingulate cortex, which is a hallmark feature of AD [135]. In addition to that, SPECT imaging can also identify other changes in brain function, such as increased activity in the prefrontal cortex, which is associated with executive dysfunction in AD patients [136]. Furthermore, as proposed by Silverman et al. [137], SPECT imaging can be used to monitor disease progression and response to treatment, making it a valuable tool for diagnosing and managing AD. Overall, SPECT imaging has been recognized as a useful diagnostic tool for AD by organizations such as the Alzheimer’s Association and the European Association of Nuclear Medicine [138]. The SPECT radiotracers and their details (Table 2) help clinicians decide the best tracer to use depending on their characteristics.
SPECT radioactive pharmaceuticals and their clinical uses
| Tracers | Half-life | Target | MOA | Clinical use | References |
|---|---|---|---|---|---|
| 123I-IMP | 13.3 h | rCBF | Lipophilic tracer crosses BBB, binds to brain tissue in proportion to perfusion | Diagnosis of dementia, including AD | [139, 140] |
| 99mTc-HMPAO | 6.7 h | rCBF | Lipophilic tracer crosses the BBB, gets trapped in neurons, and reflects cerebral perfusion | Diagnosis and evaluation of AD, monitoring disease progression, and treatment response | [141] |
| 99mTc-ECD | 6 h | rCBF | Bind to brain tissue, reflecting rCBF | Evaluating cerebral perfusion, distinguishing AD from other dementias | [142–144] |
| 123I-AV-45 | 110 min | Aβ plaques | Binds to Aβ aggregates in the brain | Used to assess the presence of Aβ in AD | [68] |
| 123I-PiB | 13.3 h | Aβ plaques, tau protein | Amyloid-binding, PET-SPECT hybrid | Diagnosis of AD, differentiating AD from other dementias | [125, 145] |
| Benzathine (99mTc-Tc-BZ) | 6.3 h | Aβ plaques, BBB disruption | BBB disruption, SPECT-imaging of brain function and perfusion | Diagnosis of AD, monitoring disease progression, and treatment response | [146] |
123I-IMP: iodine-123 labeled 2-iodo-3-(N,N-dimethylamino) propylamine; 99mTc-HMPAO: technetium-99m hexamethylpropyleneamine oxime; 99mTc-ECD: technetium-99m ethyl cysteinate dimer; 123I-AV-45: iodine-123 amyvid (florbetapir); 123I-PiB: iodine-123 pittsburgh compound B; rCBF: regional cerebral blood flow; Aβ: amyloid beta; BBB: blood brain barrier; SPECT: single photon emission computed tomography; PET: positron emission tomography; AD: Alzheimer’s disease; MOA: mechanism of action
The selection of radiopharmaceutical tracers for neuroimaging in AD is a vital step in diagnosing and monitoring the progression of the disease. In AD, the goal is to identify the accumulation of Aβ plaques, NFTs, and cerebral amyloid angiopathy in the brain [147]. One of the most commonly used radiopharmaceutical tracers for AD imaging is [18F]florbetapir (Amyvid), which binds specifically to Aβ plaques in the brain. [18F]Florbetapir has been shown to be highly sensitive and specific for detecting AD pathology, with a sensitivity of 93% and a specificity of 92% compared to autopsy-based diagnoses [103]. Another widely used radiopharmaceutical tracer is [11C]PiB, which selectively binds to Aβ aggregates, a hallmark of AD. [11C]PiB has been shown to be highly effective in distinguishing between AD and other dementias, such as FTLD and Lewy body dementia (LBD) [148]. In addition to [18F]florbetapir and [11C]PiB, other radiopharmaceutical tracers have been developed for AD imaging. For example, [18F]florbetaben (Neuraceq) is a newer Aβ-binding radiopharmaceutical that has been shown to have high sensitivity and specificity for AD diagnosis [149]. Clinical trials on [18F]florbetaben (Neuraceq) have shown to be highly effective in detecting early-stage AD and differentiating it from other dementias [131, 150].
The selection of radiotracers for AD is influenced by several factors, including [151]: 1) target specificity [151]; 2) availability of radiotracers in the market, and their regulatory approval for clinical use [152]; 3) the choice of imaging modality, such as PET or SPECT [152, 153]; 4) the pharmacokinetics of a radiotracer; 5) patient factors, such as medical history, comorbidities, and contraindications [152]; 6) the level of research and clinical evidence supporting the use of a particular radiotracer for AD imaging [147, 152].
The Aβ imaging radiotracers approved by the Food and Drug Administration (FDA) for AD, along with their merits, include: [18F]florbetapir (Amyvid) is a PET imaging agent that targets the aggregation of Aβ in the brain. It was approved by the FDA in 2012 for the detection of Aβ plaques in patients with AD and other cerebral amyloidosis. [18F]Florbetapir binds to Aβ in the brain, allowing for visualization of these deposits on PET imaging. Merits include: 1) high sensitivity of about 93% and specificity of about 92% for detecting Aβ plaques in AD; 2) can be used to diagnose AD at an early stage; 3) may help identify individuals at risk of developing AD; 4) can be used to monitor disease progression and treatment response [132].
[18F]Florbetaben (Neuraceq) is another PET imaging agent that targets Aβ plaques in the brain. It was approved by the FDA in 2014 as a diagnostic aid to estimate the presence or absence of Aβ plaque deposition in the brain. Its merits are similar to those of [18F]florbetapir, and these include: 1) [18F]florbetaben has a high sensitivity of about 85% and a specificity of about 91% for detecting Aβ plaques; 2) it can be used to diagnose AD at an early stage; 3) it may help identify individuals at risk of developing AD; 4) it has a longer half-life than [18F]florbetapir, which may make it more convenient for patients [131, 132].
[18F]Flutemetamid (Vizamyl) is a PET imaging agent that targets Aβ plaques in the brain. It was approved by the FDA in 2018 as a diagnostic aid to estimate the presence or absence of Aβ plaque deposition in the brain. Merits are: 1) has a high sensitivity of about 92.6% and specificity of about 96% for detecting Aβ plaques in AD; 2) can be used to diagnose AD at an early stage; 3) may help identify individuals at risk of developing AD; 4) it has a shorter half-life than other Aβ imaging agents, which may make it more suitable for patients with kidney or liver impairment [132]. All three FDA-approved Aβ imaging radiotracers have high sensitivity and specificity for detecting Aβ plaques in the brain, making them useful diagnostic tools for AD. While they share similar merits, each has unique characteristics that may make it more suitable for certain patients or clinical scenarios.
Imaging Aβ tracers, in Table 1, are the most commonly used radiotracers that have been approved by the FDA for PET imaging of Aβ plaques in clinical settings. Other radiotracers, such as [11C]PiB and [18F]NAV4694 (AZD4694), are used for research purposes other than clinical use. Figure 2 shows some of the Aβ tracers for AD [4, 120, 147, 154, 155].
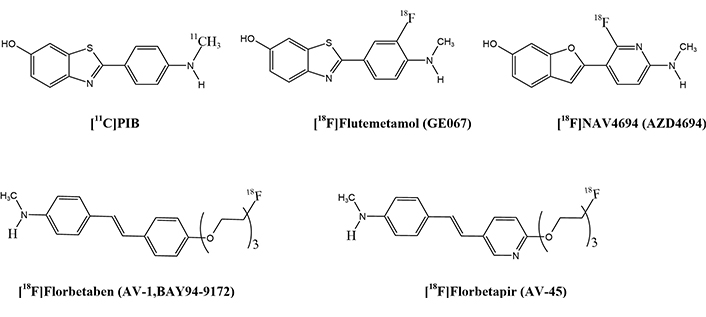
PET radiotracer structures for Aβ imaging. PET: positron emission tomography; Aβ: amyloid beta
Some limitations exist when comparing [11C]PiB to [18F] tracers like: 1) shorter half-life and on-site production requirement: [11C]PiB has a half-life of 20.3 min, requiring on-site production at a cyclotron, whereas [18F] tracers such as [18F]florbetapir have a longer half-life (109.7 min) and can be produced at a centralized facility [156, 157]. 2) The short half-life of [11C]PiB necessitates regular transportation from a nearby cyclotron or on-site production, which can be logistically challenging and expensive [158]. On the other hand, the transportation of [18F] tracers, such as [18F]florbetapir, is easier and more accessible [159]. 3) Due to the complexity of production and distribution, the cost of [11C]PiB is generally higher than that of [18F] tracers [160]. 4) Some studies have shown that [11C]PiB may have lower image quality in certain brain regions, such as the cerebellum, compared to [18F] tracers due to its shorter half-life and higher radiation dosing requirements, leading to lower image quality in certain regions [125]. 5) The higher radiation dose required for [11C]PiB imaging may result in higher patient radiation exposure compared to [18F] tracers, which could be a concern for long-term imaging studies or repeated scans [161]. 6) Commercial software for analyzing [11C]PiB images is less widespread than for [18F] tracers, which may limit the availability of accurate image analysis tools, leading to a limited availability of commercial software for image analysis [162]. 7) While [11C]PiB, [18F]florbetapir, [18F]flutemetamol, and [18F]florbetaben tracers are approved by regulatory agencies for research use, only few [18F] tracers are FDA-approved for clinical use, which may impact their adoption in clinical settings for the clinical diagnosis and differential diagnosis of AD. [18F]florbetapir, [18F]florbetaben, and [18F]flutemetamol have favorable binding and imaging properties [157]. Another promising tracer, [18F]NAV4694, is currently in clinical trials [147]. The longer half-life of these 18F-labeled tracers, approximately 109.7 min, allows for wider distribution and use in clinical settings. They are expected to produce less noisy images and provide more precise quantification of Aβ accumulation in the early stages of the disease due to increased radioactivity counts during the scan. Additionally, the imaging protocols for each tracer differ in terms of scanning window, visual interpretation, and quantitative analysis of the images [4, 120, 147, 155, 163].
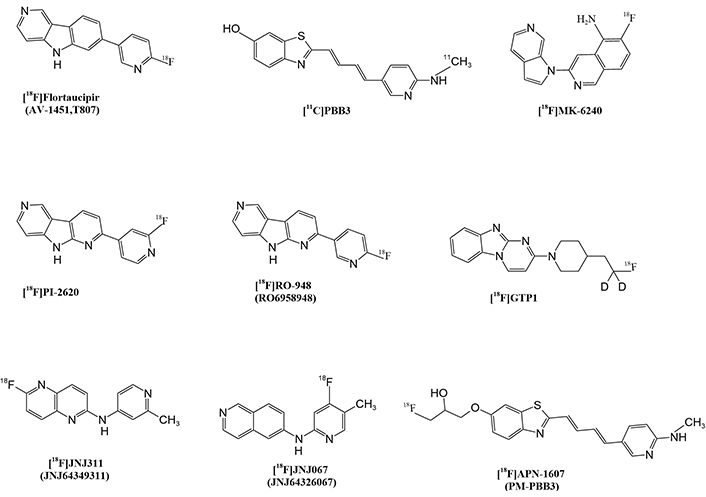
The tau protein tracers are used to visualize the accumulation of tau protein, a hallmark of AD, in the brain. Some of the tau protein tracers used include: 1) [18F]Flortaucipir, which was approved in 2018, is a radiolabeled ligand that binds to tau protein aggregates in the brain, allowing for visualization of tau pathology. It is used to help diagnose AD and monitor treatment responses in patients with MCI, or AD. The FDA approved [18F]flortaucipir based on the results of the fluorine-18 T807 (flortaucipir) ([18F]AV-1451) phase III clinical trial, which showed that the tracer was effective in detecting tau pathology in patients with AD and distinguished it from normal aging and other neurodegenerative disorders [164]. 2) [11C]PiB is also a tau protein-specific PET agent that was developed by Avid Radiopharmaceuticals and received FDA orphan drug designation for AD. While not yet approved for commercial use, it has been used in clinical trials to evaluate its efficacy in detecting tau protein pathology.
[11C]PiB is primarily designed to bind to Aβ plaques, a hallmark of AD pathology, rather than tau protein. However, some studies have reported that [11C]PiB can also bind to tau protein, although to a lesser degree than Aβ [159, 165]. [11C]PiB binds to soluble and insoluble tau protein with a higher affinity for tau tangles and NFTs [166]. The mechanism of action behind PiB’s binding to the tau protein is not fully understood, but it is believed to involve the same mechanism as its binding to Aβ, which involves the molecule’s ability to form hydrogen bonds and pi-cation interactions with the target protein [167, 168]. Despite [11C]PiB’s ability to bind to tau protein, other tau-binding tracers, such as [18F]-T807 and [35S]-BTA-1, have been developed as potential diagnostic tools for AD, offering more specific binding to tau protein pathology [69, 169, 170].
To identify and visualize brain damage caused by the accumulation of tau protein in AD and other types of dementia, scientists have designed tau protein tracers for trails including MK-6240 and pyridinyl-butadienyl-benzothiazole-3 ([11C]PBB3), as shown in Figure 3. These radiotracers are specifically designed to bind to tau protein tangles in the brain, allowing for accurate imaging and quantification of tau protein pathology [4, 171]. The [11C]PP3 radiotracer, for example, has a high affinity for tau protein and is suitable for imaging tau protein-related disorders [147]. The newer and second-generation selective tau protein tracers are currently being developed, including [18F]MK6240, [18F]RO-948, [18F]GTP1, [18F]JNJ-311, [18F]P12620, and [18F]JNJ-067, as shown in (Figure 3). These newer tracers are being designed to improve their in vivo characteristics, enabling more effective imaging and the diagnosis of tau protein-related diseases [147].
Tau protein tracers have several merits, including 1) improved diagnostic accuracy by helping to diagnose AD with higher accuracy than conventional imaging methods, such as MRI and CT scans; 2) earlier detection: detecting AD-related changes in the brain years before symptoms appear, allowing for earlier intervention and potentially improving treatment outcomes; 3) monitoring disease progression: tracking disease progression and monitoring the response to treatment, enabling more effective management of AD patients [119, 147, 154, 163, 171–173].
The inflammation tracers approved by the FDA for use in AD are radiolabeled ligands that bind to specific biomarkers of inflammation, allowing for imaging of the brain’s inflammatory activity. Among others, the most commonly used inflammation tracers include [11C]PK11195 and [18F]DPA-713. [11C]PK11195 tracer binds to the translocator protein (TSPO) on activated microglia, a type of immune cell in the brain that plays a vital role in inflammation. [11C]PK11195 has been approved by the FDA for use in diagnosing AD and has been shown to be sensitive to changes in brain inflammation over time [109]. [18F]DPA-713 tracer also binds to TSPO and has been shown to be more sensitive than [11C]PK11195 in detecting inflammation in the brains of AD patients [174]. [18F]DPA-713 has been approved by the FDA for use in clinical trials and is currently being evaluated for its potential as a diagnostic tool for AD.
Some of the merits of these tracers include: 1) high sensitivity and specificity for detecting inflammation in the brain [109, 174]; 2) the ability to quantify changes in brain inflammation over time, allowing for monitoring of disease progression [109]; 3) the potential to aid in the diagnosis and monitoring of treatment responses in AD [174]; 4) they are non-invasive and relatively safe, as they are administered as radiotracers and do not require tissue sampling [109].
These radiotracers allow for the precise targeting and visualization of specific molecular pathways involved in AD, providing valuable diagnostic information for both clinicians and patients [163]. [11C]PK11195 was the first successfully developed TSPO radiotracer for PET imaging in humans [147]. Several second-generation TSPO radioligands were developed and tested, including [11C]PBR28, [18F]DPA714, [18F]FEPPA, [11C]DAA1106, [18F]FEMPA, and [18F]FEDAA1106, as shown in Figure 4 [147]. While these radioligands are generally more sensitive than [11C]PK11195, research has revealed that their brain uptake is influenced by the TSPO gene rs6971 polymorphism. This means that individual subjects must be phenotyped to ensure accurate imaging results based on their TSPO affinity status. The third generation and most recent is [11C]ER176, which is being developed and evaluated is also shown in (Figure 4) [4, 109, 147, 163, 173, 175].
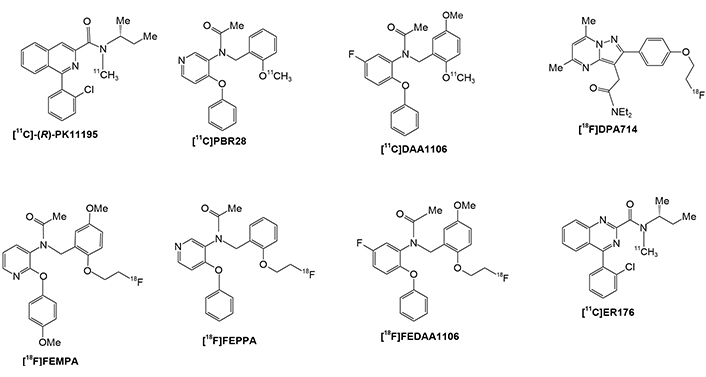
PET radiotracer structures for TSPO imaging. PET: positron emission tomography; TSPO: translocator protein
For over a decade, researchers have been trying hard to find out the diagnostic tools for AD. Currently, AD diagnosis is primarily based on neuropsychological testing. Clinically diagnosing AD requires neuroimaging [78] and monitoring accepted biomarkers, such as the accumulation of Aβ peptides as well as total and hyperphosphorylated tau protein in CSF [118, 132, 176–178].
Neuroimaging plays a vital role in the diagnosis of AD, a progressive neurological disorder characterized by cognitive decline, memory impairment, and brain atrophy. The primary neuroimaging modalities used in the diagnosis of AD include MRI and PET scans [179]. MRI provides structural information about the brain, allowing for the detection of atrophy, particularly in the hippocampus and entorhinal cortex, which are regions commonly affected in AD. On the other hand, PET scans utilize radiotracers to visualize regional brain glucose metabolism, Aβ deposition, and tau protein, which are hallmark features of AD [125]. Among others, [11C]PiB, [18F]florbetapir, [18F]florbetaben, [18F]flortaucipir, and 18F-fluorodeoxyglucose ([18F]FDG), are the most commonly used PET tracers, which bind to Aβ plaques, fibrillary tau protein aggregates, and also utilization of glucose metabolism in the brain by [18F]FDG, to visualize and identify the biomarkers [126]. These imaging biomarkers can help differentiate AD from other dementias, such as FTD, and provide an objective measure of disease progression [180]. Furthermore, neuroimaging can aid in monitoring treatment responses and identifying potential therapeutic targets. For instance, amyloid-targeted therapies such as monoclonal antibodies may reduce Aβ load as measured by PET scans, indicating treatment efficacy [181]. Research findings indicate that damage to the neurons in the hippocampus is observed as a reduction in the volume of the hippocampus. Volumetric MRI images of the hippocampus atrophy are a commonly used approach to evaluate AD pathology. MRI has proven to be a highly effective method for evaluating the size of the hippocampus. It can accurately estimate the volume of the hippocampus, which is strongly associated with the number of neurons present. This indicates that volumetric MRI measures are anatomically reliable. Furthermore, a separate study discovered that decreases in the size of the hippocampus are initial signs of AD pathology, which can be measured using MRI [182]. MRI can be used to study the pathogenesis of the disease as well as the progress of the disease [182, 183].
While PET and SPECT imaging agents are generally well-tolerated, some compounds, including 1) amyloid PET imaging agents such as [11C]PiB, [18F]florbetapir, [18F]florbetaben, and [18F]flutemetamol, may cause allergic reactions: hypersensitivity reactions are rare but possible [184]. Headache, nausea, and dizziness: As stated by Ossenkoppele et al. [185], are common mild side effects post-injection. Radiation exposure: As proposed by Klunk et al. [186], though are low, repeated PET scans increase cumulative radiation exposure. In addition, contrast agents used in MRI-based neuroimaging may induce nephrogenic systemic fibrosis (NSF) in patients with kidney dysfunction [187]. 2) Tau PET imaging agents, such as [18F]AV-1451 (flortaucipir) and [18F]PI-2620, may have some side effects like injection-site reactions. As stated by Marquié et al. [188], mild pain, redness, or swelling at the administration site are observed. Nausea and fatigue: As proposed by Schöll et al. [170], transient symptoms observed in clinical trials. Off-target binding: As stated by Chien et al. [189], certain tau protein tracers bind to non-target regions, leading to diagnostic challenges and unnecessary follow-ups. 3) SPECT imaging agents, such as [123I]ioflupane (DaTscan), [99mTc]HMPAO, and [99mTc]ECD, as stated by Booij and Knol [190], may have some adverse effects like thyroid exposure: iodine-based tracers may require thyroid blocking to reduce uptake; metallic taste: reported in some patients after injection [191]; mild changes in blood pressure: rare but documented in some individuals [192]. Mild side effects such as headaches, dizziness, nausea, and mild allergic reactions may be observed. As proposed by Barthel and Sabri [193], radiopharmaceuticals expose patients to ionizing radiation, which, though low, poses cumulative risks with repeated imaging. Additionally, contrast agents used in MRI-based neuroimaging may induce NSF in patients with kidney dysfunction [187]. 4) Gadolinium-based contrast agents (GBCAs; MRI imaging): While not specific to AD, GBCAs used in MRI to detect brain atrophy or vascular abnormalities have potential risks: NSF, which is a concern in patients with kidney impairment [194]. Gadolinium retention: As stated by McDonald et al. [195], trace amounts can accumulate in the brain and other organs, though clinical significance remains unclear. 5) Long-term safety considerations: As proposed by Mattsson et al. [196], cumulative exposure risks: repeated imaging can contribute to radiation dose accumulation, raising concerns about long-term safety. Psychological impact: false positives or uncertain imaging findings may cause anxiety and unnecessary interventions [197].
Over-diagnosis of AD can occur due to misinterpretation of amyloid imaging, comorbid conditions, and age-related cognitive decline. Strategies to prevent over-diagnosis include: 1) integrating multimodal biomarkers (such as tau PET, CSF analysis, and neuropsychological tests) instead of relying solely on amyloid imaging [198]; 2) biomarker validation: As stated by Hansson [199], the use of validated biomarkers, such as amyloid PET imaging, CSF tau protein and Aβ levels, and blood-based biomarkers, enhances diagnostic accuracy and reduces false-positive diagnoses; 3) following updated clinical guidelines (e.g., NIA-AA criteria) to distinguish AD from MCI and normal aging [200]; 4) educating clinicians about the limitations of amyloid PET, as amyloid deposition alone does not confirm symptomatic AD [201, 202]; 5) cognitive testing standardization: As proposed by Sperling et al. [203], comprehensive neuropsychological assessments should be standardized to minimize false positives due to age-related cognitive decline or reversible conditions such as depression or medication side effects; 6) avoiding over-reliance on imaging: As stated by Dubois et al. [201], while neuroimaging (e.g., MRI, PET) is valuable, it should be interpreted alongside clinical symptoms and other biomarkers to avoid misdiagnosis due to incidental amyloid deposition, which can occur in cognitively normal elderly individuals; 7) differential diagnosis consideration: As proposed by McKhann et al. [204], clinicians should rule out alternative causes of cognitive impairment, such as vascular dementia, LBD, metabolic disorders, or psychiatric conditions, to prevent misclassification as AD; 8) ethical and clinical considerations: As stated by Karlawish [205], physicians should communicate diagnostic uncertainty and avoid premature labeling of patients, which can have psychological and social consequences [205, 206].
Neuroimaging techniques, such as MRI, PET, and MRS, have been extensively used to assess the progression of AD by providing valuable information on brain structure, function, and biochemistry [207]. MRI is particularly useful for monitoring structural changes in the brain, including cortical thinning and hippocampal atrophy, which are characteristic features of AD [208]. Studies have shown that MRI can detect changes in brain structure up to 10 years before clinical symptoms appear, making it a valuable tool for early diagnosis and monitoring disease progression [209]. PET imaging with amyloid ligands, such as [11C]PiB, can quantify Aβ deposition in the brain, a hallmark of AD pathology [209]. This technique has been used to track disease progression by monitoring the accumulation of Aβ plaques in the brain over time [210]. Additionally, PET imaging with [18F]-FDG can assess glucose metabolism in the brain, which is decreased in AD patients. This technique has been used to monitor changes in brain glucose metabolism during disease progression [95]. MRS is another neuroimaging modality that has been used to monitor disease progression in AD. MRS can measure changes in brain metabolites, such as NAA, which is a marker of neuronal integrity. As proposed by Graff-Radford and Kantarci [88], it was shown that NAA levels decrease in AD patients, and this decrease can be used as a biomarker of disease progression. The combination of these neuroimaging techniques has been shown to provide a comprehensive understanding of disease progression in AD. For example, a study used MRI to monitor cortical thinning, PET with [11C]PiB to track Aβ deposition, and MRS to measure changes in brain metabolites. The researcher found that these techniques were able to accurately predict disease progression over a period of 3 years [182]. Neuroimaging techniques such as MRI, PET, and MRS provide valuable information on brain structure, function, and biochemistry, allowing researchers and clinicians to track changes in the brain over time. These changes can be used to diagnose and monitor disease progression, making it possible to develop effective treatment strategies and improve patient outcomes [211].
Effective evaluation of drug efficacy provides important information for drug development and treatment plan selection. Efficacy indicators should reflect drug effectiveness, with high repeatability and feasibility. The key steps involved in evaluating drug efficacy for AD using imaging techniques [212] include 1) define the target; 2) select a radiotracer [84, 212]; 3) baseline imaging; 4) assess drug intervention; 5) quantify imaging data; 6) correlate imaging findings with clinical outcomes; 7) conduct multi-center trials. Multi-center trials can enhance the robustness and generalizability of the findings, supporting the potential use of neuroimaging as a technique for drug efficacy in AD [182, 213].
Clinical trials involving anti-amyloid monoclonal antibodies such as aducanumab, lecanemab, and donanemab showed that anti-amyloid monoclonal antibodies remove or prevent the formation of Aβ plaques to slow or halt disease progression [214]. Each of these anti-amyloid monoclonal antibodies has undergone clinical trials with neuroimaging assessments. As stated by Budd Haeberlein et al. [215], aducanumab was tested in patients with early AD in the EMERGE study, where MRI and FDG-PET were used to assess changes in brain volume and glucose metabolism. The study showed significant reductions in amyloid burden on amyloid PET scans, as well as improvements in cognition and function [215]. Similarly, lecanemab was evaluated in patients with MCI or mild AD in the CLARITY AD study, where MRI and amyloid PET were used to assess changes in brain volume and amyloid burden. The study demonstrated significant reductions in amyloid burden on amyloid PET scans and a slowing of cognitive decline [216]. Donanemab is a humanized monoclonal antibody that targets soluble Aβ oligomers, a hallmark of AD. In clinical trials, donanemab has been shown to reduce the levels of Aβ in the CSF and plasma of patients with mild MCI or early-stage AD [217, 218]. The phase 2b study of donanemab, known as the A4 trial, involved 540 patients with MCI or early-stage AD and demonstrated that treatment with donanemab significantly reduced CSF Aβ levels by up to 80% compared to placebo [219]. Additionally, the study found that patients treated with donanemab showed slower cognitive decline and improved cognitive function compared to placebo-treated patients [217, 219]. The results of the A4 trial suggest that targeting Aβ oligomers with donanemab may be a promising therapeutic approach for early-stage AD [220, 221].
Neuroimaging plays a crucial role in the diagnosis, monitoring of disease progression, research, and personalized treatment of AD. By enabling the visualization of specific molecular targets in the brain, such as amyloid plaques and tau protein tangles, neuroimaging techniques provide valuable insights into the underlying pathology of AD and aid in accurate diagnosis and disease monitoring. Furthermore, neuroimaging also serves as a useful tool for research purposes, facilitating the development of new therapeutic strategies and drug targets for AD.
Looking forward, the continued advancement of neuroimaging technologies holds great promise for improving our understanding of AD and ultimately finding more effective treatments. Further research in this field will likely lead to the development of novel imaging agents that target different aspects of Alzheimer’s pathology and enable an earlier and more accurate diagnosis. Additionally, the integration of neuroimaging into clinical trials and personalized medicine approaches has the potential to revolutionize the way we treat and manage AD in the future. Overall, neuroimaging is a valuable tool that will continue to play a crucial role in the fight against AD.
[11C]PiB: 11-carborn-pittsburgh compound B
[18F]AV-1451: fluorine-18 T807 (flortaucipir)
[18F]FDG: 18F-fluorodeoxyglucose
AD: Alzheimer’s disease
APP: amyloid precursor protein
Aβ: amyloid beta
BBB: blood brain barrier
CSF: cerebrospinal fluid
CT: computed tomography
FDA: Food and Drug Administration
fMRI: functional magnetic resonance imaging
FTD: frontotemporal dementia
MAPK: mitogen-activated protein kinase
MCI: mild cognitive impairment
MRI: magnetic resonance imaging
MRS: magnetic resonance spectroscopy
NAA: N-acetyl aspartate
NFTs: neurofibrillary tangles
NF-κB: nuclear factor kappa-light-chain-enhancer of activated B cells
NSF: nephrogenic systemic fibrosis
p38 MAPK: p38 mitogen-activated protein kinase
PET: positron emission tomography
rCBF: regional cerebral blood flow
ROS: reactive oxygen species
SPECT: single photon emission computed tomography
TSPO: translocator protein
We acknowledge the support of the Department of Nuclear Medicine at Nanjing First Hospital.
JM: Writing—original draft. RD: Conceptualization, Writing—review & editing. BL: Writing—review & editing. JW: Writing—review & editing. MS: Writing—review & editing. FW: Conceptualization, Supervision, Writing—review & editing, Funding acquisition. YY: Conceptualization, Investigation, Writing—review & editing.
The authors declare that they have no conflicts of interest.
Not applicable.
Not applicable.
Not applicable.
Not applicable.
This work is supported by the National Key Research and Development Program of China [2022YFC2406900]; the Key subjects of nuclear medicine: Jiangsu Provincial Institute of Medical Sciences [JSDW202247]; Jiangsu Provincial Medical Key Discipline Cultivation Unit [JSDW202247]; Nanjing International/Hong Kong, Macao, and Taiwan Science and Technology Cooperation Program Project [202308005]; the National Natural Science Foundation of China [82301609]; China Postdoctoral Science Foundation [2022M711666]; Natural Science Foundation of Jiangsu Province [BK20220196]; the International Joint Research and Development Project of Nanjing [202201030]; the International Joint Research and Development Project of Nanjing [202308005]. The funders had no role in study design, data collection and analysis, decision to publish, or preparation of the manuscript.
© The Author(s) 2025.
Open Exploration maintains a neutral stance on jurisdictional claims in published institutional affiliations and maps. All opinions expressed in this article are the personal views of the author(s) and do not represent the stance of the editorial team or the publisher.
Copyright: © The Author(s) 2025. This is an Open Access article licensed under a Creative Commons Attribution 4.0 International License (https://creativecommons.org/licenses/by/4.0/), which permits unrestricted use, sharing, adaptation, distribution and reproduction in any medium or format, for any purpose, even commercially, as long as you give appropriate credit to the original author(s) and the source, provide a link to the Creative Commons license, and indicate if changes were made.

Janusz Wiesław Błaszczyk
Tatsushi Yuri ... Hisashi Nojima
Priyanka Sengupta ... Debashis Mukhopadhyay
Danqing Xiao, Chen Zhang
Carlos Gutierrez-Merino
Felipe P. Perez ... Maher Rizkalla
Ezra C. Holston
Jorge Medeiros
Ryszard Pluta