
Abstract
To quantitatively analyze the effects of acoustic neurostimulation on the symptoms of depression, anxiety, stress, and sleep quality in healthy workers. Eleven physiological and psychological variables (V1–V11) representing stress levels, sleep quality, and cortisol levels were acquired from a recent article (https://doi.org/10.37349/ent.2023.00064) that analyzed the effects of brainwave entrainment (BWE) techniques—binaural beats (BB), isochronic tones (IT), or a combination of the two (BB + IT). Principal component analysis (PCA) was used to create principal components to analyze the contribution of each variable to the efficacy. A thermodynamic cycle and equations based on a Venn diagram were used to understand the differences in treatment effectiveness in individual and combined auditory stimulations. PCA reduced the dimensionality of variables from eleven to three. PC1 represented auditory treatment efficacy, while neither PC2 nor PC3 did. All eleven variables had a negative correlation to PC1, with stress (V3) showing the most negative correlation and salivary cortisol level (V11) showing the least. Treatments using BB were more effective than treatments with IT or BB + IT. PCA successfully aided in the analysis of auditory treatment efficacies. All examined variables, especially the stress scale (V3), had a negative correlation in treatment efficacy, aligning with the results of the original paper. Analysis using the thermodynamic cycle and Venn diagram based on PCA provided an explanation why a combined treatment (BB + IT) was less effective than BB alone in the collective consideration of all eleven variables. This study demonstrates that the thermodynamic cycle and Venn diagram in conjunction with PCA are useful analytical tools for the quantitative analysis of multi-factor systems.
Keywords
Acoustic neurostimulation, sleep, stress, anxiety, depression, PCA, thermodynamic cycle, Venn diagramIntroduction
In a recent article published in Exploration of Neuroprotective Therapy, Kanzler et al. [1] presented their findings on the listening of brainwave entrainment (BWE) and the effects it has on sleep, depression, stress, and anxiety after 21 days. The research is deemed to be interesting and timely for two reasons. First, the prevalence of mental disorders including anxiety, depression, stress, and sleep disorders, underscores the need for effective interventions to improve the quality of life for individuals. While traditionally viewed as distinct entities, accumulating evidence suggests intricate interconnections among these constructs, emphasizing the importance of examining them within a comprehensive framework [2]. Second, there is growing interest in the application of acoustic neurostimulation for the treatment of various neuropsychological symptoms [3, 4].
The authors utilized the non-parametric Friedman and Wilcoxon tests for univariate analysis and emphasized the interconnectedness of mental health issues. Although the univariate analysis yielded crucial insights into the significant effects of acoustic neurostimulation on the mentioned mental disorders, we found that multivariate statistical analysis could provide a comprehensive picture of the effects of acoustic neurostimulation employed in the original paper.
Principal component analysis (PCA) is a multivariate statistical technique that is often used to reduce the dimensionality of large data sets [5]. PCA has been employed in biomedical sciences such as immunology [6] and neuroscience [7]. In this article, we provide our analysis on the effects of acoustic neurostimulation on depression, anxiety, sleep, and stress via PCA, as well as further supporting quantitative features.
Materials and methods
The original paper investigated the effects of four different sounds on eleven psychological and physiological variables of healthy workers, both before and after 21-day treatments. These variables were obtained from the original paper (Table 1). Our analysis included eight observations (four types of sounds and pre- and post-treatments) and eleven variables. We conducted PCA with a correlation matrix in SigmaPlot (Version 15, Inpixon, Palo Alto, CA) due to disparate units and wide ranges of magnitudes among variables. Outlier detection was performed using Mardia’s method [7].
Numerical values of each variable in the loadings plot
| Variable | Description※ | PC1 | PC2 | PC3 |
|---|---|---|---|---|
| V1 | Anxiety | 0.825 | 0.169 | –0.500 |
| V2 | Depression | 0.747 | 0.549 | –0.212 |
| V3 | Stress | 0.940 | 0.213 | –0.184 |
| V4 | Subjective quality of sleep | 0.847 | –0.193 | 0.307 |
| V5 | Sleep duration | 0.878 | –0.00237 | –0.254 |
| V6 | Sleepiness and daytime dysfunction | 0.861 | 0.107 | –0.134 |
| V7 | Sleep latency | 0.794 | –0.508 | 0.214 |
| V8 | Sleep disorders and daytime dysfunction | 0.760 | 0.449 | 0.397 |
| V9 | Use of hypnotics | 0.844 | –0.388 | 0.252 |
| V10 | Sleep efficiency | 0.734 | –0.616 | 0.0716 |
| V11 | Salivary cortisol | 0.191 | 0.864 | 0.446 |
※ Detailed explanations of each variable can be found in the original paper [1]. PC: principal component
Results
Our PCA results are shown in Figure 1. PCA accomplished the reduction of dimensionality from eleven to three, with principal components 1 to 3 accounting for 90.8% of the variability in the data (Figure 1A). This aids in visually and numerically analyzing the relationship between the eight groups (observations) in the original paper [1], as they can be shown in two sets of two-dimensional score plots (Figure 1B and Figure 1C). Principal component 1 (PC1), which accounts for 62.3% of variability, successfully captures the effectiveness of treatment with auditory stimuli, as all the treatments show a shift in a left-ward direction (Figure 1B and Figure 1C). In contrast, PC2 and PC3, which account for 19.6% and 8.9% of the variability, respectively, show no consistent patterns in terms of treatment effect (Figure 1B and Figure 1C). The control and isochronic tones (IT) groups decrease on PC2, while the binaural beats (BB) and BB + IT groups increase (Figure 1B). For PC3, BB increases, while the other treatments show decrease. Therefore, we cannot associate either PC2 or PC3 with treatment efficacy.
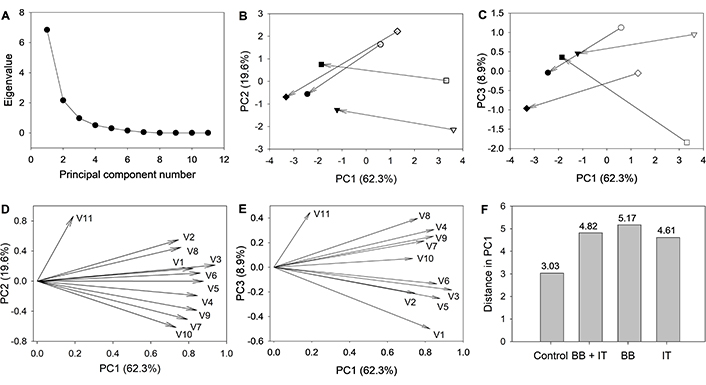
Results of the eleven psychological/physiological variables for the eight observations. (A) Scree plot. (B and C) Score plots of the eight observations in the PC1 vs. PC2 plane (B) and the PC1 vs. PC3 plane (C). Open symbols represent pre-treatments and closed symbols represent post-treatments: control (circle), combination of BB and IT (triangle), BB (square), and IT (diamond). The arrows between data points indicate the effects of each treatment. (D and E) PCA loadings plot of the eleven variables. (F) Distances between pre- and post-treatment in each group in the PC1. PC: principal component; BB: binaural beats; IT: isochronic tones; PCA: principal component analysis
The contribution by each variable to PC1, PC2, and PC3 can be identified from the loadings plot (Figure 1D and Figure 1E). For PC1, all variables from V1 to V11 have a negative correlation with treatment efficacy, with V3 showing the highest negative correlation. While this observation is consistent with the original paper’s findings that all treatments reduce symptoms of stress, depression, and anxiety, and improve sleep quality, our PCA specifically identified that stress (V3) gains the most beneficial effect (Table 1 and Figure 1D). Unlike any other variables, the correlation of V11 is considerably weaker on PC1 dimension. This means that even though salivary cortisol level (V11) responds to the acoustic neurostimulations, the response does not have a consistent pattern; it decreases in the control and IT groups but increases in the BB and BB + IT groups [1].
Treatment effectiveness can be quantitatively identified by measuring the numerical distance (D) between pre- and post-treatment in the groups with equation (1):
where PC1 (pre) and PC1 (post) are the PC1 coordinate values of pre and post treatment of each group (Figure 1F). According to our analysis, treatment with BB, IT, and a combination of BB + IT all showed an increase in treatment efficacy compared to the control. The distances between pre- and post-treatment with BB (5.17) were the largest distance compared to pre- and post-treatment with IT (4.61), as well as pre- and post-treatment with BB + IT (4.82). This indicates that treatment is more effective with BB. Interestingly, the control group treated with white noise shows positive effects (Figure 1F). This is consistent with a previous study [8] that demonstrated the beneficial effects of white noise on sleep quality.
According to our calculations (Figure 1F), the combined treatment (BB + IT) has a lower effect than BB alone. This is not intuitively clear, since IT alone has a higher effect than the control group. Therefore, we quantitatively analyzed this apparent conundrum to better understand the action of acoustic neurostimulations using thermodynamic formalism.
In biochemical applications of thermodynamics, multiple effects can be analyzed using a thermodynamic cycle. This method is well established, and we showed the effectiveness in our previous research [9]. By treating the distance (D) in Figure 1F as a thermodynamic state function [10], we constructed a thermodynamic cycle of acoustic neurostimulation (Figure 2A). To understand why the combined treatment has a lesser effect, a Venn diagram was constructed (Figure 2B), where each circle represents the improved effects of BB or IT compared with the control: a + b represents BB and b + c represents IT effects, respectively. From the thermodynamic cycle (Figure 2A), one can establish the following system of equations:
where equation (4) represents the combined treatment (BB + IT), which was calculated as 4.82 – 3.03 = 1.79 (Figure 1F). By solving the system of equations, we found the following values for each unknown: a = 0.21, b =1.93, and c = –0.35.
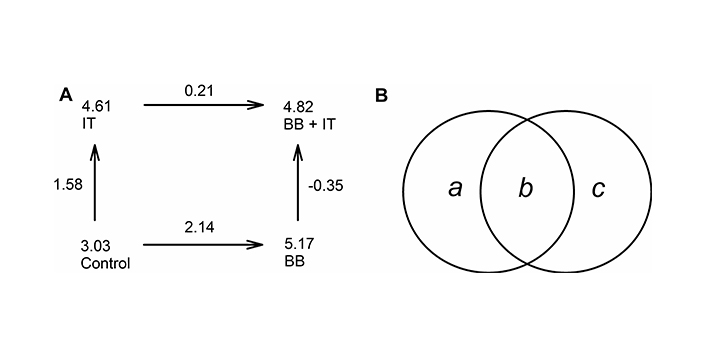
Quantitative analysis of the effectiveness of acoustic neurostimulations. (A) Thermodynamic cycle. The numbers next to the arrows represent the enhancement of each step. (B) Venn diagram of effectiveness of BB and IT treatments. BB: binaural beats; IT: isochronic tones
We can now quantitatively explain why the combined treatment is less effective than BB alone using these values. First, the action of BB and IT has an overlap, which is represented by parameter b. Because of the overlap, the combined treatment has a less effect than the sum of individual treatment of BB and IT. Second, IT has a negative component in its effect, which corresponds to c in the Venn diagram (Figure 2B).
Discussion
The original study by Kanzler et al. [1] investigated the impact of acoustic neurostimulation on depression, anxiety, stress, and sleep quality using BB and IT, finding significant improvements in all these areas. This study used univariate statistical analysis to examine each effect individually, highlighting the interconnectedness of mental health conditions. In contrast, our analysis employs PCA for a comprehensive multivariate view of the same data, revealing several new clinical implications not evident from the original univariate approach:
PCA reduced eleven variables to three principal components, which account for 90.8% of the variability, thereby simplifying the visualization and understanding of variable interactions and treatment effects. The creation of two sets of two-dimensional score plots and loadings plots facilitates a clearer visualization and comprehension of how the variables interact and contribute to the overall effects of the treatments.
PCA showed that PC1, which accounts for 62.3% of the variability, reflects overall treatment effectiveness, with consistent mental health improvements from auditory stimuli. In contrast, PC2 (19.6%) and PC3 (8.9%) revealed no consistent patterns, indicating that these components did not capture improvements evenly.
By calculating the distance between pre-and post-treatment, the study found that BB alone was more effective than IT or their combination (BB + IT).
The combination of PCA, thermodynamic cycle analysis, and Venn diagrams provided a quantitative explanation for why the combined treatment (BB + IT) was less effective than BB alone. The analysis revealed an overlap between BB and IT and a negative component in IT’s effect, which reduced the overall efficacy of the combined treatment. To our knowledge, this work is the first demonstration that integrating thermodynamic cycle analysis with Venn diagrams can be useful for evaluating multi-factor treatments.
While our analysis identified various quantitative features in the interactions between acoustic stimuli and psychological/physiological responses, it did not uncover the underlying molecular mechanisms. Nonetheless, we hope that the insights gained from our analysis will inform future research.
In conclusion, BB is the most effective acoustic stimulation for reducing psychological stress and sleep disturbances. Due to the overlap between BB and IT, the combined treatment (BB + IT) is less effective than BB alone.
Abbreviations
| BB: | binaural beats |
| IT: | isochronic tones |
| PC: | principal component |
| PCA: | principal component analysis |
Declarations
Acknowledgments
The authors appreciate Madeline Higdon for her critical proofreading of the manuscript.
Author contributions
RCB and JRH: Investigation, Writing—original draft, Writing—review & editing. JK: Conceptualization, Investigation, Writing—original draft, Writing—review & editing, Supervision. All authors read and approved the submitted version.
Conflicts of interest
The authors declare that there are no conflicts of interest.
Ethical approval
Not applicable.
Consent to participate
Not applicable.
Consent to publication
Not applicable.
Availability of data and materials
The manuscript involves secondary analysis of data, which are available in the original paper [https://doi.org/10.37349/ent.2023.00064]. Additional supporting data are available from the corresponding author upon request.
Funding
Not applicable.
Copyright
© The Author(s) 2024.